Norwich, VT (Vermont) Houses and Residents
Estimated median house or condo value in 2022: $630,624 (it was $253,100 in 2000 )
Norwich:
$630,624Vermont:
$304,700
Lower value quartile - upper value quartile: $315,354 - $864,614Total population: 3,414 (Urban population: 907 (all inside urban clusters), Rural population: 2,637 (42 farm, 2,595 nonfarm ))
Houses: 1,505 (1,367 occupied: 1,044 owner occupied, 323 renter occupied )
% of renters here:
24%State:
26%
Housing density: 34 houses/condos per square mile
Median price asked for vacant for-sale houses and condos in 2022 in this county: $201,418.
Median contract rent in 2022: $1,277 (lower quartile is $1,070, upper quartile is $1,654)
Median rent asked for vacant for-rent units in 2022: $2,307
Median gross rent in Norwich, VT in 2022: $1,681
Housing units in Norwich with a mortgage: 456 (38 second mortgage, 85 home equity loan, 0 both second mortgage and home equity loan )Houses without a mortgage: 190
Data:
Median house or condo value ($)
Median house or condo value ($ change since 2000)
Median house or condo value ($) - White
Median house or condo value ($) - Black or African American
Median house or condo value ($) - Asian
Median house or condo value ($) - Hispanic or Latino
Median house or condo value ($) - American Indian and Alaska Native
Median house or condo value ($) - Multirace
Median house or condo value ($) - Other Race
Median price asked for mobile homes ($)
Household density (households per square mile)
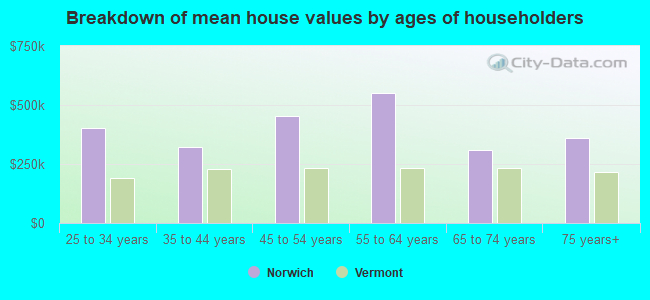
Mean house or condo value by units in structure - 1, detached ($)
Mean house or condo value by units in structure - 1, attached ($)
Mean house or condo value by units in structure - 2 ($)
Mean house or condo value by units in structure by units in structure - 3 or 4 ($)
Mean house or condo value by units in structure - 5 or more ($)
Mean house or condo value by units in structure - Boat, RV, van, etc. ($)
Mean house or condo value by units in structure - Mobile home ($)
Median contract rent ($)
Median contract rent - Lower quartile ($)
Median contract rent - Upper quartile ($)
Median gross rent ($)
Urban houses (%)
Rural houses (%)
Houses occupied (%)
Houses occupied (% change since 2000)
Houses owner occupied (%)
Houses owner occupied (% change since 2000)
Houses renter occupied (%)
Houses renter occupied (% change since 2000)
Vacant housing units - For rent (%)
Vacant housing units - For rent (% change since 2000)
Vacant housing units - For sale only (%)
Vacant housing units - For sale only (% change since 2000)
Vacant housing units - Rented or sold, not occupied (%)
Vacant housing units - Rented or sold, not occupied (% change since 2000)
Vacant housing units - For seasonal, recreational, or occasional use (%)
Vacant housing units - For seasonal, recreational, or occasional use (% change since 2000)
Vacant housing units - For migrant workers (%)
Vacant housing units - For migrant workers (% change since 2000)
Vacant housing units - Other vacant (%)
Vacant housing units - Other vacant (% change since 2000)
Median monthly housing costs ($)
Median household income for houses/condos with a mortgage ($)
Median household income for houses/condos without a mortgage ($)
Median household income ($)
Median household income ($) - White
Median household income ($) - Black or African American
Median household income ($) - Asian
Median household income ($) - Hispanic or Latino
Median household income ($) - American Indian and Alaska Native
Median household income ($) - Multirace
Median household income ($) - Other Race
Mortgage status - with mortgage (%)
Mortgage status - with second mortgage (%)
Mortgage status - with home equity loan (%)
Mortgage status - with both second mortgage and home equity loan (%)
Mortgage status - without a mortgage (%)
Median year house/condo built
Median year apartment built
Household type by relationship - Male householder living alone (%)
Household type by relationship - Male householder not living alone (%)
Household type by relationship - Female householder living alone (%)
Household type by relationship - Female householder not living alone (%)
Household type by relationship - Opposite-Sex spouse (%)
Household type by relationship - Same-Sex spouse (%)
Household type by relationship - Opposite-Sex unmarried partner (%)
Household type by relationship - Same-Sex unmarried partner (%)
Household type by relationship - In group quarters (%)
Size of family households - 2-person household (%)
Size of family households - 3-person household (%)
Size of family households - 4-person household (%)
Size of family households - 5-person household (%)
Size of family households - 6-person household (%)
Size of family households - 7-or-more-person household (%)
Size of nonfamily households - 1-person household (%)
Size of nonfamily households - 2-person household (%)
Size of nonfamily households - 3-person household (%)
Size of nonfamily households - 4-person household (%)
Size of nonfamily households - 5-person household (%)
Size of nonfamily households - 6-person household (%)
Size of nonfamily households - 7-or-moreperson household (%)
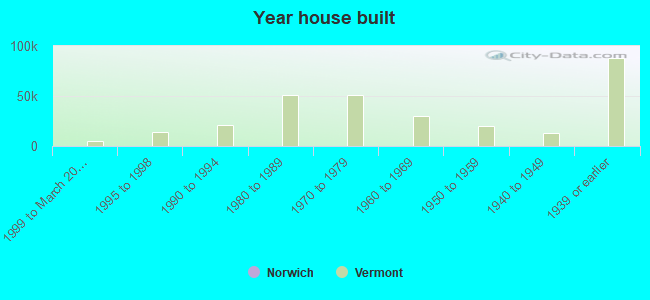
Year house built - Built 2010 or later (%)
Year house built - Built 2000 to 2009 (%)
Year house built - Built 1990 to 1999 (%)
Year house built - Built 1980 to 1989 (%)
Year house built - Built 1970 to 1979 (%)
Year house built - Built 1960 to 1969 (%)
Year house built - Built 1950 to 1959 (%)
Year house built - Built 1940 to 1949 (%)
Year house built - Built 1939 or earlier (%)
Median number of rooms in houses and condos
Median number of rooms in apartments
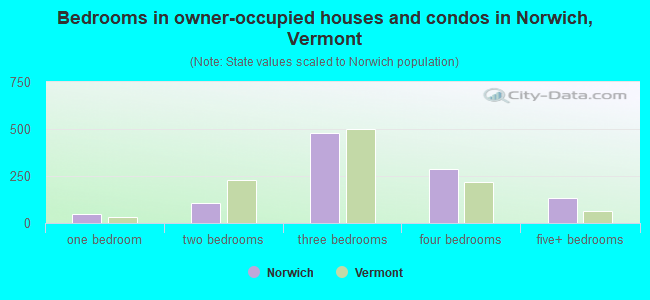
Median number of bedrooms in owner occupied houses
Mean number of bedrooms in owner occupied houses
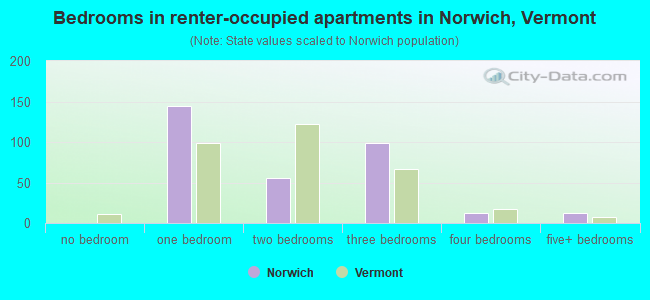
Median number of bedrooms in renter occupied houses
Mean number of bedrooms in renter occupied houses
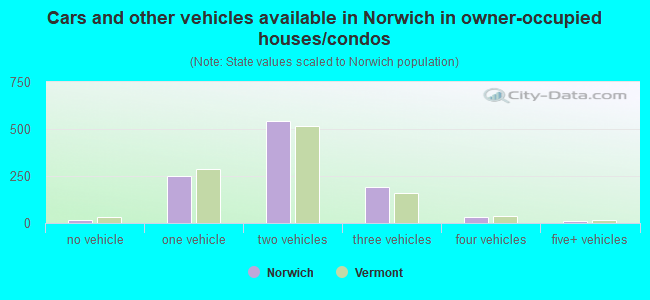
Median number of vehichles in owner occupied houses
Mean number of vehichles in owner occupied houses
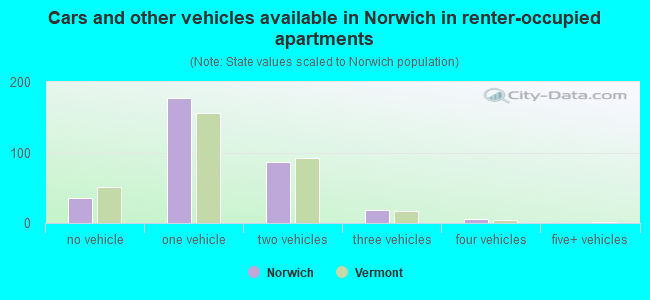
Median number of vehichles in renter occupied houses
Mean number of vehichles in renter occupied houses
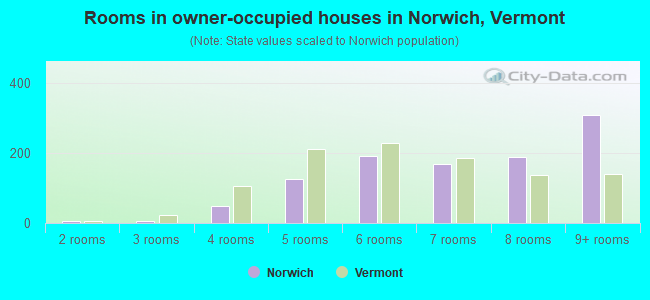
Rooms in owner-occupied houses - 1 room (%)
Rooms in owner-occupied houses - 2 rooms (%)
Rooms in owner-occupied houses - 3 rooms (%)
Rooms in owner-occupied houses - 4 rooms (%)
Rooms in owner-occupied houses - 5 rooms (%)
Rooms in owner-occupied houses - 6 rooms (%)
Rooms in owner-occupied houses - 7 rooms (%)
Rooms in owner-occupied houses - 8 rooms (%)
Rooms in owner-occupied houses - 9+ rooms (%)
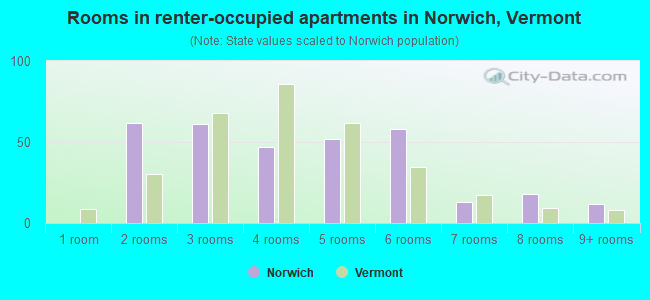
Rooms in renter-occupied houses - 1 room (%)
Rooms in renter-occupied houses - 2 rooms (%)
Rooms in renter-occupied houses - 3 rooms (%)
Rooms in renter-occupied houses - 4 rooms (%)
Rooms in renter-occupied houses - 5 rooms (%)
Rooms in renter-occupied houses - 6 rooms (%)
Rooms in renter-occupied houses - 7 rooms (%)
Rooms in renter-occupied houses - 8 rooms (%)
Rooms in renter-occupied houses - 9+ rooms (%)
Bedrooms in owner-occupied houses - no bedrooms (%)
Bedrooms in owner-occupied houses - 1 bedroom (%)
Bedrooms in owner-occupied houses - 2 bedrooms (%)
Bedrooms in owner-occupied houses - 3 bedrooms (%)
Bedrooms in owner-occupied houses - 4 bedrooms (%)
Bedrooms in owner-occupied houses - 5+ bedrooms (%)
Bedrooms in renter-occupied houses - no bedrooms (%)
Bedrooms in renter-occupied houses - 1 bedroom (%)
Bedrooms in renter-occupied houses - 2 bedrooms (%)
Bedrooms in renter-occupied houses - 3 bedrooms (%)
Bedrooms in renter-occupied houses - 4 bedrooms (%)
Bedrooms in renter-occupied houses - 5+ bedrooms (%)
Vehicles available in owner-occupied houses - no vehicle available (%)
Vehicles available in owner-occupied houses - 1 vehicle available(%)
Vehicles available in owner-occupied houses - 2 Vehicles available (%)
Vehicles available in owner-occupied houses - 3 Vehicles available (%)
Vehicles available in owner-occupied houses - 4 Vehicles available (%)
Vehicles available in owner-occupied houses - 5+ Vehicles available (%)
Vehicles available in renter-occupied houses - no vehicle available (%)
Vehicles available in renter-occupied houses - 1 vehicle available (%)
Vehicles available in renter-occupied houses - 2 Vehicles available (%)
Vehicles available in renter-occupied houses - 3 Vehicles available (%)
Vehicles available in renter-occupied houses - 4 Vehicles available (%)
Vehicles available in renter-occupied houses - 5+ Vehicles available (%)
Housing units in structures - 1, detached (%)
Housing units in structures - 1, attached (%)
Housing units in structures - 2 (%)
Housing units in structures - 3 or 4 (%)
Housing units in structures - 5 to 9 (%)
Housing units in structures - 10 to 19 (%)
Housing units in structures - 20 to 49 (%)
Housing units in structures - 50 or more (%)
Housing units in structures - Mobile home (%)
Housing units in structures - Boat, RV, van, etc. (%)
Housing units in structures - Owners - 1, detached (%)
Housing units in structures - Owners - 1, attached (%)
Housing units in structures - Owners - 2 (%)
Housing units in structures - Owners - 3 or 4 (%)
Housing units in structures - Owners - 5 to 9 (%)
Housing units in structures - Owners - 10 to 19 (%)
Housing units in structures - Owners - 20 to 49 (%)
Housing units in structures - Owners - 50 or more (%)
Housing units in structures - Owners - Mobile home (%)
Housing units in structures - Owners - Boat, RV, van, etc. (%)
Housing units in structures - Renters - 1, detached (%)
Housing units in structures - Renters - 1, attached (%)
Housing units in structures - Renters - 2 (%)
Housing units in structures - Renters - 3 or 4 (%)
Housing units in structures - Renters - 5 to 9 (%)
Housing units in structures - Renters - 10 to 19 (%)
Housing units in structures - Renters - 20 to 49 (%)
Housing units in structures - Renters - 50 or more (%)
Housing units in structures - Renters - Mobile home (%)
Housing units in structures - Renters - Boat, RV, van, etc. (%)
House/condo owner moved in on average (years ago)
Renter moved in on average (years ago)
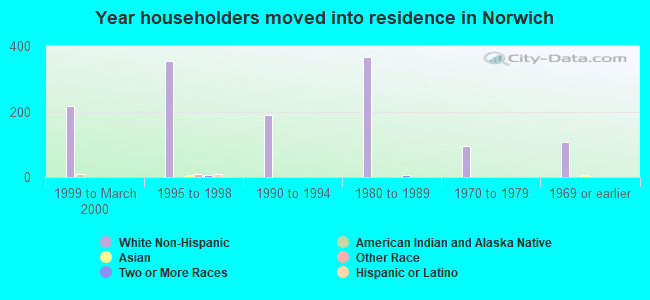
Year householder moved into unit - Moved in 1999 to March 2000 (%)
Year householder moved into unit - Moved in 1999 to March 2000 (%) - White
Year householder moved into unit - Moved in 1999 to March 2000 (%) - Black or African American
Year householder moved into unit - Moved in 1999 to March 2000 (%) - Asian
Year householder moved into unit - Moved in 1999 to March 2000 (%) - Hispanic or Latino
Year householder moved into unit - Moved in 1999 to March 2000 (%) - American Indian and Alaska Native
Year householder moved into unit - Moved in 1999 to March 2000 (%) - Multirace
Year householder moved into unit - Moved in 1999 to March 2000 (%) - Other Race
Year householder moved into unit - Moved in 1995 to 1998 (%)
Year householder moved into unit - Moved in 1995 to 1998 (%) - White
Year householder moved into unit - Moved in 1995 to 1998 (%) - Black or African American
Year householder moved into unit - Moved in 1995 to 1998 (%) - Asian
Year householder moved into unit - Moved in 1995 to 1998 (%) - Hispanic or Latino
Year householder moved into unit - Moved in 1995 to 1998 (%) - American Indian and Alaska Native
Year householder moved into unit - Moved in 1995 to 1998 (%) - Multirace
Year householder moved into unit - Moved in 1995 to 1998 (%) - Other Race
Year householder moved into unit - Moved in 1990 to 1994 (%)
Year householder moved into unit - Moved in 1990 to 1994 (%) - White
Year householder moved into unit - Moved in 1990 to 1994 (%) - Black or African American
Year householder moved into unit - Moved in 1990 to 1994 (%) - Asian
Year householder moved into unit - Moved in 1990 to 1994 (%) - Hispanic or Latino
Year householder moved into unit - Moved in 1990 to 1994 (%) - American Indian and Alaska Native
Year householder moved into unit - Moved in 1990 to 1994 (%) - Multirace
Year householder moved into unit - Moved in 1990 to 1994 (%) - Other Race
Year householder moved into unit - Moved in 1980 to 1989 (%)
Year householder moved into unit - Moved in 1980 to 1989 (%) - White
Year householder moved into unit - Moved in 1980 to 1989 (%) - Black or African American
Year householder moved into unit - Moved in 1980 to 1989 (%) - Asian
Year householder moved into unit - Moved in 1980 to 1989 (%) - Hispanic or Latino
Year householder moved into unit - Moved in 1980 to 1989 (%) - American Indian and Alaska Native
Year householder moved into unit - Moved in 1980 to 1989 (%) - Multirace
Year householder moved into unit - Moved in 1980 to 1989 (%) - Other Race
Year householder moved into unit - Moved in 1970 to 1979 (%)
Year householder moved into unit - Moved in 1970 to 1979 (%) - White
Year householder moved into unit - Moved in 1970 to 1979 (%) - Black or African American
Year householder moved into unit - Moved in 1970 to 1979 (%) - Asian
Year householder moved into unit - Moved in 1970 to 1979 (%) - Hispanic or Latino
Year householder moved into unit - Moved in 1970 to 1979 (%) - American Indian and Alaska Native
Year householder moved into unit - Moved in 1970 to 1979 (%) - Multirace
Year householder moved into unit - Moved in 1970 to 1979 (%) - Other Race
Year householder moved into unit - Moved in 1969 or earlier (%)
Year householder moved into unit - Moved in 1969 or earlier (%) - White
Year householder moved into unit - Moved in 1969 or earlier (%) - Black or African American
Year householder moved into unit - Moved in 1969 or earlier (%) - Asian
Year householder moved into unit - Moved in 1969 or earlier (%) - Hispanic or Latino
Year householder moved into unit - Moved in 1969 or earlier (%) - American Indian and Alaska Native
Year householder moved into unit - Moved in 1969 or earlier (%) - Multirace
Year householder moved into unit - Moved in 1969 or earlier (%) - Other Race
Housing units lacking complete plumbing facilities (%)
Housing units lacking complete kitchen facilities (%)
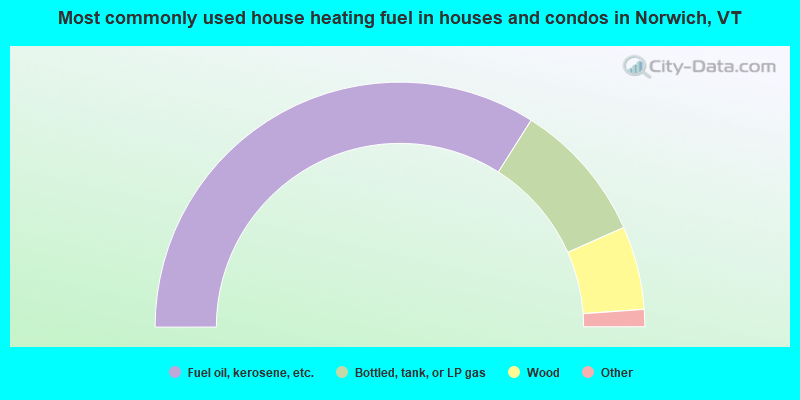
House heating fuel used in houses and condos - Utility gas (%)
House heating fuel used in houses and condos - Bottled, tank, or LP gas (%)
House heating fuel used in houses and condos - Electricity (%)
House heating fuel used in houses and condos - Fuel oil, kerosene, etc. (%)
House heating fuel used in houses and condos - Coal or coke (%)
House heating fuel used in houses and condos - Wood (%)
House heating fuel used in houses and condos - Solar energy (%)
House heating fuel used in houses and condos - Other fuel (%)
House heating fuel used in houses and condos - No fuel used (%)
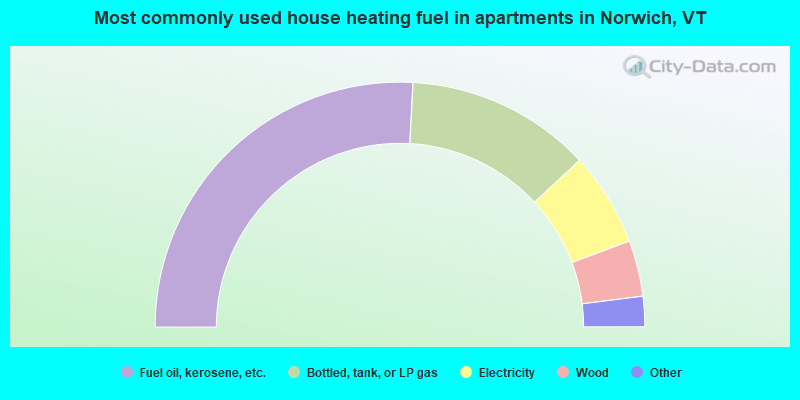
House heating fuel used in apartments - Utility gas (%)
House heating fuel used in apartments - Bottled, tank, or LP gas (%)
House heating fuel used in apartments - Electricity (%)
House heating fuel used in apartments - Fuel oil, kerosene, etc. (%)
House heating fuel used in apartments - Coal or coke (%)
House heating fuel used in apartments - Wood (%)
House heating fuel used in apartments - Solar energy (%)
House heating fuel used in apartments - Other fuel (%)
House heating fuel used in apartments - No fuel used (%)
Latest news about housing in Norwich, VT collected exclusively by city-data.com from local newspapers, TV, and radio stations
Household type by relationship:
Households: 55,772
In family households: 44,133 (10,625 male householders , 4,795 female householders )
12,152 spouses , 13,426 children (12,313 natural , 493 adopted , 620 stepchildren ), 648 grandchildren , 228 brothers or sisters , 332 parents , foster children , 269 other relatives , 1,434 non-relatives In nonfamily households: 11,639 (4,242 male householders (3,179 living alone )), 5,091 female householders (4,237 living alone )), 2,306 nonrelatives In group quarters: 898 (784 institutionalized population)
9,497 married couples with children. single-parent households (795 men , 2,272 women ).
91.3% of residents of Norwich speak English at home. of residents speak Spanish at home (39% speak English very well , 39% speak English well , 22% speak English not well ).of residents speak other Indo-European language at home (98% speak English very well , 2% speak English not well ).of residents speak Asian or Pacific Island language at home (50% speak English well , 50% speak English not well ).of residents speak other language at home (59% speak English not well , 41% don't speak English at all ).
Foreign born population: 247 (6.5%)of them are naturalized citizens )
Median number of rooms in houses and condos:
Median number of rooms in apartments
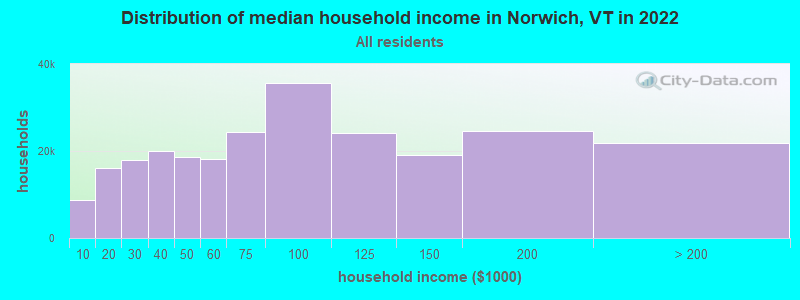
Norwich, VT household income distribution 8,672 Less than $10,00016,029 $10,000 to $19,99917,963 $20,000 to $29,99919,861 $30,000 to $39,99918,633 $40,000 to $49,99918,060 $50,000 to $59,99924,429 $60,000 to $74,99935,562 $75,000 to $99,99924,131 $100,000 to $124,99919,083 $125,000 to $149,99924,677 $150,000 to $199,99921,758 $200,000 or more
Percentage of workers working in this county: 39.8%Number of people working at home: 318 (16.8% of all workers )
Travel time to work (commute)
Less than 5 minutes: 1155 to 9 minutes: 17210 to 14 minutes: 31715 to 19 minutes: 33720 to 24 minutes: 33825 to 29 minutes: 9430 to 34 minutes: 8635 to 39 minutes: 040 to 44 minutes: 3045 to 59 minutes: 3260 to 89 minutes: 1790 or more minutes: 38
Means of transportation to work:
Drove a car alone: 1,236 (70.7%)Carpooled: 247 (14.1%)Subway or elevated : 8 (0.5%)Taxi: 16 (0.9%)Bicycle: 11 (0.6%)Walked: 58 (3.3%)Worked at home: 171 (9.8%)
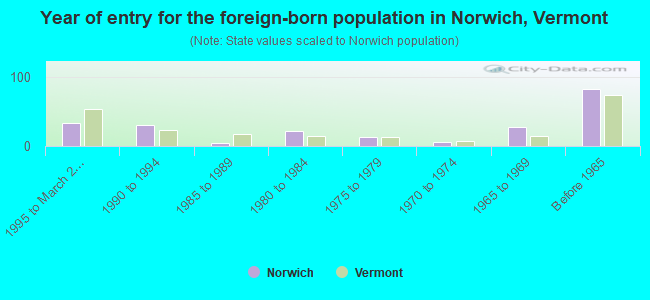
Year of entry for the foreign-born population in Norwich, Vermont
33 1995 to March 2000 30 1990 to 1994 5 1985 to 1989 21 1980 to 1984 13 1975 to 1979 6 1970 to 1974 27 1965 to 1969 82 Before 1965
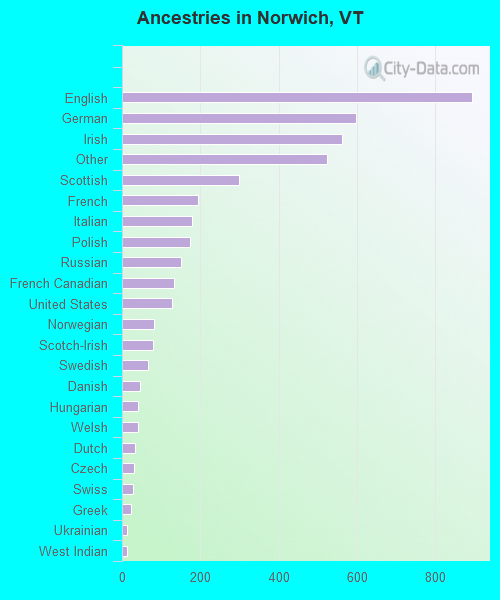
First ancestries reported:
English: 893 (20.6%)
German: 598 (13.8%)
Irish: 562 (13.0%)
Other: 523 (12.1%)
Scottish: 299 (6.9%)
French: 195 (4.5%)
Italian: 178 (4.1%)
Polish: 173 (4.0%)
Russian: 150 (3.5%)
French Canadian: 133 (3.1%)
United States: 127 (2.9%)
Norwegian: 83 (1.9%)
Scotch-Irish: 79 (1.8%)
Swedish: 67 (1.5%)
Danish: 47 (1.1%)
Hungarian: 42 (1.0%)
Welsh: 40 (0.9%)
Dutch: 32 (0.7%)
Czech: 30 (0.7%)
Swiss: 27 (0.6%)
Greek: 22 (0.5%)
Ukrainian: 12 (0.3%)
West Indian: 12 (0.3%)
Slovak: 6 (0.1%)
Subsaharan African: 5 (0.1%) Most common places of birth for foreign-born residents (%): United Kingdom Norwich:
12.9% (28)Vermont:
7.5% (1,744)
Other Eastern Africa Norwich:
12.4% (27)Vermont:
0.5% (106)
France Norwich:
9.2% (20)Vermont:
1.7% (400)
Russia Norwich:
8.8% (19)Vermont:
1.1% (263)
Poland Norwich:
8.3% (18)Vermont:
1.6% (381)
Germany Norwich:
7.8% (17)Vermont:
7.2% (1,669)
Canada Norwich:
7.8% (17)Vermont:
34.0% (7,912)
Other Western Europe Norwich:
5.5% (12)Vermont:
1.2% (273)
Greece Norwich:
4.6% (10)Vermont:
0.6% (144)
Argentina Norwich:
4.1% (9)Vermont:
0.6% (131)
Austria Norwich:
3.2% (7)Vermont:
0.8% (191)
Netherlands Norwich:
2.8% (6)Vermont:
1.4% (318)
China, excluding Hong Kong and Taiwan Norwich:
2.8% (6)Vermont:
2.9% (673)
Japan Norwich:
2.8% (6)Vermont:
1.4% (335)
Israel Norwich:
2.3% (5)Vermont:
0.3% (77)
Ethiopia Norwich:
2.3% (5)Vermont:
0.1% (18)
Other South America Norwich:
2.3% (5)Vermont:
0.1% (25)
Place of birth for U.S.-born residents:
This state: 311Other state: 2,951Northeast: 2,129Midwest: 390South: 256West: 176 62% of Norwich residents lived in the same house 5 years ago.
Out of people who lived in different houses, 34% lived in this county.
Out of people who lived in different counties, 12% lived in Vermont.
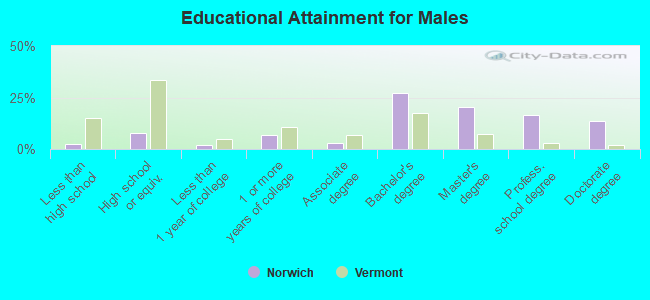
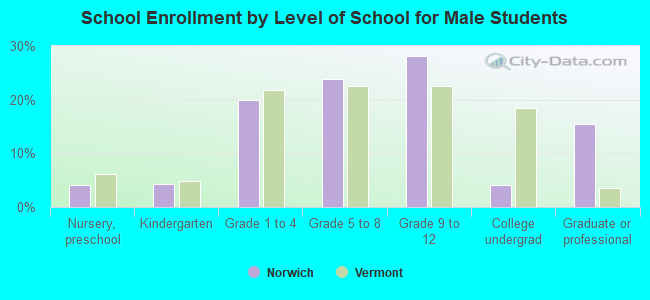
Education attainment for males 25 years and older:
No schooling: 0Nursery to 4th grade: 05th and 6th grade: 07th and 8th grade: 09th grade: 1610th grade: 011th grade: 812th grade, no diploma: 0High school graduate (or equivalency): 83Less than 1 year of college: 22Some college more than 1 year, no degree: 76Associate degree: 33Bachelor's degree: 296Master's degree: 223Professional school degree: 177Doctorate degree: 149
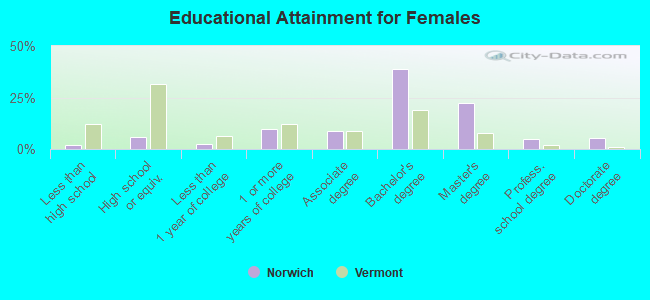
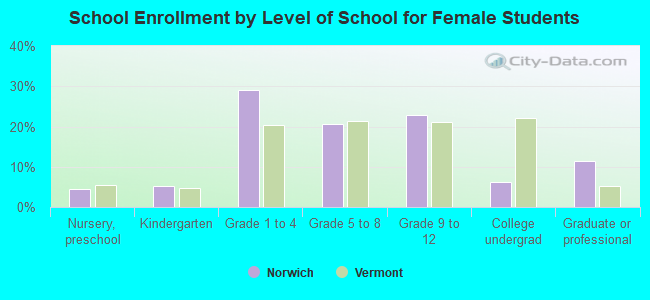
Education attainment for females 25 years and older:
No schooling: 0Nursery to 4th grade: 05th and 6th grade: 07th and 8th grade: 79th grade: 710th grade: 011th grade: 1112th grade, no diploma: 0High school graduate (or equivalency): 73Less than 1 year of college: 28Some college more than 1 year, no degree: 120Associate degree: 112Bachelor's degree: 484Master's degree: 281Professional school degree: 62Doctorate degree: 65
Housing units in structures:
One, detached: 1,290One, attached: 11Two: 943 or 4: 265 to 9: 1810 to 19: 1820 to 49: 6Mobile homes: 36Boats, RVs, vans, etc.: 6Median worth of mobile homes: $80,249
Housing units lacking complete plumbing facilities: 2.6%Housing units lacking complete kitchen facilities: 0.8%Private vs. public school enrollment:
Students in private schools in grades 1 to 8 (elementary and middle school): 36 Students in private schools in grades 9 to 12 (high school): 37 Students in private undergraduate colleges: 45