Oak Ridge, FL (Florida) Houses and Residents
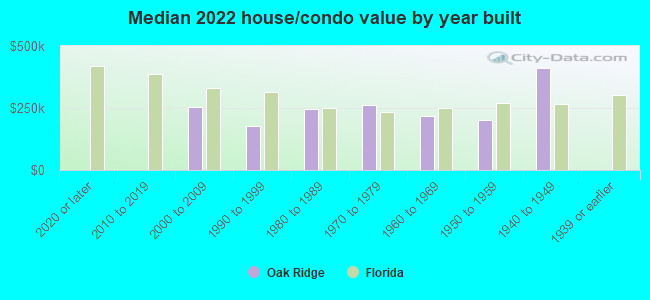
Estimated median house or condo value in 2022: $223,241 (it was $79,100 in 2000 )
Oak Ridge:
$223,241Florida:
$354,100
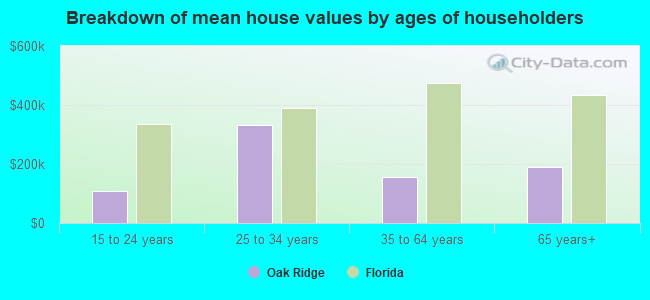
Lower value quartile - upper value quartile: $174,456 - $296,814Mean price in 2022: Detached houses: $228,765 Here:
$228,765State:
$500,941
In 3-to-4-unit structures: $156,373 Here:
$156,373State:
$309,944
In 5-or-more-unit structures: $1,856,678 Here:
$1,856,678State:
$447,145
Mobile homes: $30,936 Here:
$30,936State:
$113,202
Total population: 22,685 (Urban population: 22,407, Rural population: 0)
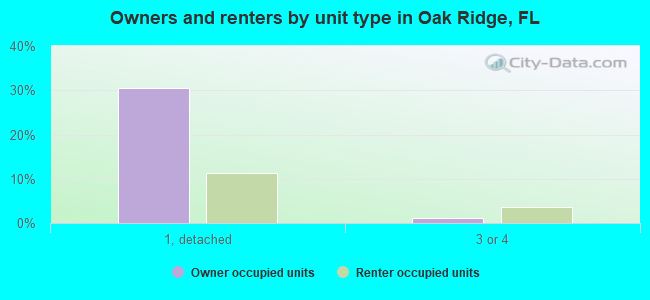
Houses: 9,180 (7,320 occupied: 2,752 owner occupied, 5,062 renter occupied )
% of renters here:
65%State:
33%
Housing density: 2,206 houses/condos per square mile
Median price asked for vacant for-sale houses and condos in 2022: $191,346.
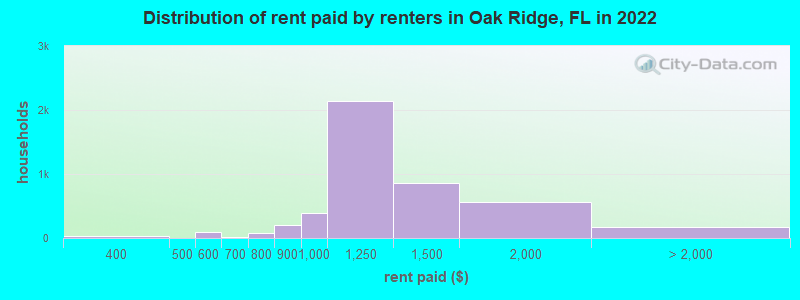
Median contract rent in 2022: $1,228 (lower quartile is $1,070, upper quartile is $1,406)
Median rent asked for vacant for-rent units in 2022: $976
Median gross rent in Oak Ridge, FL in 2022: $1,373
Housing units in Oak Ridge with a mortgage: 1,392 (44 second mortgage, 0 home equity loan, 31 both second mortgage and home equity loan )Houses without a mortgage: 0
Median household income for houses/condos with a mortgage: $55,650
Median household income for apartments without a mortgage: $48,481
Median monthly housing costs: $1,262
Data:
Median house or condo value ($)
Median house or condo value ($ change since 2000)
Median house or condo value ($) - White
Median house or condo value ($) - Black or African American
Median house or condo value ($) - Asian
Median house or condo value ($) - Hispanic or Latino
Median house or condo value ($) - American Indian and Alaska Native
Median house or condo value ($) - Multirace
Median house or condo value ($) - Other Race
Median price asked for mobile homes ($)
Household density (households per square mile)
Mean house or condo value by units in structure - 1, detached ($)
Mean house or condo value by units in structure - 1, attached ($)
Mean house or condo value by units in structure - 2 ($)
Mean house or condo value by units in structure by units in structure - 3 or 4 ($)
Mean house or condo value by units in structure - 5 or more ($)
Mean house or condo value by units in structure - Boat, RV, van, etc. ($)
Mean house or condo value by units in structure - Mobile home ($)
Median contract rent ($)
Median contract rent - Lower quartile ($)
Median contract rent - Upper quartile ($)
Median gross rent ($)
Urban houses (%)
Rural houses (%)
Houses occupied (%)
Houses occupied (% change since 2000)
Houses owner occupied (%)
Houses owner occupied (% change since 2000)
Houses renter occupied (%)
Houses renter occupied (% change since 2000)
Vacant housing units - For rent (%)
Vacant housing units - For rent (% change since 2000)
Vacant housing units - For sale only (%)
Vacant housing units - For sale only (% change since 2000)
Vacant housing units - Rented or sold, not occupied (%)
Vacant housing units - Rented or sold, not occupied (% change since 2000)
Vacant housing units - For seasonal, recreational, or occasional use (%)
Vacant housing units - For seasonal, recreational, or occasional use (% change since 2000)
Vacant housing units - For migrant workers (%)
Vacant housing units - For migrant workers (% change since 2000)
Vacant housing units - Other vacant (%)
Vacant housing units - Other vacant (% change since 2000)
Median monthly housing costs ($)
Median household income for houses/condos with a mortgage ($)
Median household income for houses/condos without a mortgage ($)
Median household income ($)
Median household income ($) - White
Median household income ($) - Black or African American
Median household income ($) - Asian
Median household income ($) - Hispanic or Latino
Median household income ($) - American Indian and Alaska Native
Median household income ($) - Multirace
Median household income ($) - Other Race
Mortgage status - with mortgage (%)
Mortgage status - with second mortgage (%)
Mortgage status - with home equity loan (%)
Mortgage status - with both second mortgage and home equity loan (%)
Mortgage status - without a mortgage (%)
Median year house/condo built
Median year apartment built
Household type by relationship - Male householder living alone (%)
Household type by relationship - Male householder not living alone (%)
Household type by relationship - Female householder living alone (%)
Household type by relationship - Female householder not living alone (%)
Household type by relationship - Opposite-Sex spouse (%)
Household type by relationship - Same-Sex spouse (%)
Household type by relationship - Opposite-Sex unmarried partner (%)
Household type by relationship - Same-Sex unmarried partner (%)
Household type by relationship - In group quarters (%)
Size of family households - 2-person household (%)
Size of family households - 3-person household (%)
Size of family households - 4-person household (%)
Size of family households - 5-person household (%)
Size of family households - 6-person household (%)
Size of family households - 7-or-more-person household (%)
Size of nonfamily households - 1-person household (%)
Size of nonfamily households - 2-person household (%)
Size of nonfamily households - 3-person household (%)
Size of nonfamily households - 4-person household (%)
Size of nonfamily households - 5-person household (%)
Size of nonfamily households - 6-person household (%)
Size of nonfamily households - 7-or-moreperson household (%)
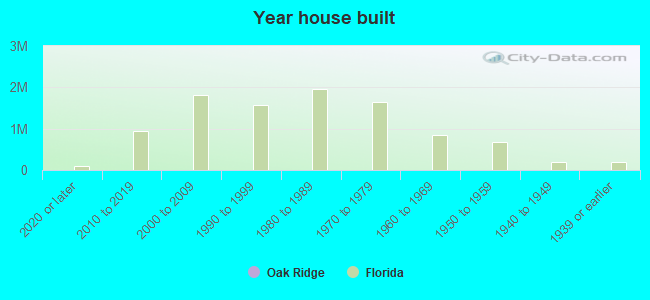
Year house built - Built 2010 or later (%)
Year house built - Built 2000 to 2009 (%)
Year house built - Built 1990 to 1999 (%)
Year house built - Built 1980 to 1989 (%)
Year house built - Built 1970 to 1979 (%)
Year house built - Built 1960 to 1969 (%)
Year house built - Built 1950 to 1959 (%)
Year house built - Built 1940 to 1949 (%)
Year house built - Built 1939 or earlier (%)
Median number of rooms in houses and condos
Median number of rooms in apartments
Median number of bedrooms in owner occupied houses
Mean number of bedrooms in owner occupied houses
Median number of bedrooms in renter occupied houses
Mean number of bedrooms in renter occupied houses
Median number of vehichles in owner occupied houses
Mean number of vehichles in owner occupied houses
Median number of vehichles in renter occupied houses
Mean number of vehichles in renter occupied houses
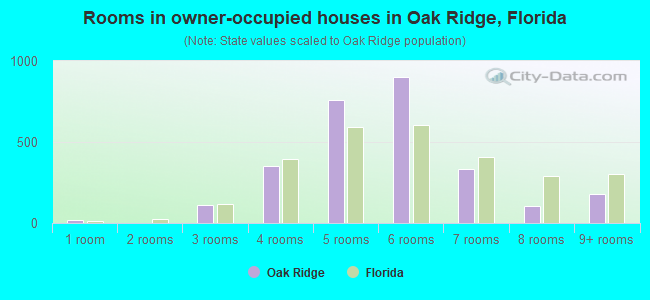
Rooms in owner-occupied houses - 1 room (%)
Rooms in owner-occupied houses - 2 rooms (%)
Rooms in owner-occupied houses - 3 rooms (%)
Rooms in owner-occupied houses - 4 rooms (%)
Rooms in owner-occupied houses - 5 rooms (%)
Rooms in owner-occupied houses - 6 rooms (%)
Rooms in owner-occupied houses - 7 rooms (%)
Rooms in owner-occupied houses - 8 rooms (%)
Rooms in owner-occupied houses - 9+ rooms (%)
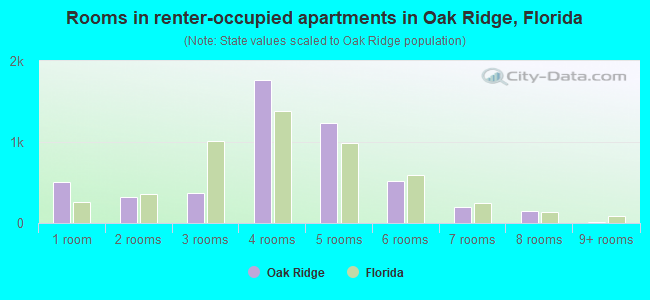
Rooms in renter-occupied houses - 1 room (%)
Rooms in renter-occupied houses - 2 rooms (%)
Rooms in renter-occupied houses - 3 rooms (%)
Rooms in renter-occupied houses - 4 rooms (%)
Rooms in renter-occupied houses - 5 rooms (%)
Rooms in renter-occupied houses - 6 rooms (%)
Rooms in renter-occupied houses - 7 rooms (%)
Rooms in renter-occupied houses - 8 rooms (%)
Rooms in renter-occupied houses - 9+ rooms (%)
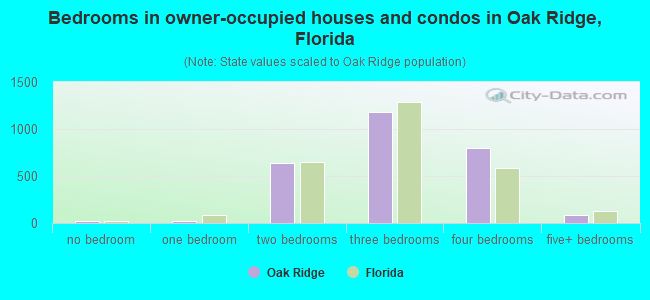
Bedrooms in owner-occupied houses - no bedrooms (%)
Bedrooms in owner-occupied houses - 1 bedroom (%)
Bedrooms in owner-occupied houses - 2 bedrooms (%)
Bedrooms in owner-occupied houses - 3 bedrooms (%)
Bedrooms in owner-occupied houses - 4 bedrooms (%)
Bedrooms in owner-occupied houses - 5+ bedrooms (%)
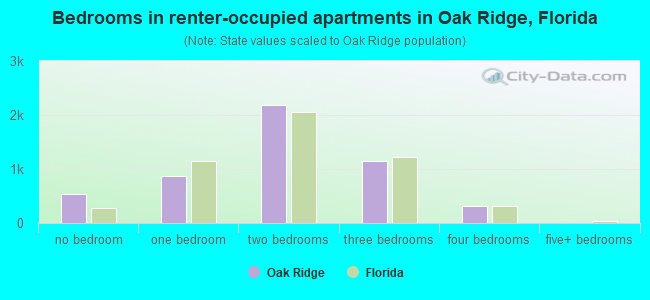
Bedrooms in renter-occupied houses - no bedrooms (%)
Bedrooms in renter-occupied houses - 1 bedroom (%)
Bedrooms in renter-occupied houses - 2 bedrooms (%)
Bedrooms in renter-occupied houses - 3 bedrooms (%)
Bedrooms in renter-occupied houses - 4 bedrooms (%)
Bedrooms in renter-occupied houses - 5+ bedrooms (%)
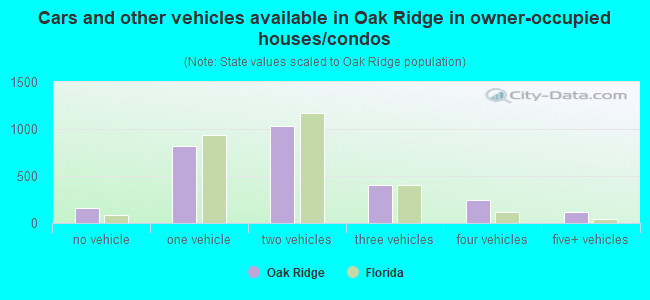
Vehicles available in owner-occupied houses - no vehicle available (%)
Vehicles available in owner-occupied houses - 1 vehicle available(%)
Vehicles available in owner-occupied houses - 2 Vehicles available (%)
Vehicles available in owner-occupied houses - 3 Vehicles available (%)
Vehicles available in owner-occupied houses - 4 Vehicles available (%)
Vehicles available in owner-occupied houses - 5+ Vehicles available (%)
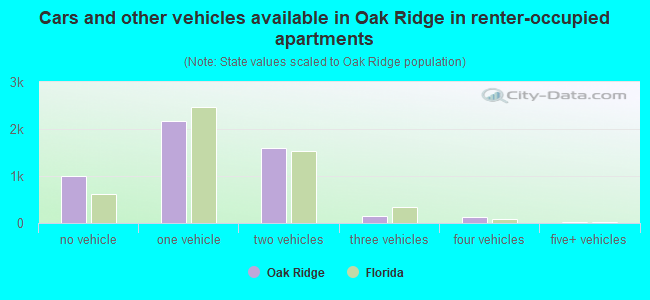
Vehicles available in renter-occupied houses - no vehicle available (%)
Vehicles available in renter-occupied houses - 1 vehicle available (%)
Vehicles available in renter-occupied houses - 2 Vehicles available (%)
Vehicles available in renter-occupied houses - 3 Vehicles available (%)
Vehicles available in renter-occupied houses - 4 Vehicles available (%)
Vehicles available in renter-occupied houses - 5+ Vehicles available (%)
Housing units in structures - 1, detached (%)
Housing units in structures - 1, attached (%)
Housing units in structures - 2 (%)
Housing units in structures - 3 or 4 (%)
Housing units in structures - 5 to 9 (%)
Housing units in structures - 10 to 19 (%)
Housing units in structures - 20 to 49 (%)
Housing units in structures - 50 or more (%)
Housing units in structures - Mobile home (%)
Housing units in structures - Boat, RV, van, etc. (%)
Housing units in structures - Owners - 1, detached (%)
Housing units in structures - Owners - 1, attached (%)
Housing units in structures - Owners - 2 (%)
Housing units in structures - Owners - 3 or 4 (%)
Housing units in structures - Owners - 5 to 9 (%)
Housing units in structures - Owners - 10 to 19 (%)
Housing units in structures - Owners - 20 to 49 (%)
Housing units in structures - Owners - 50 or more (%)
Housing units in structures - Owners - Mobile home (%)
Housing units in structures - Owners - Boat, RV, van, etc. (%)
Housing units in structures - Renters - 1, detached (%)
Housing units in structures - Renters - 1, attached (%)
Housing units in structures - Renters - 2 (%)
Housing units in structures - Renters - 3 or 4 (%)
Housing units in structures - Renters - 5 to 9 (%)
Housing units in structures - Renters - 10 to 19 (%)
Housing units in structures - Renters - 20 to 49 (%)
Housing units in structures - Renters - 50 or more (%)
Housing units in structures - Renters - Mobile home (%)
Housing units in structures - Renters - Boat, RV, van, etc. (%)
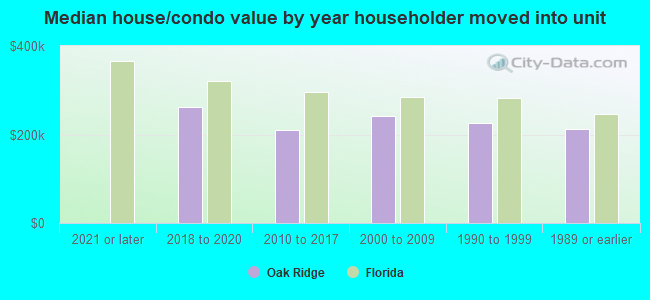
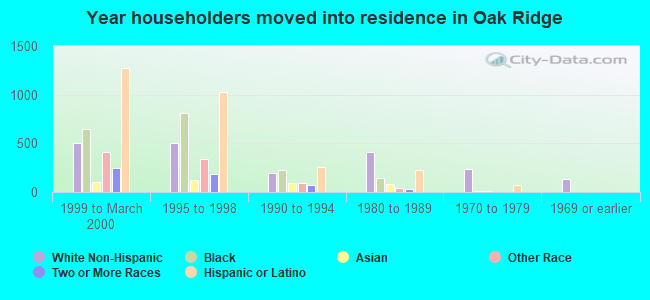
House/condo owner moved in on average (years ago)
Renter moved in on average (years ago)
Year householder moved into unit - Moved in 1999 to March 2000 (%)
Year householder moved into unit - Moved in 1999 to March 2000 (%) - White
Year householder moved into unit - Moved in 1999 to March 2000 (%) - Black or African American
Year householder moved into unit - Moved in 1999 to March 2000 (%) - Asian
Year householder moved into unit - Moved in 1999 to March 2000 (%) - Hispanic or Latino
Year householder moved into unit - Moved in 1999 to March 2000 (%) - American Indian and Alaska Native
Year householder moved into unit - Moved in 1999 to March 2000 (%) - Multirace
Year householder moved into unit - Moved in 1999 to March 2000 (%) - Other Race
Year householder moved into unit - Moved in 1995 to 1998 (%)
Year householder moved into unit - Moved in 1995 to 1998 (%) - White
Year householder moved into unit - Moved in 1995 to 1998 (%) - Black or African American
Year householder moved into unit - Moved in 1995 to 1998 (%) - Asian
Year householder moved into unit - Moved in 1995 to 1998 (%) - Hispanic or Latino
Year householder moved into unit - Moved in 1995 to 1998 (%) - American Indian and Alaska Native
Year householder moved into unit - Moved in 1995 to 1998 (%) - Multirace
Year householder moved into unit - Moved in 1995 to 1998 (%) - Other Race
Year householder moved into unit - Moved in 1990 to 1994 (%)
Year householder moved into unit - Moved in 1990 to 1994 (%) - White
Year householder moved into unit - Moved in 1990 to 1994 (%) - Black or African American
Year householder moved into unit - Moved in 1990 to 1994 (%) - Asian
Year householder moved into unit - Moved in 1990 to 1994 (%) - Hispanic or Latino
Year householder moved into unit - Moved in 1990 to 1994 (%) - American Indian and Alaska Native
Year householder moved into unit - Moved in 1990 to 1994 (%) - Multirace
Year householder moved into unit - Moved in 1990 to 1994 (%) - Other Race
Year householder moved into unit - Moved in 1980 to 1989 (%)
Year householder moved into unit - Moved in 1980 to 1989 (%) - White
Year householder moved into unit - Moved in 1980 to 1989 (%) - Black or African American
Year householder moved into unit - Moved in 1980 to 1989 (%) - Asian
Year householder moved into unit - Moved in 1980 to 1989 (%) - Hispanic or Latino
Year householder moved into unit - Moved in 1980 to 1989 (%) - American Indian and Alaska Native
Year householder moved into unit - Moved in 1980 to 1989 (%) - Multirace
Year householder moved into unit - Moved in 1980 to 1989 (%) - Other Race
Year householder moved into unit - Moved in 1970 to 1979 (%)
Year householder moved into unit - Moved in 1970 to 1979 (%) - White
Year householder moved into unit - Moved in 1970 to 1979 (%) - Black or African American
Year householder moved into unit - Moved in 1970 to 1979 (%) - Asian
Year householder moved into unit - Moved in 1970 to 1979 (%) - Hispanic or Latino
Year householder moved into unit - Moved in 1970 to 1979 (%) - American Indian and Alaska Native
Year householder moved into unit - Moved in 1970 to 1979 (%) - Multirace
Year householder moved into unit - Moved in 1970 to 1979 (%) - Other Race
Year householder moved into unit - Moved in 1969 or earlier (%)
Year householder moved into unit - Moved in 1969 or earlier (%) - White
Year householder moved into unit - Moved in 1969 or earlier (%) - Black or African American
Year householder moved into unit - Moved in 1969 or earlier (%) - Asian
Year householder moved into unit - Moved in 1969 or earlier (%) - Hispanic or Latino
Year householder moved into unit - Moved in 1969 or earlier (%) - American Indian and Alaska Native
Year householder moved into unit - Moved in 1969 or earlier (%) - Multirace
Year householder moved into unit - Moved in 1969 or earlier (%) - Other Race
Housing units lacking complete plumbing facilities (%)
Housing units lacking complete kitchen facilities (%)
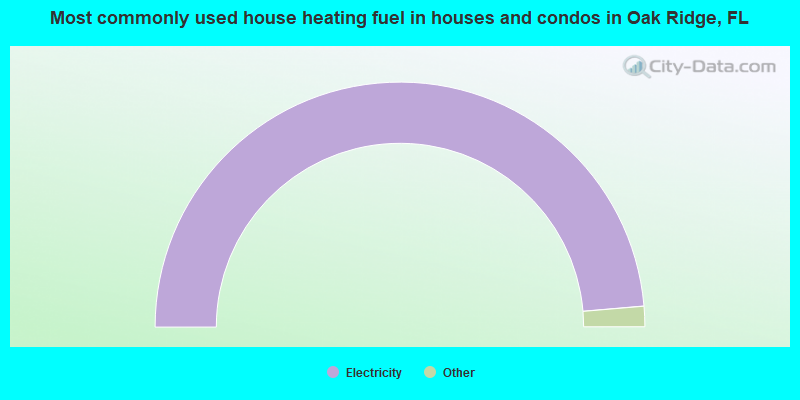
House heating fuel used in houses and condos - Utility gas (%)
House heating fuel used in houses and condos - Bottled, tank, or LP gas (%)
House heating fuel used in houses and condos - Electricity (%)
House heating fuel used in houses and condos - Fuel oil, kerosene, etc. (%)
House heating fuel used in houses and condos - Coal or coke (%)
House heating fuel used in houses and condos - Wood (%)
House heating fuel used in houses and condos - Solar energy (%)
House heating fuel used in houses and condos - Other fuel (%)
House heating fuel used in houses and condos - No fuel used (%)
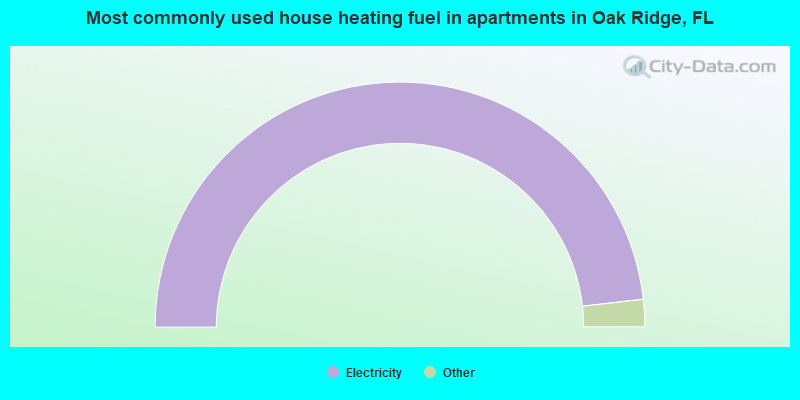
House heating fuel used in apartments - Utility gas (%)
House heating fuel used in apartments - Bottled, tank, or LP gas (%)
House heating fuel used in apartments - Electricity (%)
House heating fuel used in apartments - Fuel oil, kerosene, etc. (%)
House heating fuel used in apartments - Coal or coke (%)
House heating fuel used in apartments - Wood (%)
House heating fuel used in apartments - Solar energy (%)
House heating fuel used in apartments - Other fuel (%)
House heating fuel used in apartments - No fuel used (%)
Beertopia, Parrish Heritage Days, Art in the Park, Gamble Plantation Open House & more, all this weekend! (2 replies)Italian Feast & Carnival, Reggae, Antiques, Home & Craft shows, Jazz & more, all this weekend! (0 replies)Quiet town between Orlando and Tampa (31 replies)Groveland area apartments (3 replies)Red Hot Blues Festival, Block Party, Gamble Plantation, Ballet, Baseball & more, all this weekend! (1 reply)Apartment hunting trip - Metrowest/Hiawassee apartments (6 replies)
Median year house/condo built: 1974Median year apartment built: 1985Household type by relationship:
Households: 24,910
Male householders: 3,231 (791 living alone ), Female householders: 3,929 (920 living alone )2,227 spouses (2,197 opposite-sex spouses ), 1,041 unmarried partners , (1,022 opposite-sex unmarried partners ), 8,700 children (8,368 natural , 152 adopted , 179 stepchildren ), 1,218 grandchildren , 371 brothers or sisters , 586 parents , 146 foster children , 1,337 other relatives , 2,119 non-relatives
Size of family households: 1,412 2-persons , 920 3-persons , 1,128 4-persons , 947 5-persons , 197 6-persons , 311 7-or-more-persons .
Size of nonfamily households: 1,890 1-person , 557 2-persons , 224 3-persons , 227 4-persons .
2,079 married couples with children. single-parent households (649 men , 1,641 women ).
42.9% of residents of Oak Ridge speak English at home. of residents speak Spanish at home (41% speak English very well , 19% speak English well , 21% speak English not well , 18% don't speak English at all ).of residents speak other Indo-European language at home (43% speak English very well , 29% speak English well , 18% speak English not well , 10% don't speak English at all ).of residents speak Asian or Pacific Island language at home (47% speak English very well , 22% speak English well , 27% speak English not well , 4% don't speak English at all ).of residents speak other language at home (70% speak English very well , 30% speak English well ).
Foreign born population: 9,463 (38.0%)of them are naturalized citizens )
Median number of rooms in houses and condos:
Median number of rooms in apartments
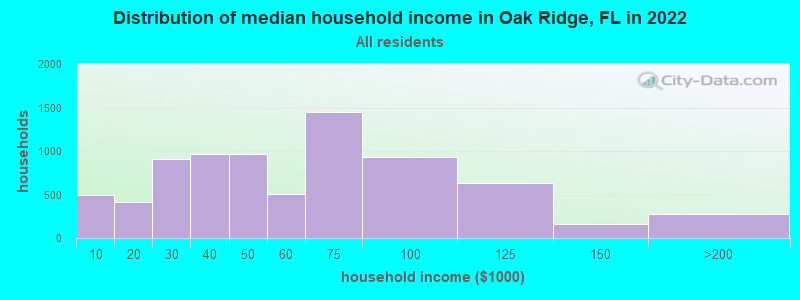
Oak Ridge, FL household income distribution 489 Less than $10,000417 $10,000 to $19,999903 $20,000 to $29,999970 $30,000 to $39,999966 $40,000 to $49,999504 $50,000 to $59,9991,454 $60,000 to $74,999927 $75,000 to $99,999630 $100,000 to $124,999159 $125,000 to $149,999254 $150,000 to $199,99921 $200,000 or more
Home value of owner - occupied houses in 2022 in Oak Ridge, FL 44 Less than $10,00045 $10,000 to $14,9996 $15,000 to $19,99918 $20,000 to $24,99935 $25,000 to $29,99932 $30,000 to $34,99912 $60,000 to $69,99964 $80,000 to $89,99924 $90,000 to $99,999204 $100,000 to $124,99928 $125,000 to $149,999275 $150,000 to $174,999294 $175,000 to $199,999371 $200,000 to $249,999204 $250,000 to $299,999339 $300,000 to $399,99914 $400,000 to $499,99930 $500,000 to $749,99911 $750,000 to $999,99936 $2,000,000 or moreRent paid by renters in 2022 in Oak Ridge, FL 15 $200 to $24927 $300 to $34953 $500 to $54944 $550 to $59918 $650 to $69942 $700 to $74928 $750 to $799207 $800 to $899397 $900 to $9992,142 $1,000 to $1,249855 $1,250 to $1,499563 $1,500 to $1,99933 $2,000 to $2,499146 No cash rent
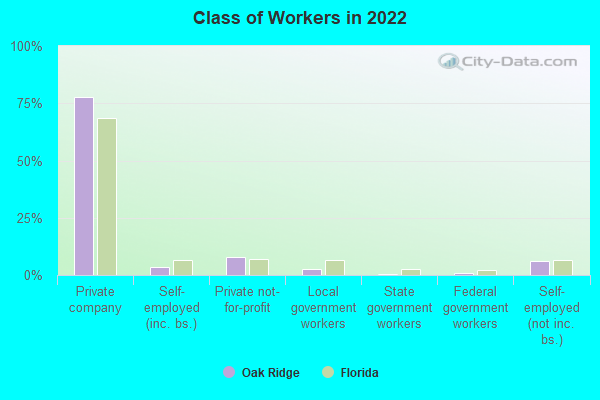
Percentage of workers working in this county: 89.4%Number of people working at home: 1,035 (8.1% of all workers )
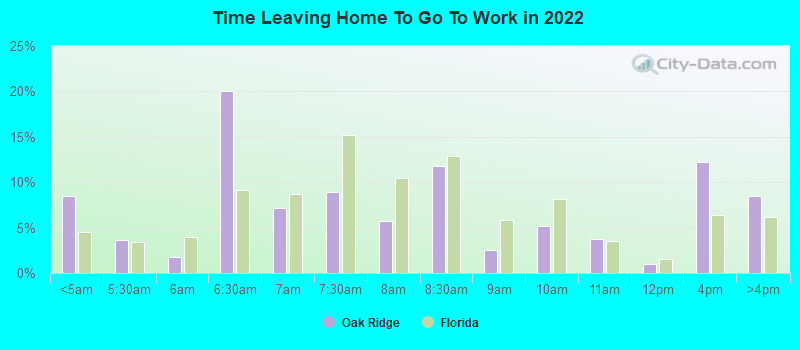
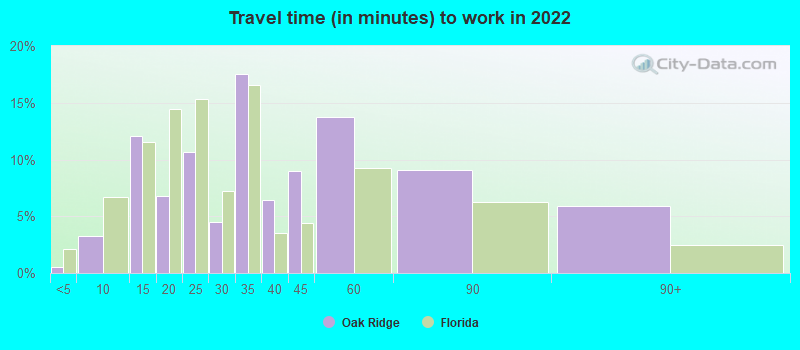
Travel time to work (commute)
Less than 5 minutes: 1055 to 9 minutes: 28010 to 14 minutes: 1,44115 to 19 minutes: 2,20520 to 24 minutes: 1,81925 to 29 minutes: 1,13830 to 34 minutes: 2,60335 to 39 minutes: 18040 to 44 minutes: 22945 to 59 minutes: 52560 to 89 minutes: 54190 or more minutes: 323
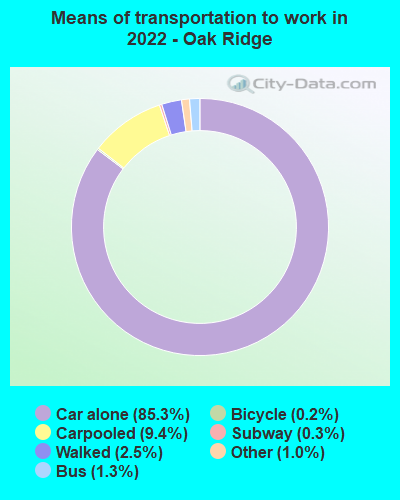
Means of transportation to work:
Drove a car alone: 6,160 (72.9%)Carpooled: 722 (8.5%)Bus : 101 (1.2%)Long-distance train or commuter rail : 31 (0.4%)Taxi: 79 (0.9%)Bicycle: 11 (0.1%)Walked: 235 (2.8%)Worked at home: 1,035 (12.3%)
Unemployment by race in 2022
Unemployment rate for White non-Hispanic residents 3.9% Males1.9% FemalesUnemployment rate for Black residents 4.7% Males2.0% FemalesUnemployment rate for other race residents 0.8% Males5.9% FemalesUnemployment rate for two or more race residents 5.0% Males13.1% FemalesUnemployment rate for Hispanic or Latino residents 0.6% Males11.7% Females
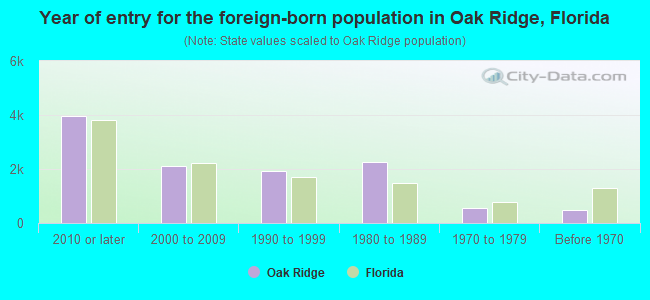
Year of entry for the foreign-born population in Oak Ridge, Florida
3,972 2010 or later 2,110 2000 to 2009 1,944 1990 to 1999 2,243 1980 to 1989 546 1970 to 1979 490 Before 1970
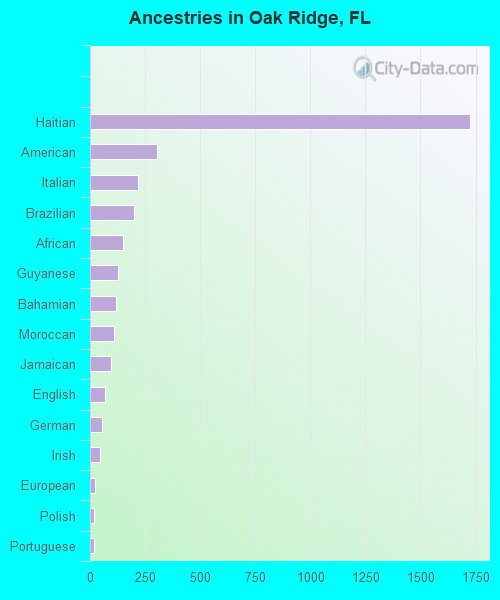
First ancestries reported:
Haitian: 1,725 (12.2%)
American: 303 (2.1%)
Italian: 220 (1.6%)
Brazilian: 198 (1.4%)
African: 152 (1.1%)
Guyanese: 125 (0.9%)
Bahamian: 118 (0.8%)
Moroccan: 111 (0.8%)
Jamaican: 94 (0.7%)
English: 67 (0.5%)
German: 55 (0.4%)
Irish: 45 (0.3%)
European: 22 (0.2%)
Polish: 18 (0.1%)
Portuguese: 17 (0.1%)
British West Indian: 12 (0.08%)
Hungarian: 10 (0.07%) Most common places of birth for foreign-born residents (%): Haiti Oak Ridge:
17.7% (1,652)Florida:
7.5% (342,375)
Honduras Oak Ridge:
11.0% (1,025)Florida:
2.3% (107,160)
Dominican Republic Oak Ridge:
8.5% (792)Florida:
3.0% (137,727)
El Salvador Oak Ridge:
8.5% (790)Florida:
1.1% (49,838)
Guatemala Oak Ridge:
8.2% (762)Florida:
2.1% (97,632)
Colombia Oak Ridge:
7.9% (732)Florida:
6.5% (298,669)
Mexico Oak Ridge:
6.6% (620)Florida:
5.6% (257,152)
Cuba Oak Ridge:
5.5% (514)Florida:
22.0% (1,006,576)
Vietnam Oak Ridge:
4.4% (406)Florida:
1.3% (60,604)
Venezuela Oak Ridge:
3.9% (364)Florida:
5.7% (262,042)
Nicaragua Oak Ridge:
3.3% (304)Florida:
2.3% (105,066)
Guyana Oak Ridge:
2.9% (274)Florida:
0.7% (33,556)
Ecuador Oak Ridge:
2.5% (231)Florida:
1.2% (54,585)
Other Eastern Africa Oak Ridge:
2.1% (195)Florida:
0.1% (2,818)
Place of birth for U.S.-born residents:
This state: 7,367Other state: 5,838Northeast: 2,796Midwest: 528South: 2,215West: 321 83.3% of Oak Ridge residents lived in the same house 1 years ago.
Out of people who lived in different houses, 36.1% lived in this county.
Out of people who lived in different counties, 66.0% lived in Florida.
Oak Ridge:
83.3%State average:
86.3%
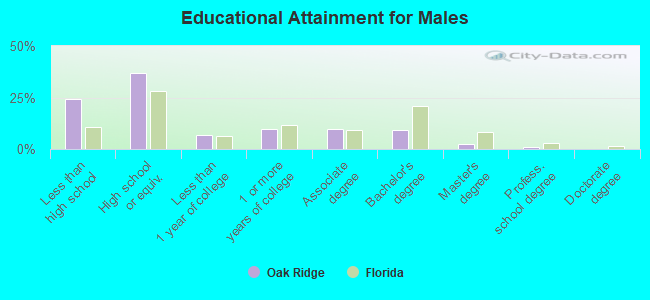
Education attainment for males 25 years and older:
No schooling: 796Nursery to 4th grade: 1575th and 6th grade: 3407th and 8th grade: 3369th grade: 12510th grade: 6511th grade: 4212th grade, no diploma: 109High school graduate (or equivalency): 3,015Less than 1 year of college: 560Some college more than 1 year, no degree: 779Associate degree: 804Bachelor's degree: 749Master's degree: 196Professional school degree: 67Doctorate degree: 0
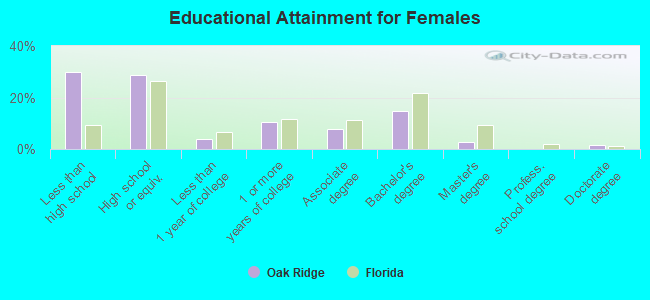
Education attainment for females 25 years and older:
No schooling: 273Nursery to 4th grade: 2665th and 6th grade: 2617th and 8th grade: 2439th grade: 34210th grade: 30011th grade: 25112th grade, no diploma: 302High school graduate (or equivalency): 2,151Less than 1 year of college: 287Some college more than 1 year, no degree: 770Associate degree: 584Bachelor's degree: 1,113Master's degree: 212Professional school degree: 0Doctorate degree: 108
Housing units in structures:
One, detached: 3,729One, attached: 206Two: 1213 or 4: 4975 to 9: 1,37010 to 19: 1,87820 to 49: 64150 or more: 533Mobile homes: 201Median worth of mobile homes: $16,433
Housing units lacking complete plumbing facilities in 2022: 1.2%Housing units lacking complete kitchen facilities in 2022: 0.7%House/condo owner moved in on average 15 years ago
Renter moved in on average 3 years ago
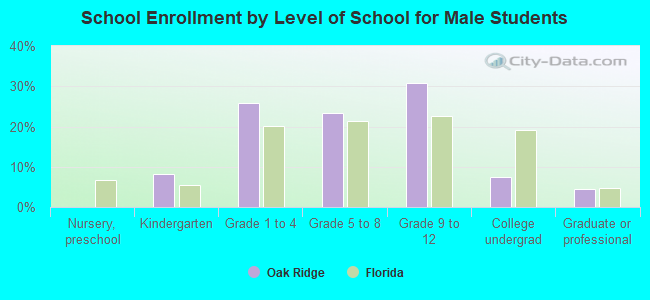
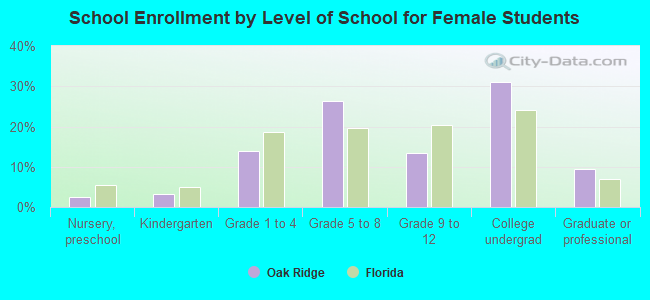
Private vs. public school enrollment:
Students in private schools in grades 1 to 8 (elementary and middle school): 672 Students in private schools in grades 9 to 12 (high school): 81 Students in private undergraduate colleges: 575