Odessa, TX (Texas) Houses and Residents
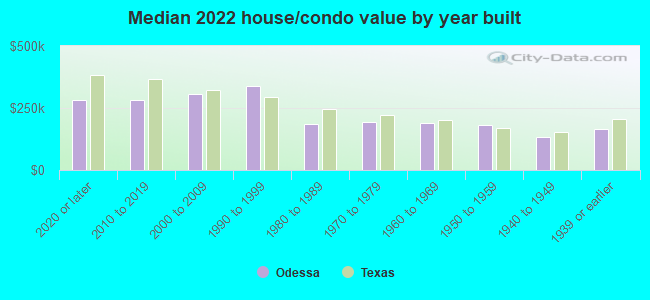
Estimated median house or condo value in 2022: $206,800 (it was $46,500 in 2000 )
Odessa:
$206,800Texas:
$275,400
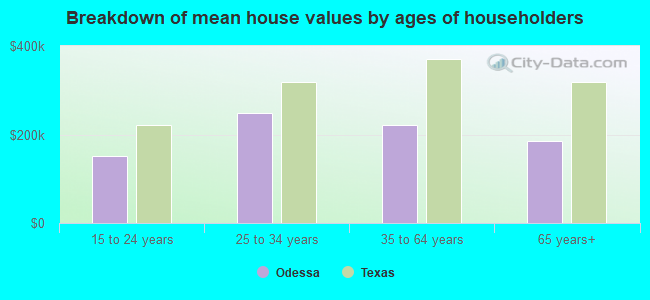
Lower value quartile - upper value quartile: $128,000 - $290,500Mean price in 2022: Detached houses: $260,980 Here:
$260,980State:
$369,058
Townhouses or other attached units: $130,348 Here:
$130,348State:
$327,631
In 2-unit structures: $169,783 Here:
$169,783State:
$374,947
In 3-to-4-unit structures: $128,742 Here:
$128,742State:
$209,652
In 5-or-more-unit structures: $170,118 Here:
$170,118State:
$413,944
Mobile homes: $125,721 Here:
$125,721State:
$124,413
Occupied boats, RVs, vans, etc.: $15,673 Here:
$15,673State:
$73,921
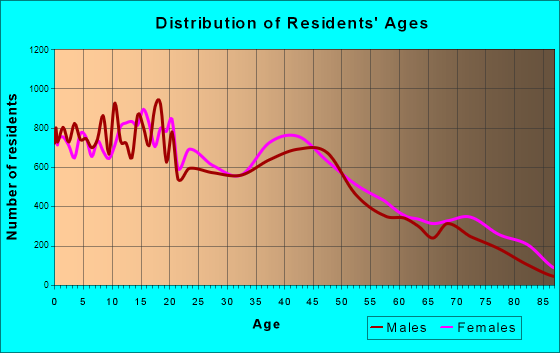
Total population: 114,597 (Urban population: 90,678, Rural population: 375 (all nonfarm) )
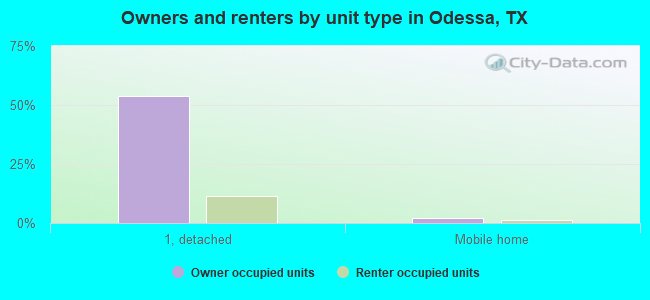
Houses: 52,122 (47,752 occupied: 28,756 owner occupied, 18,996 renter occupied )
% of renters here:
40%State:
38%
Housing density: 1,416 houses/condos per square mile
Median price asked for vacant for-sale houses and condos in 2022: $260,339.
Median contract rent in 2022: $1,054 (lower quartile is $778, upper quartile is $1,310)
Median rent asked for vacant for-rent units in 2022: $904
Median gross rent in Odessa, TX in 2022: $1,202
Housing units in Odessa with a mortgage: 16,895 (1,311 second mortgage, 0 home equity loan, 467 both second mortgage and home equity loan )Houses without a mortgage: 263
Median household income for houses/condos with a mortgage: $98,499
Median household income for apartments without a mortgage: $74,240
Median monthly housing costs: $1,199
Data:
Median house or condo value ($)
Median house or condo value ($ change since 2000)
Median house or condo value ($) - White
Median house or condo value ($) - Black or African American
Median house or condo value ($) - Asian
Median house or condo value ($) - Hispanic or Latino
Median house or condo value ($) - American Indian and Alaska Native
Median house or condo value ($) - Multirace
Median house or condo value ($) - Other Race
Median price asked for mobile homes ($)
Household density (households per square mile)
Mean house or condo value by units in structure - 1, detached ($)
Mean house or condo value by units in structure - 1, attached ($)
Mean house or condo value by units in structure - 2 ($)
Mean house or condo value by units in structure by units in structure - 3 or 4 ($)
Mean house or condo value by units in structure - 5 or more ($)
Mean house or condo value by units in structure - Boat, RV, van, etc. ($)
Mean house or condo value by units in structure - Mobile home ($)
Median contract rent ($)
Median contract rent - Lower quartile ($)
Median contract rent - Upper quartile ($)
Median gross rent ($)
Urban houses (%)
Rural houses (%)
Houses occupied (%)
Houses occupied (% change since 2000)
Houses owner occupied (%)
Houses owner occupied (% change since 2000)
Houses renter occupied (%)
Houses renter occupied (% change since 2000)
Vacant housing units - For rent (%)
Vacant housing units - For rent (% change since 2000)
Vacant housing units - For sale only (%)
Vacant housing units - For sale only (% change since 2000)
Vacant housing units - Rented or sold, not occupied (%)
Vacant housing units - Rented or sold, not occupied (% change since 2000)
Vacant housing units - For seasonal, recreational, or occasional use (%)
Vacant housing units - For seasonal, recreational, or occasional use (% change since 2000)
Vacant housing units - For migrant workers (%)
Vacant housing units - For migrant workers (% change since 2000)
Vacant housing units - Other vacant (%)
Vacant housing units - Other vacant (% change since 2000)
Median monthly housing costs ($)
Median household income for houses/condos with a mortgage ($)
Median household income for houses/condos without a mortgage ($)
Median household income ($)
Median household income ($) - White
Median household income ($) - Black or African American
Median household income ($) - Asian
Median household income ($) - Hispanic or Latino
Median household income ($) - American Indian and Alaska Native
Median household income ($) - Multirace
Median household income ($) - Other Race
Mortgage status - with mortgage (%)
Mortgage status - with second mortgage (%)
Mortgage status - with home equity loan (%)
Mortgage status - with both second mortgage and home equity loan (%)
Mortgage status - without a mortgage (%)
Median year house/condo built
Median year apartment built
Household type by relationship - Male householder living alone (%)
Household type by relationship - Male householder not living alone (%)
Household type by relationship - Female householder living alone (%)
Household type by relationship - Female householder not living alone (%)
Household type by relationship - Opposite-Sex spouse (%)
Household type by relationship - Same-Sex spouse (%)
Household type by relationship - Opposite-Sex unmarried partner (%)
Household type by relationship - Same-Sex unmarried partner (%)
Household type by relationship - In group quarters (%)
Size of family households - 2-person household (%)
Size of family households - 3-person household (%)
Size of family households - 4-person household (%)
Size of family households - 5-person household (%)
Size of family households - 6-person household (%)
Size of family households - 7-or-more-person household (%)
Size of nonfamily households - 1-person household (%)
Size of nonfamily households - 2-person household (%)
Size of nonfamily households - 3-person household (%)
Size of nonfamily households - 4-person household (%)
Size of nonfamily households - 5-person household (%)
Size of nonfamily households - 6-person household (%)
Size of nonfamily households - 7-or-moreperson household (%)
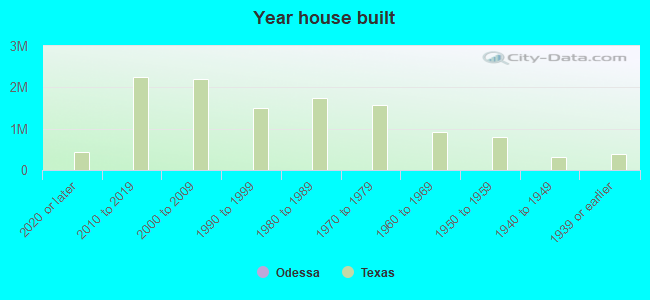
Year house built - Built 2010 or later (%)
Year house built - Built 2000 to 2009 (%)
Year house built - Built 1990 to 1999 (%)
Year house built - Built 1980 to 1989 (%)
Year house built - Built 1970 to 1979 (%)
Year house built - Built 1960 to 1969 (%)
Year house built - Built 1950 to 1959 (%)
Year house built - Built 1940 to 1949 (%)
Year house built - Built 1939 or earlier (%)
Median number of rooms in houses and condos
Median number of rooms in apartments
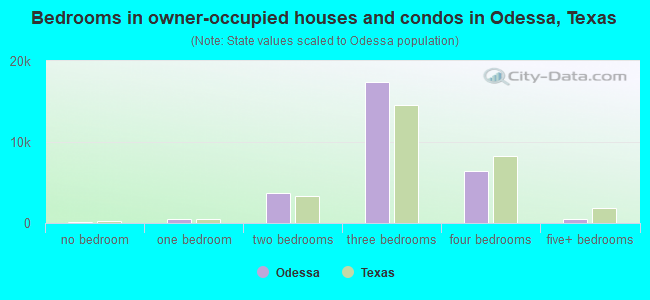
Median number of bedrooms in owner occupied houses
Mean number of bedrooms in owner occupied houses
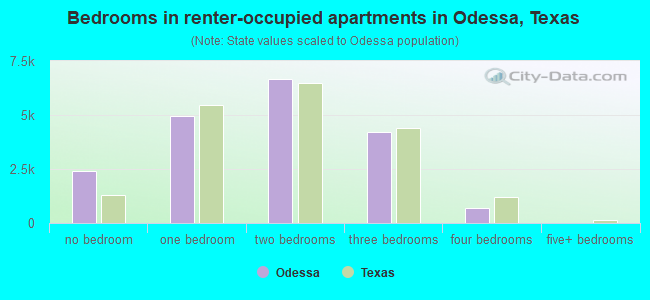
Median number of bedrooms in renter occupied houses
Mean number of bedrooms in renter occupied houses
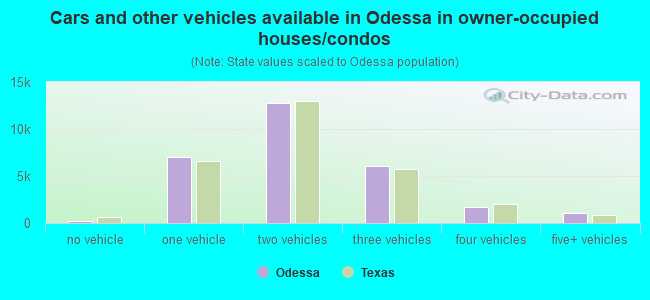
Median number of vehichles in owner occupied houses
Mean number of vehichles in owner occupied houses
Median number of vehichles in renter occupied houses
Mean number of vehichles in renter occupied houses
Rooms in owner-occupied houses - 1 room (%)
Rooms in owner-occupied houses - 2 rooms (%)
Rooms in owner-occupied houses - 3 rooms (%)
Rooms in owner-occupied houses - 4 rooms (%)
Rooms in owner-occupied houses - 5 rooms (%)
Rooms in owner-occupied houses - 6 rooms (%)
Rooms in owner-occupied houses - 7 rooms (%)
Rooms in owner-occupied houses - 8 rooms (%)
Rooms in owner-occupied houses - 9+ rooms (%)
Rooms in renter-occupied houses - 1 room (%)
Rooms in renter-occupied houses - 2 rooms (%)
Rooms in renter-occupied houses - 3 rooms (%)
Rooms in renter-occupied houses - 4 rooms (%)
Rooms in renter-occupied houses - 5 rooms (%)
Rooms in renter-occupied houses - 6 rooms (%)
Rooms in renter-occupied houses - 7 rooms (%)
Rooms in renter-occupied houses - 8 rooms (%)
Rooms in renter-occupied houses - 9+ rooms (%)
Bedrooms in owner-occupied houses - no bedrooms (%)
Bedrooms in owner-occupied houses - 1 bedroom (%)
Bedrooms in owner-occupied houses - 2 bedrooms (%)
Bedrooms in owner-occupied houses - 3 bedrooms (%)
Bedrooms in owner-occupied houses - 4 bedrooms (%)
Bedrooms in owner-occupied houses - 5+ bedrooms (%)
Bedrooms in renter-occupied houses - no bedrooms (%)
Bedrooms in renter-occupied houses - 1 bedroom (%)
Bedrooms in renter-occupied houses - 2 bedrooms (%)
Bedrooms in renter-occupied houses - 3 bedrooms (%)
Bedrooms in renter-occupied houses - 4 bedrooms (%)
Bedrooms in renter-occupied houses - 5+ bedrooms (%)
Vehicles available in owner-occupied houses - no vehicle available (%)
Vehicles available in owner-occupied houses - 1 vehicle available(%)
Vehicles available in owner-occupied houses - 2 Vehicles available (%)
Vehicles available in owner-occupied houses - 3 Vehicles available (%)
Vehicles available in owner-occupied houses - 4 Vehicles available (%)
Vehicles available in owner-occupied houses - 5+ Vehicles available (%)
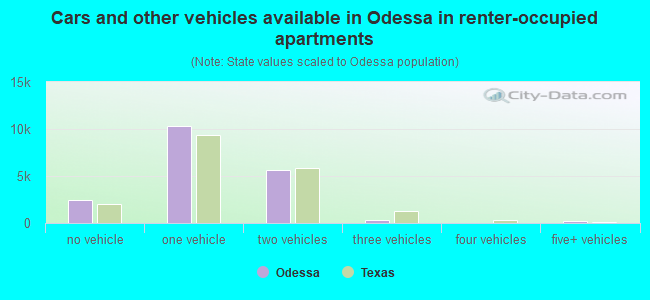
Vehicles available in renter-occupied houses - no vehicle available (%)
Vehicles available in renter-occupied houses - 1 vehicle available (%)
Vehicles available in renter-occupied houses - 2 Vehicles available (%)
Vehicles available in renter-occupied houses - 3 Vehicles available (%)
Vehicles available in renter-occupied houses - 4 Vehicles available (%)
Vehicles available in renter-occupied houses - 5+ Vehicles available (%)
Housing units in structures - 1, detached (%)
Housing units in structures - 1, attached (%)
Housing units in structures - 2 (%)
Housing units in structures - 3 or 4 (%)
Housing units in structures - 5 to 9 (%)
Housing units in structures - 10 to 19 (%)
Housing units in structures - 20 to 49 (%)
Housing units in structures - 50 or more (%)
Housing units in structures - Mobile home (%)
Housing units in structures - Boat, RV, van, etc. (%)
Housing units in structures - Owners - 1, detached (%)
Housing units in structures - Owners - 1, attached (%)
Housing units in structures - Owners - 2 (%)
Housing units in structures - Owners - 3 or 4 (%)
Housing units in structures - Owners - 5 to 9 (%)
Housing units in structures - Owners - 10 to 19 (%)
Housing units in structures - Owners - 20 to 49 (%)
Housing units in structures - Owners - 50 or more (%)
Housing units in structures - Owners - Mobile home (%)
Housing units in structures - Owners - Boat, RV, van, etc. (%)
Housing units in structures - Renters - 1, detached (%)
Housing units in structures - Renters - 1, attached (%)
Housing units in structures - Renters - 2 (%)
Housing units in structures - Renters - 3 or 4 (%)
Housing units in structures - Renters - 5 to 9 (%)
Housing units in structures - Renters - 10 to 19 (%)
Housing units in structures - Renters - 20 to 49 (%)
Housing units in structures - Renters - 50 or more (%)
Housing units in structures - Renters - Mobile home (%)
Housing units in structures - Renters - Boat, RV, van, etc. (%)
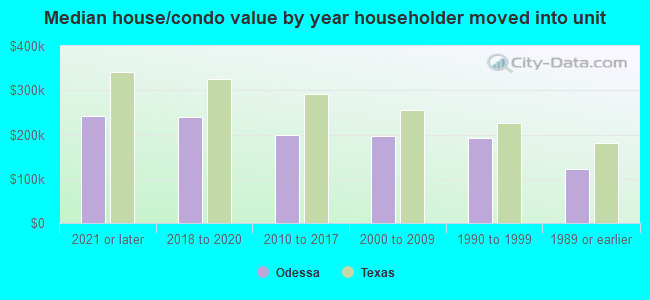
House/condo owner moved in on average (years ago)
Renter moved in on average (years ago)
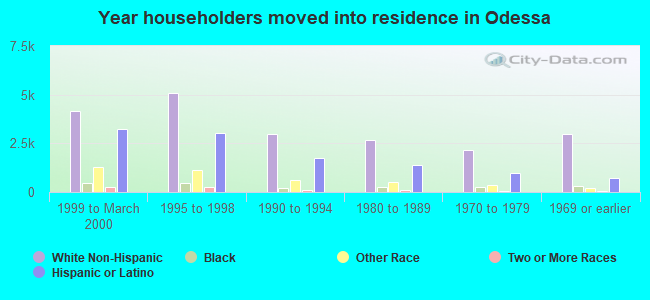
Year householder moved into unit - Moved in 1999 to March 2000 (%)
Year householder moved into unit - Moved in 1999 to March 2000 (%) - White
Year householder moved into unit - Moved in 1999 to March 2000 (%) - Black or African American
Year householder moved into unit - Moved in 1999 to March 2000 (%) - Asian
Year householder moved into unit - Moved in 1999 to March 2000 (%) - Hispanic or Latino
Year householder moved into unit - Moved in 1999 to March 2000 (%) - American Indian and Alaska Native
Year householder moved into unit - Moved in 1999 to March 2000 (%) - Multirace
Year householder moved into unit - Moved in 1999 to March 2000 (%) - Other Race
Year householder moved into unit - Moved in 1995 to 1998 (%)
Year householder moved into unit - Moved in 1995 to 1998 (%) - White
Year householder moved into unit - Moved in 1995 to 1998 (%) - Black or African American
Year householder moved into unit - Moved in 1995 to 1998 (%) - Asian
Year householder moved into unit - Moved in 1995 to 1998 (%) - Hispanic or Latino
Year householder moved into unit - Moved in 1995 to 1998 (%) - American Indian and Alaska Native
Year householder moved into unit - Moved in 1995 to 1998 (%) - Multirace
Year householder moved into unit - Moved in 1995 to 1998 (%) - Other Race
Year householder moved into unit - Moved in 1990 to 1994 (%)
Year householder moved into unit - Moved in 1990 to 1994 (%) - White
Year householder moved into unit - Moved in 1990 to 1994 (%) - Black or African American
Year householder moved into unit - Moved in 1990 to 1994 (%) - Asian
Year householder moved into unit - Moved in 1990 to 1994 (%) - Hispanic or Latino
Year householder moved into unit - Moved in 1990 to 1994 (%) - American Indian and Alaska Native
Year householder moved into unit - Moved in 1990 to 1994 (%) - Multirace
Year householder moved into unit - Moved in 1990 to 1994 (%) - Other Race
Year householder moved into unit - Moved in 1980 to 1989 (%)
Year householder moved into unit - Moved in 1980 to 1989 (%) - White
Year householder moved into unit - Moved in 1980 to 1989 (%) - Black or African American
Year householder moved into unit - Moved in 1980 to 1989 (%) - Asian
Year householder moved into unit - Moved in 1980 to 1989 (%) - Hispanic or Latino
Year householder moved into unit - Moved in 1980 to 1989 (%) - American Indian and Alaska Native
Year householder moved into unit - Moved in 1980 to 1989 (%) - Multirace
Year householder moved into unit - Moved in 1980 to 1989 (%) - Other Race
Year householder moved into unit - Moved in 1970 to 1979 (%)
Year householder moved into unit - Moved in 1970 to 1979 (%) - White
Year householder moved into unit - Moved in 1970 to 1979 (%) - Black or African American
Year householder moved into unit - Moved in 1970 to 1979 (%) - Asian
Year householder moved into unit - Moved in 1970 to 1979 (%) - Hispanic or Latino
Year householder moved into unit - Moved in 1970 to 1979 (%) - American Indian and Alaska Native
Year householder moved into unit - Moved in 1970 to 1979 (%) - Multirace
Year householder moved into unit - Moved in 1970 to 1979 (%) - Other Race
Year householder moved into unit - Moved in 1969 or earlier (%)
Year householder moved into unit - Moved in 1969 or earlier (%) - White
Year householder moved into unit - Moved in 1969 or earlier (%) - Black or African American
Year householder moved into unit - Moved in 1969 or earlier (%) - Asian
Year householder moved into unit - Moved in 1969 or earlier (%) - Hispanic or Latino
Year householder moved into unit - Moved in 1969 or earlier (%) - American Indian and Alaska Native
Year householder moved into unit - Moved in 1969 or earlier (%) - Multirace
Year householder moved into unit - Moved in 1969 or earlier (%) - Other Race
Housing units lacking complete plumbing facilities (%)
Housing units lacking complete kitchen facilities (%)
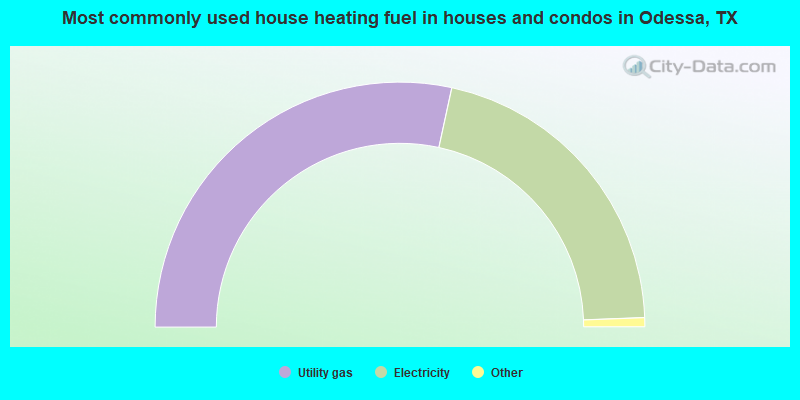
House heating fuel used in houses and condos - Utility gas (%)
House heating fuel used in houses and condos - Bottled, tank, or LP gas (%)
House heating fuel used in houses and condos - Electricity (%)
House heating fuel used in houses and condos - Fuel oil, kerosene, etc. (%)
House heating fuel used in houses and condos - Coal or coke (%)
House heating fuel used in houses and condos - Wood (%)
House heating fuel used in houses and condos - Solar energy (%)
House heating fuel used in houses and condos - Other fuel (%)
House heating fuel used in houses and condos - No fuel used (%)
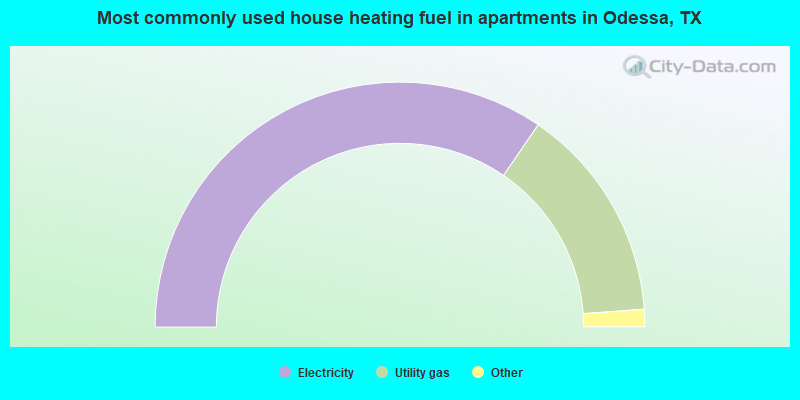
House heating fuel used in apartments - Utility gas (%)
House heating fuel used in apartments - Bottled, tank, or LP gas (%)
House heating fuel used in apartments - Electricity (%)
House heating fuel used in apartments - Fuel oil, kerosene, etc. (%)
House heating fuel used in apartments - Coal or coke (%)
House heating fuel used in apartments - Wood (%)
House heating fuel used in apartments - Solar energy (%)
House heating fuel used in apartments - Other fuel (%)
House heating fuel used in apartments - No fuel used (%)
Latest news about housing in Odessa, TX collected exclusively by city-data.com from local newspapers, TV, and radio stations
Median year house/condo built: 1971Median year apartment built: 1983Household type by relationship:
Households: 116,669
Male householders: 23,495 (7,469 living alone ), Female householders: 24,257 (6,771 living alone )18,985 spouses (18,910 opposite-sex spouses ), 4,118 unmarried partners , (4,009 opposite-sex unmarried partners ), 34,273 children (32,532 natural , 697 adopted , 1,044 stepchildren ), 3,404 grandchildren , 283 brothers or sisters , 443 parents , 0 foster children , 3,621 other relatives , 1,686 non-relatives In group quarters: 2,104
Size of family households: 11,115 2-persons , 6,922 3-persons , 7,595 4-persons , 3,858 5-persons , 674 6-persons , 713 7-or-more-persons .
Size of nonfamily households: 14,240 1-person , 2,410 2-persons , 225 3-persons .
17,973 married couples with children. single-parent households (2,026 men , 8,275 women ).
56.5% of residents of Odessa speak English at home. of residents speak Spanish at home (74% speak English very well , 14% speak English well , 8% speak English not well , 4% don't speak English at all ).of residents speak other Indo-European language at home (81% speak English very well , 13% speak English well , 6% speak English not well ).of residents speak Asian or Pacific Island language at home (72% speak English very well , 23% speak English well , 5% speak English not well ).of residents speak other language at home (96% speak English very well , 4% speak English well ).
Foreign born population: 17,794 (15.3%)of them are naturalized citizens )
Median number of rooms in houses and condos:
Median number of rooms in apartments
Owner-occupied Renter-occupied
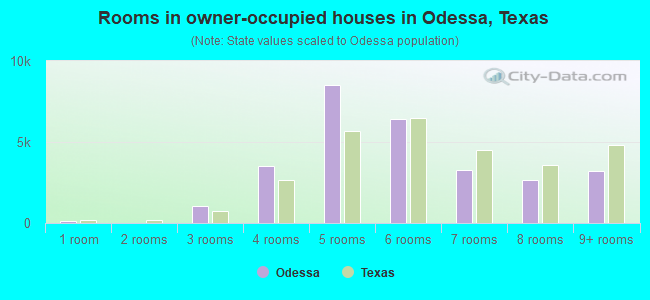
Rooms in owner-occupied houses in Odessa, Texas
142 1 room 0 2 rooms 1,067 3 rooms 3,544 4 rooms 8,505 5 rooms 6,390 6 rooms 3,252 7 rooms 2,625 8 rooms 3,231 9+ rooms
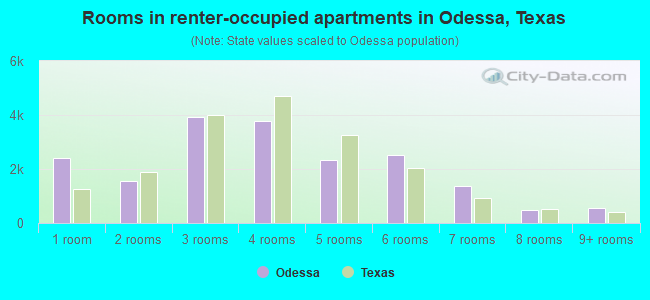
Rooms in renter-occupied apartments in Odessa, Texas
2,422 1 room 1,541 2 rooms 3,938 3 rooms 3,796 4 rooms 2,336 5 rooms 2,530 6 rooms 1,388 7 rooms 491 8 rooms 554 9+ rooms
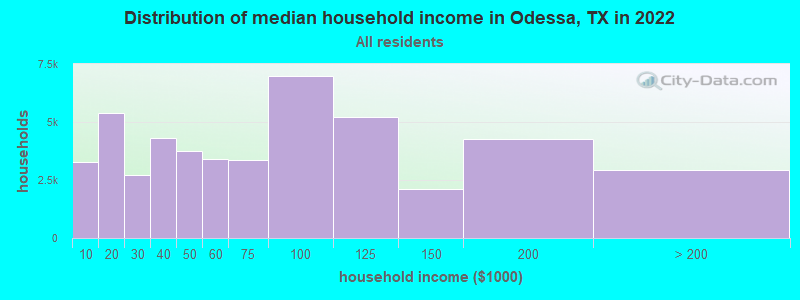
Odessa, TX household income distribution 3,260 Less than $10,0005,387 $10,000 to $19,9992,737 $20,000 to $29,9994,304 $30,000 to $39,9993,749 $40,000 to $49,9993,415 $50,000 to $59,9993,369 $60,000 to $74,9997,002 $75,000 to $99,9995,216 $100,000 to $124,9992,124 $125,000 to $149,9994,260 $150,000 to $199,9992,929 $200,000 or more
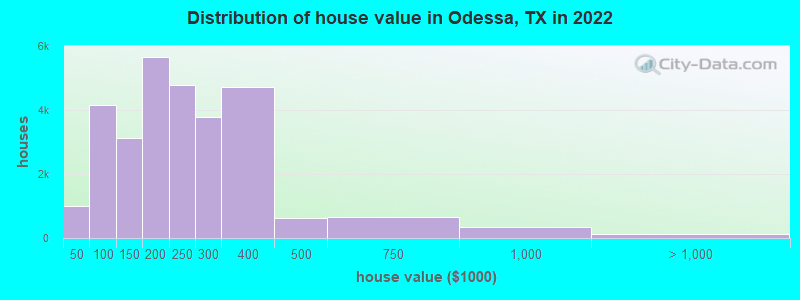
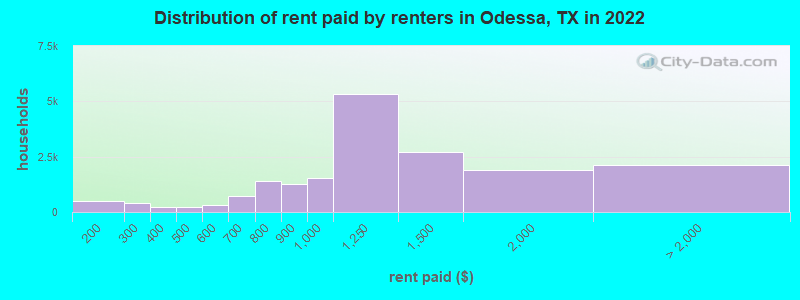
Home value of owner - occupied houses in 2022 in Odessa, TX 369 Less than $10,000189 $10,000 to $14,999123 $15,000 to $19,99988 $20,000 to $24,999245 $40,000 to $49,99921 $50,000 to $59,999726 $60,000 to $69,9991,148 $70,000 to $79,9991,507 $80,000 to $89,999518 $90,000 to $99,9992,133 $100,000 to $124,9991,003 $125,000 to $149,9992,666 $150,000 to $174,9992,996 $175,000 to $199,9994,784 $200,000 to $249,9993,767 $250,000 to $299,9994,731 $300,000 to $399,999621 $400,000 to $499,999644 $500,000 to $749,999351 $750,000 to $999,999126 $1,000,000 to $1,499,999Rent paid by renters in 2022 in Odessa, TX 43 Less than $100290 $100 to $149188 $150 to $199404 $200 to $24916 $250 to $299126 $300 to $34983 $350 to $399104 $400 to $449120 $450 to $499158 $500 to $549166 $550 to $599483 $600 to $649237 $650 to $699606 $700 to $749805 $750 to $7991,267 $800 to $8991,532 $900 to $9995,337 $1,000 to $1,2492,714 $1,250 to $1,4991,897 $1,500 to $1,999889 $2,000 to $2,499127 $2,500 to $2,999118 $3,000 to $3,49980 $3,500 or more886 No cash rent
Percentage of workers working in this county: 74.8%Number of people working at home: 2,337 (4.2% of all workers )
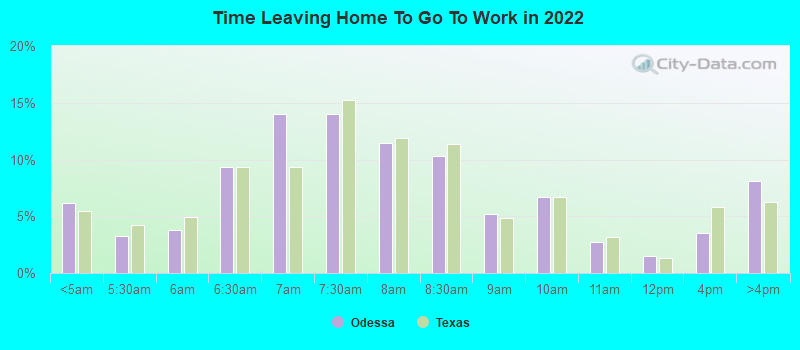
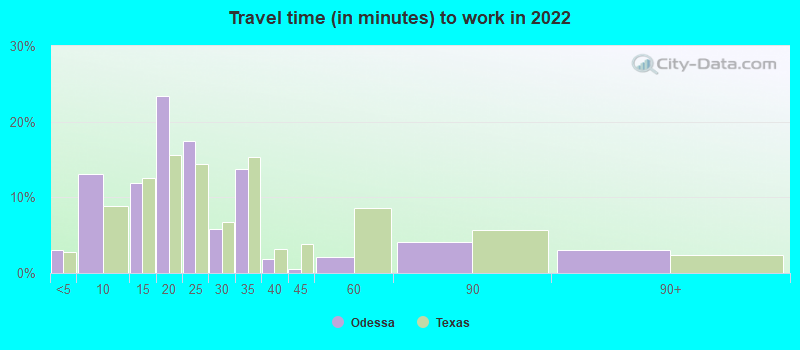
Travel time to work (commute)
Less than 5 minutes: 1,5865 to 9 minutes: 7,38510 to 14 minutes: 8,33715 to 19 minutes: 12,18120 to 24 minutes: 6,95625 to 29 minutes: 1,84130 to 34 minutes: 7,72435 to 39 minutes: 44840 to 44 minutes: 82645 to 59 minutes: 69960 to 89 minutes: 2,24590 or more minutes: 2,251
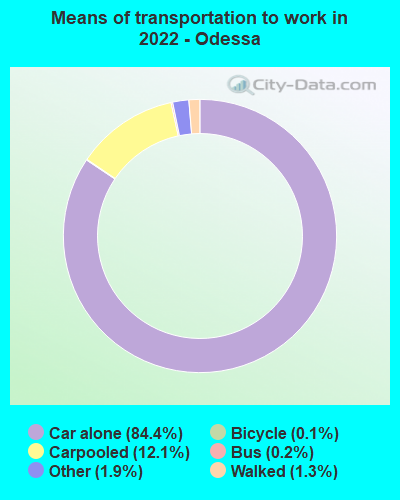
Means of transportation to work:
Drove a car alone: 46,658 (77.6%)Carpooled: 7,271 (12.1%)Bus : 95 (0.2%)Light rail, streetcar or trolley : 7 (0.0%)Taxi: 1,291 (2.1%)Bicycle: 74 (0.1%)Walked: 762 (1.3%)Worked at home: 2,337 (3.9%)
Unemployment by race in 2022
Unemployment rate for White non-Hispanic residents 7.6% Males3.1% FemalesUnemployment rate for Black residents 3.1% Males8.4% FemalesUnemployment rate for American Indian and Alaska Native residents 6.2% MalesUnemployment rate for Asian residents 7.0% MalesUnemployment rate for other race residents 2.4% Males13.4% FemalesUnemployment rate for two or more race residents 1.9% Males21.6% FemalesUnemployment rate for Hispanic or Latino residents 1.9% Males8.8% Females
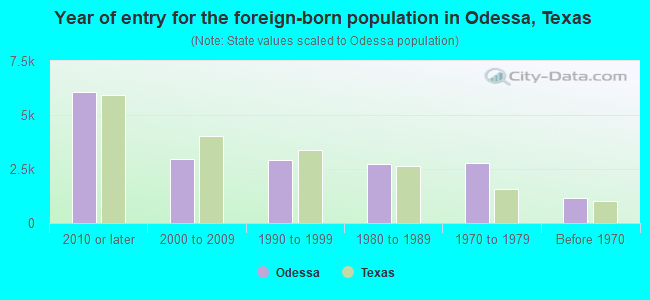
Year of entry for the foreign-born population in Odessa, Texas
6,057 2010 or later 2,958 2000 to 2009 2,928 1990 to 1999 2,719 1980 to 1989 2,762 1970 to 1979 1,159 Before 1970
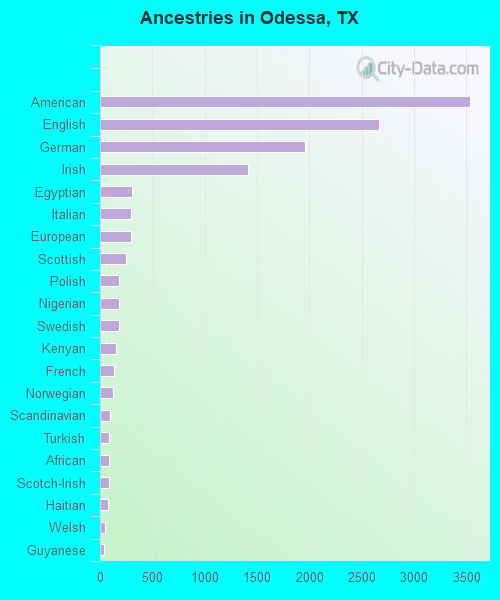
First ancestries reported:
American: 3,541 (4.6%)
English: 2,667 (3.4%)
German: 1,962 (2.5%)
Irish: 1,413 (1.8%)
Egyptian: 304 (0.4%)
Italian: 299 (0.4%)
European: 292 (0.4%)
Scottish: 244 (0.3%)
Polish: 182 (0.2%)
Nigerian: 182 (0.2%)
Swedish: 180 (0.2%)
Kenyan: 149 (0.2%)
French: 136 (0.2%)
Norwegian: 121 (0.2%)
Scandinavian: 97 (0.1%)
Turkish: 90 (0.1%)
African: 89 (0.1%)
Scotch-Irish: 88 (0.1%)
Haitian: 73 (0.09%)
Welsh: 48 (0.06%)
Guyanese: 36 (0.05%)
Eastern European: 27 (0.03%)
French Canadian: 27 (0.03%)
British: 26 (0.03%)
Dutch: 25 (0.03%)
Greek: 25 (0.03%)
Austrian: 17 (0.02%)
Northern European: 15 (0.02%)
Finnish: 14 (0.02%)
Czech: 11 (0.01%)
Ghanaian: 10 (0.01%)
Australian: 8 (0.01%)
Brazilian: 8 (0.01%)
Trinidadian and Tobagonian: 7 (0.01%) Most common places of birth for foreign-born residents (%): Mexico Odessa:
67.5% (10,899)Texas:
48.4% (2,411,723)
Cuba Odessa:
7.3% (1,174)Texas:
1.3% (62,978)
Venezuela Odessa:
2.8% (452)Texas:
1.5% (72,413)
Philippines Odessa:
2.4% (387)Texas:
2.1% (103,148)
India Odessa:
1.8% (284)Texas:
6.1% (306,347)
Place of birth for U.S.-born residents:
This state: 78,543Other state: 18,962Northeast: 289Midwest: 3,732South: 5,610West: 9,331 86.8% of Odessa residents lived in the same house 1 years ago.
Out of people who lived in different houses, 24.2% lived in this county.
Out of people who lived in different counties, 75.4% lived in Texas.
Odessa:
86.8%State average:
85.7%
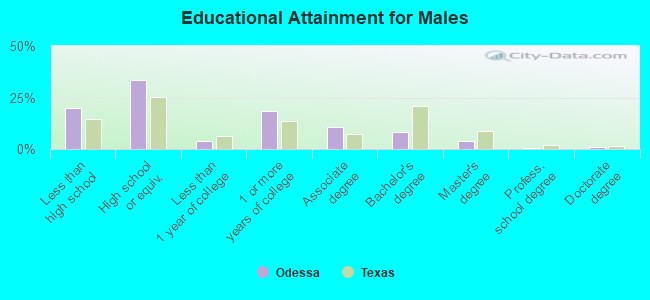
Education attainment for males 25 years and older:
No schooling: 2,180Nursery to 4th grade: 2705th and 6th grade: 2527th and 8th grade: 1,0719th grade: 17210th grade: 63511th grade: 57512th grade, no diploma: 2,200High school graduate (or equivalency): 12,217Less than 1 year of college: 1,390Some college more than 1 year, no degree: 6,660Associate degree: 3,884Bachelor's degree: 3,026Master's degree: 1,441Professional school degree: 239Doctorate degree: 363
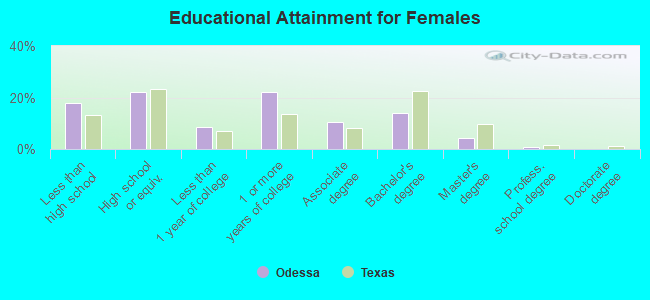
Education attainment for females 25 years and older:
No schooling: 1,301Nursery to 4th grade: 5625th and 6th grade: 1607th and 8th grade: 7829th grade: 25010th grade: 2,10811th grade: 29412th grade, no diploma: 695High school graduate (or equivalency): 7,738Less than 1 year of college: 2,898Some college more than 1 year, no degree: 7,645Associate degree: 3,664Bachelor's degree: 4,840Master's degree: 1,524Professional school degree: 239Doctorate degree: 0
Housing units in structures:
One, detached: 33,403One, attached: 1,146Two: 1,4723 or 4: 1,5315 to 9: 1,86510 to 19: 5,70720 to 49: 2,12950 or more: 2,019Mobile homes: 2,513Boats, RVs, vans, etc.: 337Median worth of mobile homes: $85,300
Housing units lacking complete plumbing facilities in 2022: 1.4%Housing units lacking complete kitchen facilities in 2022: 4.2%House/condo owner moved in on average 10 years ago
Renter moved in on average 0 years ago
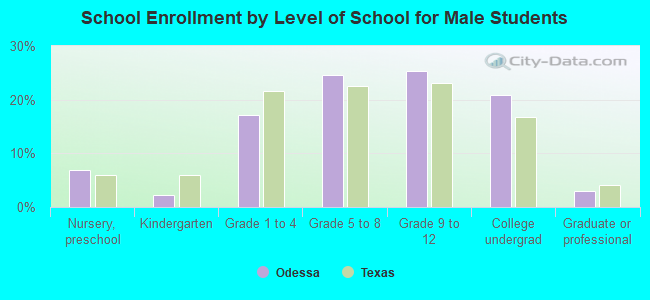
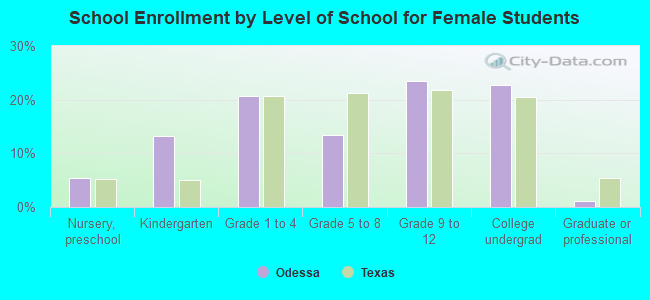
Private vs. public school enrollment:
Students in private schools in grades 1 to 8 (elementary and middle school): 1,307 Students in private schools in grades 9 to 12 (high school): 1,115 Students in private undergraduate colleges: 759