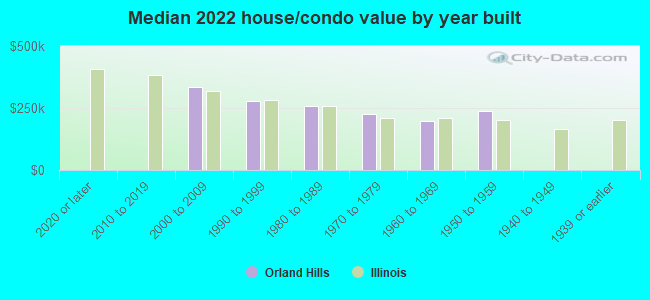
Orland Hills, IL (Illinois) Houses and Residents
| Orland Hills: | $251,731 |
| Illinois: | $251,600 |
Mean price in 2022:
Detached houses: $281,527
Here: $281,527 State: $310,164 Townhouses or other attached units: $347,364
Here: $347,364 State: $286,230 In 5-or-more-unit structures: $186,452
Here: $186,452 State: $318,887
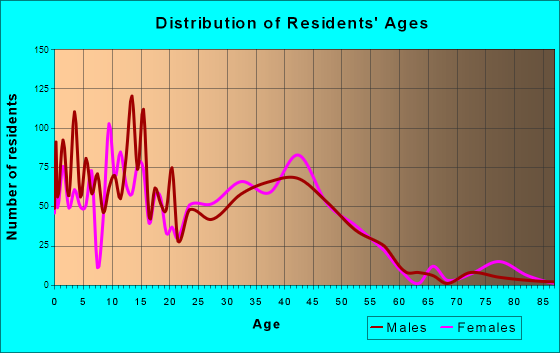
Total population: 7,277 (Urban population: 6,860, Rural population: 0)
Houses: 2,498 (2,339 occupied: 1,905 owner occupied, 473 renter occupied)
| % of renters here: | 20% |
| State: | 33% |
Housing density: 2,291 houses/condos per square mile
Median price asked for vacant for-sale houses and condos in 2022: $271,007.
Median contract rent in 2022: $1,213 (lower quartile is $1,035, upper quartile is $1,545)
Median rent asked for vacant for-rent units in 2022: $206
Median gross rent in Orland Hills, IL in 2022: $1,360
Housing units in Orland Hills with a mortgage: 1,512 (76 second mortgage, 14 home equity loan, 53 both second mortgage and home equity loan)
Houses without a mortgage: 56
Median household income for houses/condos with a mortgage: $109,228
Median household income for apartments without a mortgage: $116,571
Median monthly housing costs: $1,479
Compare current foreclosures near Orland Hills, IL:
| Photo | Address | Area | Beds / Baths | Price | Details |
|---|---|---|---|---|---|

|
#1
Greenwood Rd Apt B210
Dolton, IL 60419
|
900 sq. feet
|
1 baths 2 beds |
$89,000
|
show details |

|
#2
Devonshire Dr
Joliet, IL 60435
|
1,860 sq. feet
|
2 baths 3 beds |
$335,000
|
show details |

|
#3
Prairie Ave
Calumet City, IL 60409
|
2,841 sq. feet
|
2 baths 6 beds |
$159,500
|
show details |

|
#4
Dorchester Ave
Dolton, IL 60419
|
925 sq. feet
|
1 baths 3 beds |
$86,100
|
show details |

|
#5
Tarpon Ct
Homewood, IL 60430
|
1,800 sq. feet
|
3 baths 4 beds |
$355,000
|
show details |

|
#6
Lincoln Ave
Dolton, IL 60419
|
1,966 sq. feet
|
2 baths 3 beds |
$77,500
|
show details |

|
#7
S Calumet Ave
Chicago, IL 60619
|
1,302 sq. feet
|
1 baths 5 beds |
$114,400
|
show details |

|
#8
Maplewood Ln
Joliet, IL 60433
|
960 sq. feet
|
1 baths 3 beds |
$275,000
|
show details |

|
#9
S Perry Ave
Chicago, IL 60628
|
1,248 sq. feet
|
1 baths 3 beds |
$104,000
|
show details |

|
#10
Myrtle Ave
Harvey, IL 60426
|
1,365 sq. feet
|
1 baths 2 beds |
$49,500
|
show details |
| Photo | Address | Area | Beds / Baths | Price | Details |
|---|---|---|---|---|---|

|
#11
S Calumet Ave
Chicago, IL 60628
|
3,690 sq. feet
|
3 baths 6 beds |
$275,000
|
show details |

|
#12
Finch Ave
Harvey, IL 60426
|
1,108 sq. feet
|
2 baths 3 beds |
$225,000
|
show details |

|
#13
Richton Rd
Steger, IL 60475
|
1,400 sq. feet
|
1 baths 3 beds |
$209,900
|
show details |

|
#14
S Kensington Ave
La Grange, IL 60525
|
4,128 sq. feet
|
3 baths 4 beds |
$814,400
|
show details |

|
#15
Marquette Ave
Calumet City, IL 60409
|
1,316 sq. feet
|
1 baths 3 beds |
$144,000
|
show details |

|
#16
S 87th Ave
Justice, IL 60458
|
2,725 sq. feet
|
3 baths 4 beds |
$585,000
|
show details |

|
#17
Raymond Ave
Brookfield, IL 60513
|
1,020 sq. feet
|
1 baths 2 beds |
$239,200
|
show details |

|
#18
N Bruce Ln Apt 311
Glenwood, IL 60425
|
1,000 sq. feet
|
2 baths 2 beds |
$185,000
|
show details |

|
#19
W 63rd St
Chicago, IL 60638
|
1,250 sq. feet
|
2 baths 4 beds |
$395,000
|
show details |

|
#20
176th Pl
Lansing, IL 60438
|
1,511 sq. feet
|
1 baths 2 beds |
$187,200
|
show details |
| Photo | Address | Area | Beds / Baths | Price | Details |
|---|---|---|---|---|---|

|
#21
S Wood St
Chicago, IL 60620
|
899 sq. feet
|
1 baths 4 beds |
$93,600
|
show details |

|
#22
Peoria St
Steger, IL 60475
|
616 sq. feet
|
1 baths 2 beds |
$85,000
|
show details |

|
#23
S Yale Ave
Chicago, IL 60628
|
1,608 sq. feet
|
2 baths 3 beds |
$279,900
|
show details |

|
#24
Oxford Rd
Bolingbrook, IL 60440
|
1,672 sq. feet
|
2 baths 4 beds |
$152,000
|
show details |

|
#25
Wisconsin St
Joliet, IL 60432
|
832 sq. feet
|
1 baths 2 beds |
$199,900
|
show details |

|
#26
W 135th St
Orland Park, IL 60462
|
3,639 sq. feet
|
4 baths 5 beds |
$560,500
|
show details |

|
#27
S Ingleside Ave
Chicago, IL 60628
|
1,584 sq. feet
|
2 baths 3 beds |
$131,750
|
show details |

|
#28
W Arquilla Dr
Palos Heights, IL 60463
|
1,780 sq. feet
|
2 baths 2 beds |
$309,000
|
show details |

|
#29
W 108th St Apt D
Chicago, IL 60643
|
1,300 sq. feet
|
2 baths 3 beds |
$150,000
|
show details |

|
#30
S Bennett Ave
Chicago, IL 60617
|
1,052 sq. feet
|
1 baths 3 beds |
$278,000
|
show details |
| Photo | Address | Area | Beds / Baths | Price | Details |
|---|---|---|---|---|---|

|
#31
S King Dr
Chicago, IL 60619
|
880 sq. feet
|
1 baths 2 beds |
$89,400
|
show details |

|
#32
W Margaret St
Monee, IL 60449
|
1,680 sq. feet
|
2 baths 4 beds |
$287,000
|
show details |

|
#33
S Ada St
Chicago, IL 60636
|
2,619 sq. feet
|
2 baths 6 beds |
$244,400
|
show details |

|
#34
S Clyde Ave
Chicago, IL 60617
|
1,100 sq. feet
|
2 baths 3 beds |
$149,900
|
show details |

|
#35
145th St
Midlothian, IL 60445
|
2,000 sq. feet
|
1 baths 3 beds |
$199,900
|
show details |

|
#36
S Honore St
Chicago, IL 60636
|
1,232 sq. feet
|
2 baths 4 beds |
$79,000
|
show details |

|
#37
S Normal Ave
Chicago, IL 60628
|
989 sq. feet
|
1 baths 3 beds |
$154,375
|
show details |

|
#38
S Union Ave
Chicago, IL 60620
|
1,920 sq. feet
|
2 baths 4 beds |
$75,000
|
show details |

|
#39
W 106th St
Chicago, IL 60643
|
1,212 sq. feet
|
3 baths 5 beds |
$244,900
|
show details |

|
#40
S Churchill Dr
Richton Park, IL 60471
|
1,500 sq. feet
|
1 baths 4 beds |
$225,000
|
show details |
| Photo | Address | Area | Beds / Baths | Price | Details |
|---|---|---|---|---|---|

|
#41
186th St
Lansing, IL 60438
|
2,177 sq. feet
|
1 baths 4 beds |
$95,000
|
show details |

|
#42
Idlewild Dr
Country Club Hills, IL 60478
|
1,300 sq. feet
|
1 baths 3 beds |
$279,900
|
show details |

|
#43
Hellenic Dr
Olympia Fields, IL 60461
|
4,000 sq. feet
|
3 baths 4 beds |
$495,000
|
show details |

|
#44
S Main St
Hometown, IL 60456
|
744 sq. feet
|
1 baths 2 beds |
$175,000
|
show details |

|
#45
Lionel Rd
Riverside, IL 60546
|
952 sq. feet
|
1 baths - beds |
$179,900
|
show details |

|
#46
W 58th St
Chicago, IL 60629
|
- sq. feet
|
1 baths 3 beds |
$150,800
|
show details |

|
#47
S Charles St
Chicago, IL 60643
|
- sq. feet
|
4 baths 6 beds |
$369,900
|
show details |

|
#48
E 93rd St
Chicago, IL 60619
|
- sq. feet
|
3 baths 3 beds |
$215,500
|
show details |

|
#49
S Iris Ct
Monee, IL 60449
|
- sq. feet
|
2 baths 4 beds |
$324,900
|
show details |

|
Check over 1 million property listings on Foreclosure.com!
|
browse all offers | |||


 | Suburbs that are obscure or little-known (240 replies) |
| looking for a 1 bedroom apartment or condo in orland park (4 replies) |
| The southern suburbs in the next 10-20 years. (257 replies) |
| Underrated and overrated suburbs (132 replies) |
| moving out of Orland Park house on minimum wage and still stay in the south west burbs (4 replies) |
| Crestwood or Orland Hills? (5 replies) |
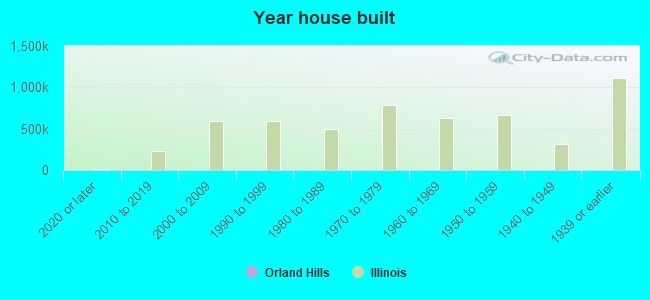
Median year apartment built: 1993
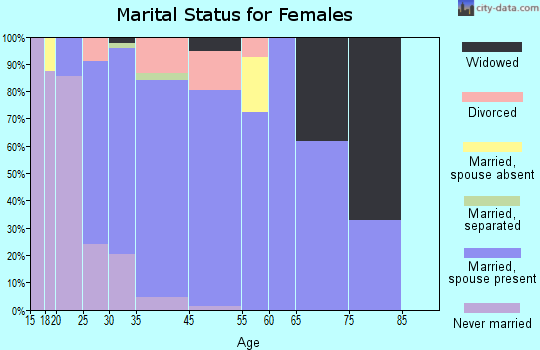
Household type by relationship:
Households: 6,690- Male householders: 1,366 (287 living alone), Female householders: 911 (220 living alone)
1,348 spouses (1,348 opposite-sex spouses), 142 unmarried partners, (142 opposite-sex unmarried partners), 2,488 children (2,452 natural, 0 adopted, 36 stepchildren), 251 grandchildren, 57 brothers or sisters, 46 parents, 0 foster children, 26 other relatives, 49 non-relatives
Size of family households: 565 2-persons, 370 3-persons, 429 4-persons, 145 5-persons, 175 6-persons, 36 7-or-more-persons.
Size of nonfamily households: 546 1-person, 83 2-persons.
1,020 married couples with children.
268 single-parent households (78 men, 190 women).
72.9% of residents of Orland Hills speak English at home.
6.6% of residents speak Spanish at home (80% speak English very well, 18% speak English well, 3% speak English not well).
1.0% of residents speak other Indo-European language at home (73% speak English very well, 14% speak English well, 13% speak English not well).
1.3% of residents speak Asian or Pacific Island language at home (85% speak English very well, 15% speak English well).
19.0% of residents speak other language at home (77% speak English very well, 23% speak English well).
Foreign born population: 1,105 (16.5%)
(78.0% of them are naturalized citizens)
| Here: | 6.4 |
| State: | 6.4 |
| Here: | 4.3 |
| State: | 4.1 |
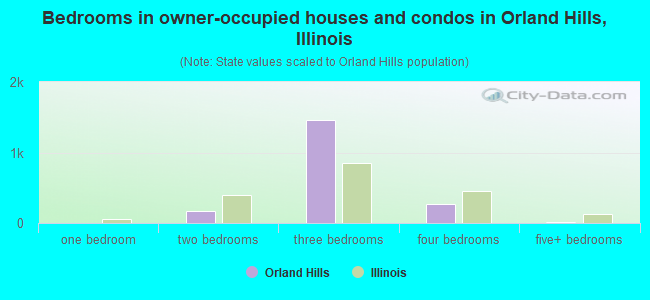
- Bedrooms in owner-occupied houses and condos in Orland Hills, Illinois
- 0no bedroom
- 01 bedroom
- 1652 bedrooms
- 1,4583 bedrooms
- 2674 bedrooms
- 165+ bedrooms
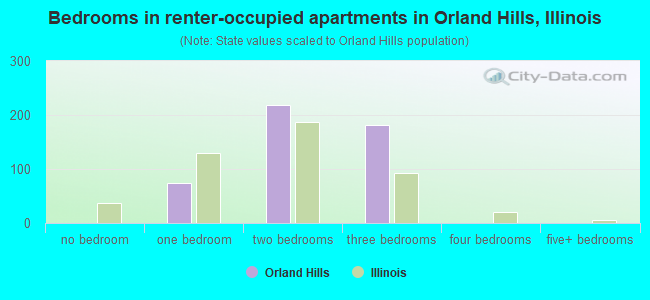
- Bedrooms in renter-occupied apartments in Orland Hills, Illinois
- 0no bedroom
- 751 bedroom
- 2182 bedrooms
- 1823 bedrooms
- 04 bedrooms
- 05+ bedrooms
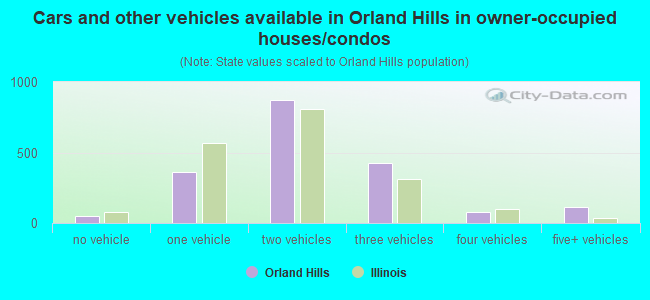
- Cars and other vehicles available in Orland Hills in owner-occupied houses/condos
- 50no vehicle
- 3631 vehicle
- 8722 vehicles
- 4273 vehicles
- 814 vehicles
- 1135+ vehicles
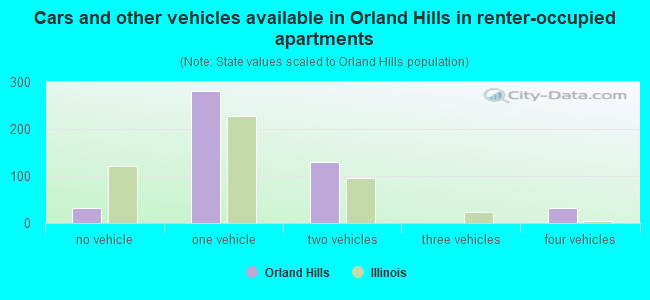
- Cars and other vehicles available in Orland Hills in renter-occupied apartments
- 32no vehicle
- 2811 vehicle
- 1302 vehicles
- 03 vehicles
- 324 vehicles
- 05+ vehicles
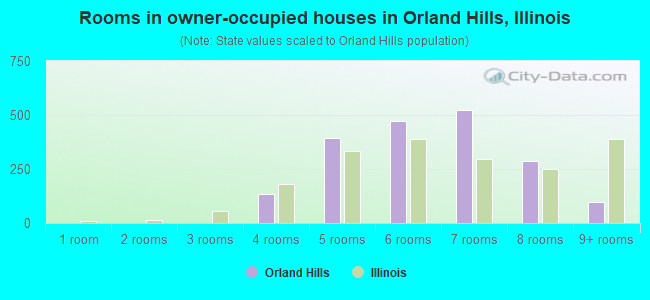
- Rooms in owner-occupied houses in Orland Hills, Illinois
- 01 room
- 02 rooms
- 03 rooms
- 1354 rooms
- 3935 rooms
- 4706 rooms
- 5237 rooms
- 2868 rooms
- 999+ rooms
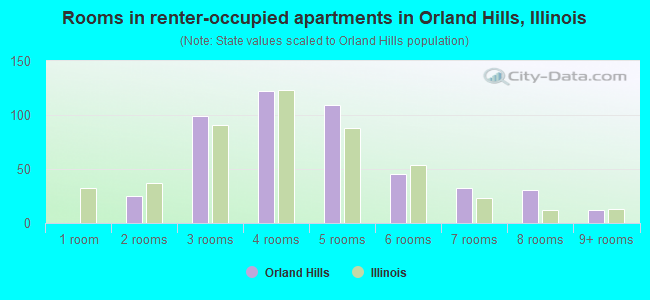
- Rooms in renter-occupied apartments in Orland Hills, Illinois
- 01 room
- 252 rooms
- 993 rooms
- 1224 rooms
- 1095 rooms
- 456 rooms
- 327 rooms
- 318 rooms
- 129+ rooms
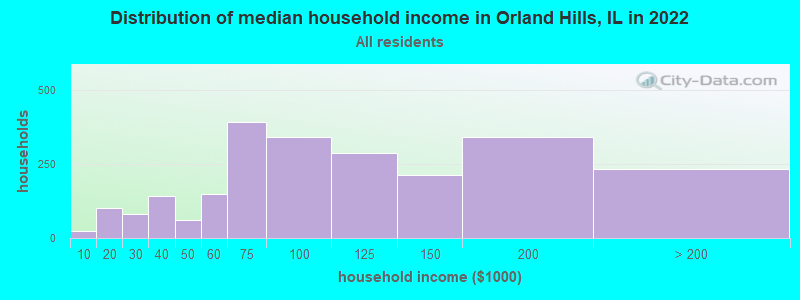
Orland Hills, IL household income distribution

- 25Less than $10,000
- 102$10,000 to $19,999
- 82$20,000 to $29,999
- 143$30,000 to $39,999
- 61$40,000 to $49,999
- 148$50,000 to $59,999
- 391$60,000 to $74,999
- 342$75,000 to $99,999
- 288$100,000 to $124,999
- 214$125,000 to $149,999
- 342$150,000 to $199,999
- 232$200,000 or more
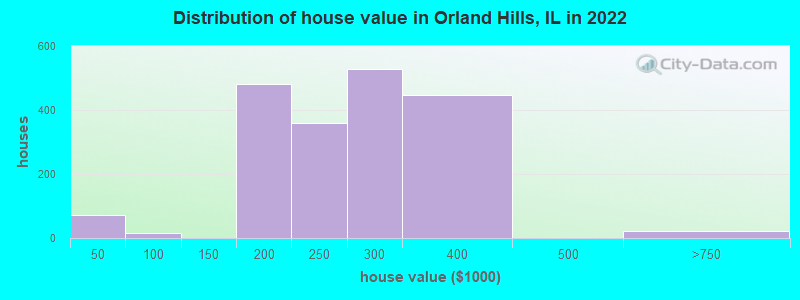
Home value of owner - occupied houses in 2022 in Orland Hills, IL
-
- 34Less than $10,000
- 14$15,000 to $19,999
- 23$25,000 to $29,999
- 14$70,000 to $79,999
- 187$150,000 to $174,999
- 293$175,000 to $199,999
- 358$200,000 to $249,999
- 527$250,000 to $299,999
- 446$300,000 to $399,999
- 23$500,000 to $749,999
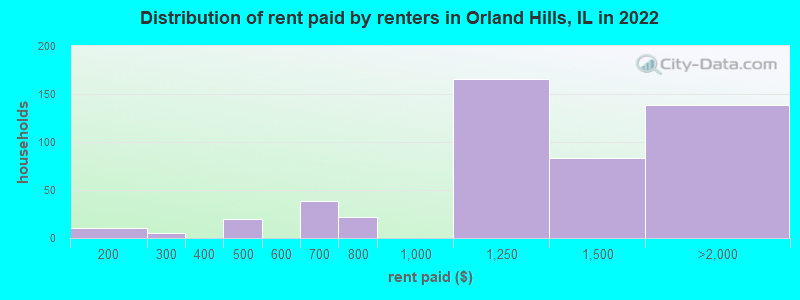
Rent paid by renters in 2022 in Orland Hills, IL
-
- 9$100 to $149
- 5$200 to $249
- 20$400 to $449
- 39$600 to $649
- 22$750 to $799
- 165$1,000 to $1,249
- 82$1,250 to $1,499
- 139$1,500 to $1,999
Percentage of workers working in this county: 82.7%
Number of people working at home: 599 (16.4% of all workers)
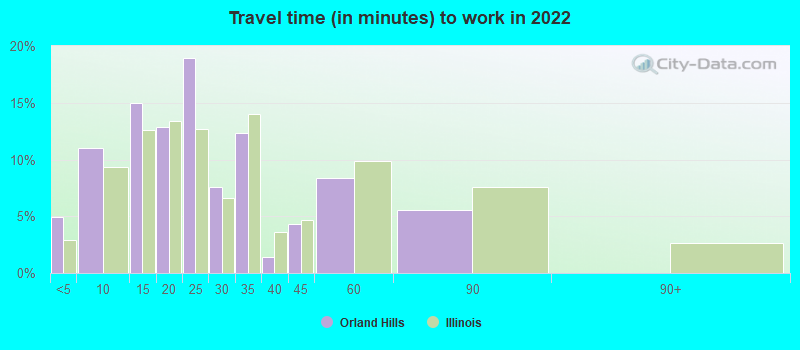
Travel time to work (commute)
- Less than 5 minutes: 188
- 5 to 9 minutes: 215
- 10 to 14 minutes: 322
- 15 to 19 minutes: 175
- 20 to 24 minutes: 368
- 25 to 29 minutes: 76
- 30 to 34 minutes: 463
- 35 to 39 minutes: 164
- 40 to 44 minutes: 86
- 45 to 59 minutes: 374
- 60 to 89 minutes: 491
- 90 or more minutes: 109
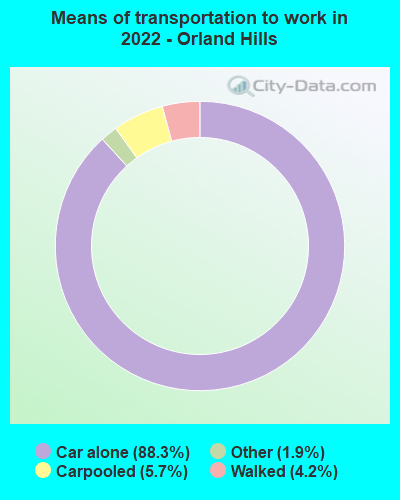
Means of transportation to work:
- Drove a car alone: 774 (57.5%)
- Carpooled: 53 (3.9%)
- Taxi: 16 (1.2%)
- Walked: 37 (2.8%)
- Worked at home: 599 (44.5%)
- Unemployment by race in 2022
- Unemployment rate for White non-Hispanic residents
- 3.5%Males
- 2.9%Females
- Unemployment rate for Black residents
- 8.1%Females
- Unemployment rate for Asian residents
- 19.9%Females
- Unemployment rate for two or more race residents
- 15.7%Females
- Unemployment rate for Hispanic or Latino residents
- 9.0%Females
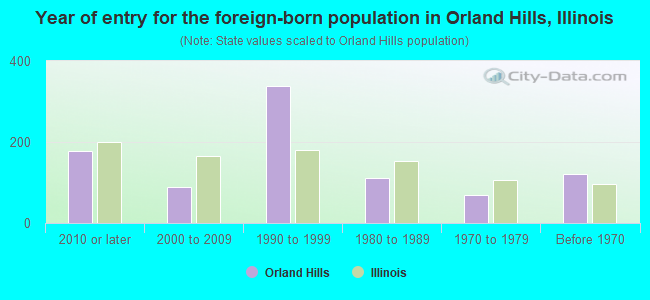
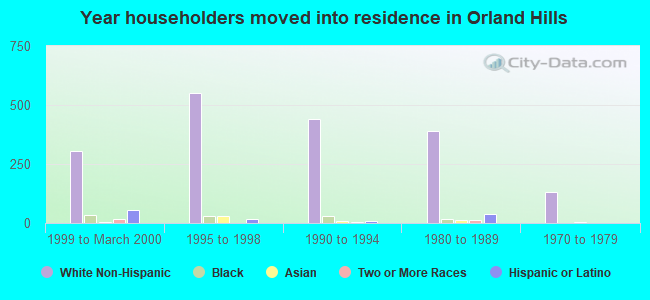
- Year of entry for the foreign-born population in Orland Hills, Illinois
- 1792010 or later
- 892000 to 2009
- 3381990 to 1999
- 1121980 to 1989
- 681970 to 1979
- 120Before 1970
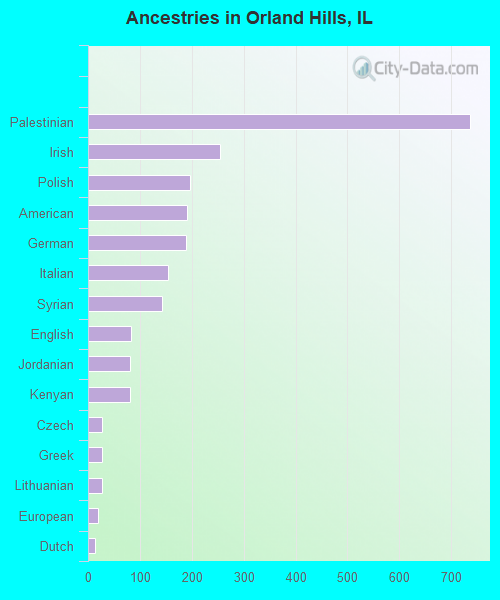
First ancestries reported:
- Palestinian: 736 (24.3%)
- Irish: 254 (8.4%)
- Polish: 197 (6.5%)
- American: 190 (6.3%)
- German: 189 (6.2%)
- Italian: 154 (5.1%)
- Syrian: 143 (4.7%)
- English: 82 (2.7%)
- Jordanian: 81 (2.7%)
- Kenyan: 80 (2.6%)
- Czech: 27 (0.9%)
- Greek: 27 (0.9%)
- Lithuanian: 27 (0.9%)
- European: 19 (0.6%)
- Dutch: 13 (0.4%)
Most common places of birth for foreign-born residents (%):
| Orland Hills: | 38.6% (426) |
| Illinois: | 0.4% (7,117) |
| Orland Hills: | 17.5% (193) |
| Illinois: | 34.7% (626,958) |
| Orland Hills: | 9.8% (108) |
| Illinois: | 0.5% (8,827) |
| Orland Hills: | 9.5% (105) |
| Illinois: | 0.1% (2,357) |
| Orland Hills: | 7.1% (79) |
| Illinois: | 0.2% (3,080) |
| Orland Hills: | 6.1% (67) |
| Illinois: | 5.2% (93,003) |
| Orland Hills: | 5.0% (55) |
| Illinois: | 0.9% (16,553) |
| Orland Hills: | 4.2% (46) |
| Illinois: | 0.4% (6,781) |
| Orland Hills: | 4.2% (46) |
| Illinois: | 9.2% (166,409) |
| Orland Hills: | 2.8% (31) |
| Illinois: | 0.6% (10,720) |
| Orland Hills: | 2.4% (27) |
| Illinois: | 0.5% (8,551) |
| Orland Hills: | 1.8% (20) |
| Illinois: | 0.1% (1,630) |
| Orland Hills: | 1.5% (17) |
| Illinois: | 0.6% (10,249) |
| Orland Hills: | 1.5% (17) |
| Illinois: | 0.4% (6,611) |
Place of birth for U.S.-born residents:
- This state: 5,203
- Other state: 342
- Northeast: 13
- Midwest: 146
- South: 146
- West: 34
89.5% of Orland Hills residents lived in the same house 1 years ago.
Out of people who lived in different houses, 20.6% lived in this county.
Out of people who lived in different counties, 68.8% lived in Illinois.
| Orland Hills: | 89.5% |
| State average: | 88.3% |
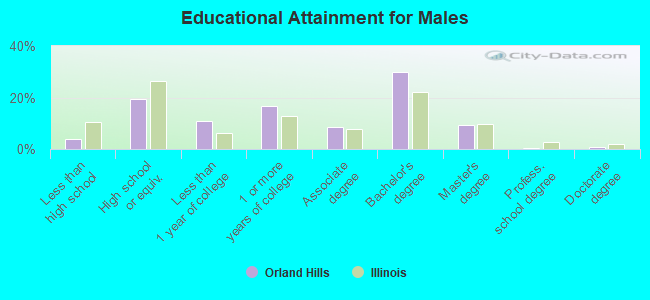
Education attainment for males 25 years and older:
- No schooling: 12
- Nursery to 4th grade: 0
- 5th and 6th grade: 0
- 7th and 8th grade: 0
- 9th grade: 0
- 10th grade: 78
- 11th grade: 0
- 12th grade, no diploma: 0
- High school graduate (or equivalency): 472
- Less than 1 year of college: 260
- Some college more than 1 year, no degree: 407
- Associate degree: 206
- Bachelor's degree: 725
- Master's degree: 228
- Professional school degree: 13
- Doctorate degree: 16
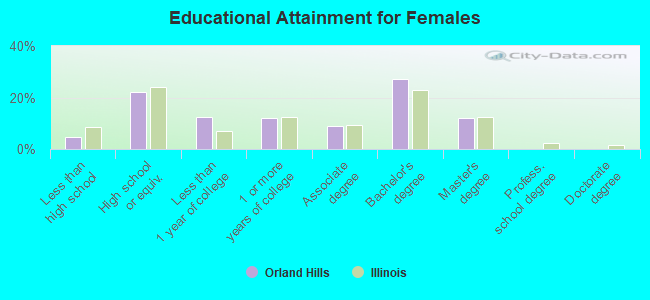
Education attainment for females 25 years and older:
- No schooling: 0
- Nursery to 4th grade: 0
- 5th and 6th grade: 15
- 7th and 8th grade: 23
- 9th grade: 0
- 10th grade: 7
- 11th grade: 28
- 12th grade, no diploma: 33
- High school graduate (or equivalency): 488
- Less than 1 year of college: 274
- Some college more than 1 year, no degree: 262
- Associate degree: 199
- Bachelor's degree: 593
- Master's degree: 264
- Professional school degree: 0
- Doctorate degree: 0
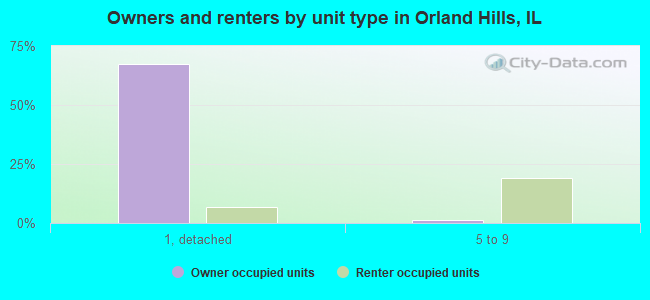
Housing units in structures:
- One, detached: 1,929
- One, attached: 46
- 3 or 4: 87
- 5 to 9: 378
- 10 to 19: 34
- 50 or more: 23
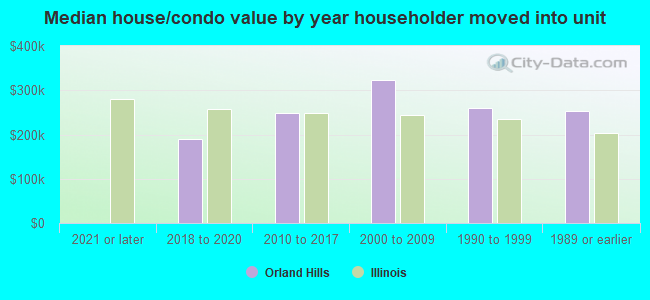
House/condo owner moved in on average 18 years ago
Renter moved in on average 1 years ago
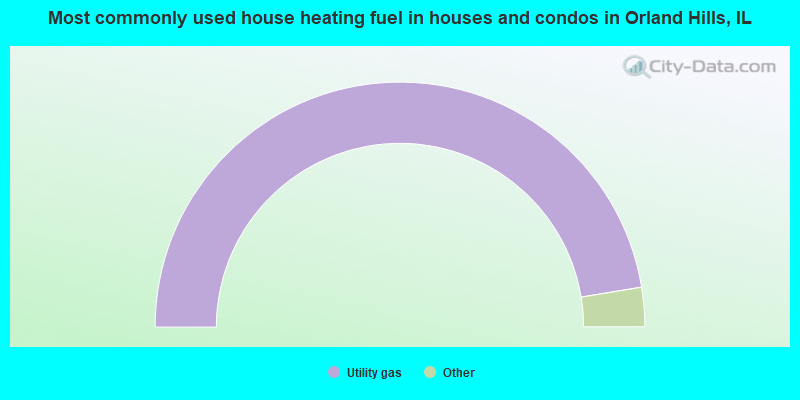
- 94.9%Utility gas
- 3.8%Electricity
- 1.3%Bottled, tank, or LP gas
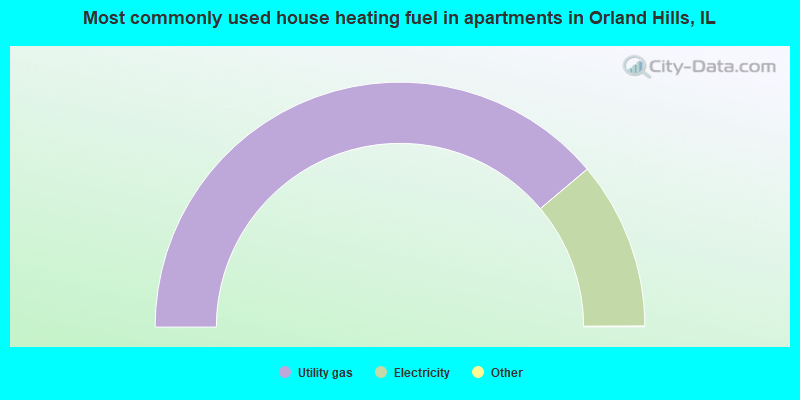
- 77.8%Utility gas
- 22.2%Electricity
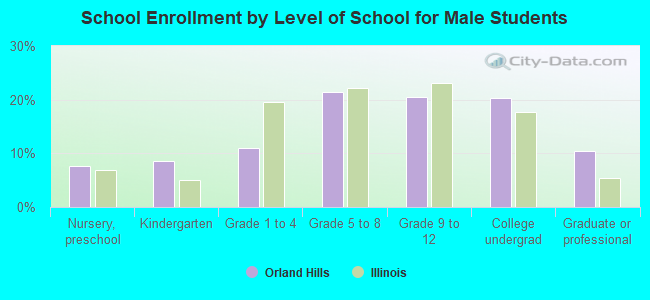
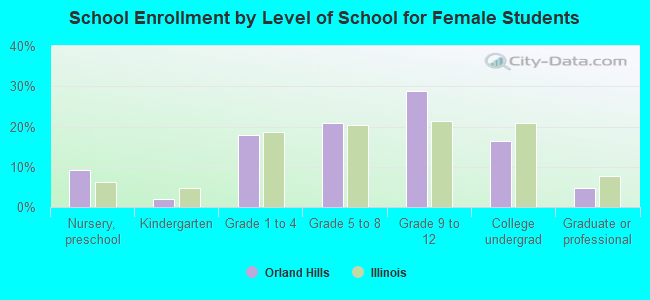
Private vs. public school enrollment:
| Here: | 0.0% |
| Illinois: | 13.3% |
| Here: | 0.0% |
| Illinois: | 9.9% |
| Here: | 30.1% |
| Illinois: | 27.4% |