Osceola Mills, PA (Pennsylvania) Houses and Residents
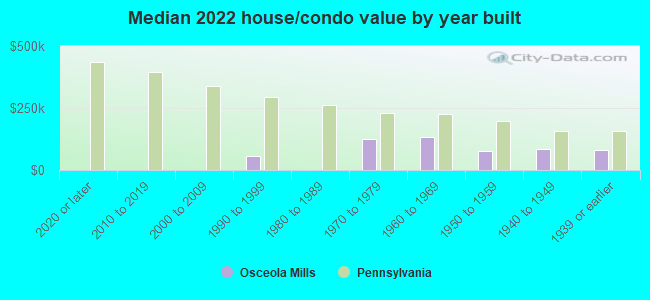
| Osceola Mills: | $97,113 |
| Pennsylvania: | $245,500 |
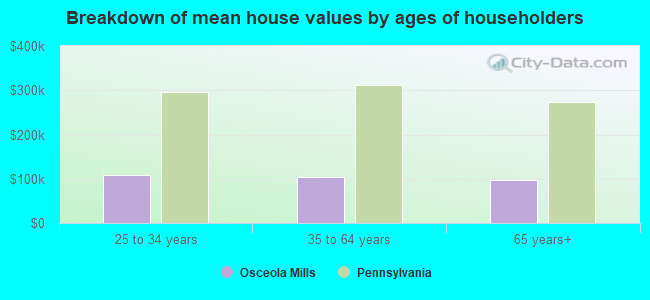
Mean price in 2022:
Detached houses: $113,731
Here: $113,731 State: $317,202 Mobile homes: $73,460
Here: $73,460 State: $92,414
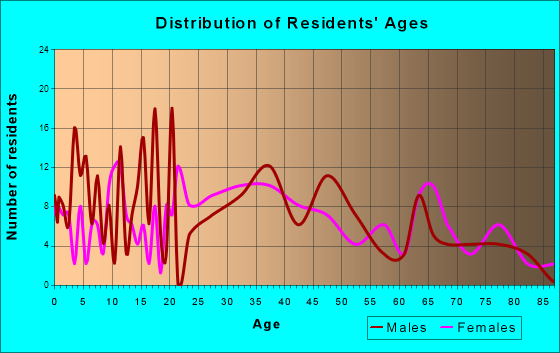
Total population: 1,112 (All urban)
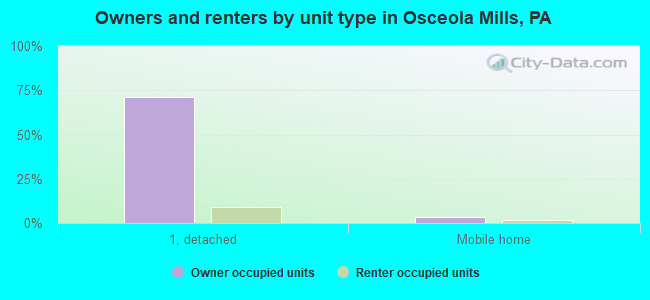
Houses: 570 (513 occupied: 476 owner occupied, 52 renter occupied)
| % of renters here: | 10% |
| State: | 31% |
Housing density: 1,697 houses/condos per square mile
Median price asked for vacant for-sale houses and condos in 2022: $369,827.
Median contract rent in 2022: $533 (lower quartile is $466, upper quartile is $522)
Median rent asked for vacant for-rent units in 2022: $450
Median gross rent in Osceola Mills, PA in 2022: $768
Housing units in Osceola Mills with a mortgage: 248 (7 second mortgage, 0 home equity loan, 8 both second mortgage and home equity loan)
Houses without a mortgage: 3
Median household income for houses/condos with a mortgage: $109,568
Median household income for apartments without a mortgage: $39,821
Median monthly housing costs: $780
Compare current foreclosures near Osceola Mills, PA:
| Photo | Address | Area | Beds / Baths | Price | Details |
|---|---|---|---|---|---|

|
#1
Curtin St
Osceola Mills, PA 16666
|
- sq. feet
|
- baths - beds |
show details | |

|
#2
Main St
Madera, PA 16661
|
- sq. feet
|
1 baths 3 beds |
show details | |

|
#3
Sawmill Rd
Port Matilda, PA 16870
|
1,392 sq. feet
|
1 baths 3 beds |
show details | |

|
#4
Woodland Rd
Clearfield, PA 16830
|
769 sq. feet
|
2 baths 1 beds |
show details | |

|
#5
David St
Houtzdale, PA 16651
|
- sq. feet
|
1 baths 3 beds |
show details | |

|
#6
Main St
Smithmill, PA 16680
|
- sq. feet
|
- baths - beds |
$29,900
|
show details |

|
#7
S Eagle Valley Rd
Tyrone, PA 16686
|
1,540 sq. feet
|
1 baths 3 beds |
show details | |

|
#8
Allegheny St
Curwensville, PA 16833
|
- sq. feet
|
1 baths 3 beds |
show details | |

|
#9
Skytop Mountain Rd
Port Matilda, PA 16870
|
2,880 sq. feet
|
3 baths 5 beds |
show details | |

|
#10
Donna Cir
Port Matilda, PA 16870
|
1,828 sq. feet
|
2 baths 3 beds |
show details |
| Photo | Address | Area | Beds / Baths | Price | Details |
|---|---|---|---|---|---|

|
#11
Woodpecker
Port Matilda, PA 16870
|
2,544 sq. feet
|
2 baths 4 beds |
show details | |

|
#12
N 11th St
Philipsburg, PA 16866
|
999 sq. feet
|
1 baths 3 beds |
show details | |

|
#13
Mease Rd
Houtzdale, PA 16651
|
- sq. feet
|
- baths - beds |
show details | |

|
#14
S High St # 2
Port Matilda, PA 16870
|
- sq. feet
|
- baths - beds |
show details | |

|
#15
Beech Creek Ave
Curwensville, PA 16833
|
- sq. feet
|
- baths - beds |
show details | |

|
#16
Filbert St
Curwensville, PA 16833
|
- sq. feet
|
- baths - beds |
show details | |

|
#17
Haupt Rd
Irvona, PA 16656
|
- sq. feet
|
- baths - beds |
show details | |

|
#18
W 5th Ave
Clearfield, PA 16830
|
- sq. feet
|
- baths - beds |
show details | |

|
#19
N 9th St Apt B
Philipsburg, PA 16866
|
- sq. feet
|
- baths - beds |
show details | |

|
#20
S 4th St
Clearfield, PA 16830
|
- sq. feet
|
- baths - beds |
show details |
| Photo | Address | Area | Beds / Baths | Price | Details |
|---|---|---|---|---|---|

|
#21
N Front St Apt 1
Philipsburg, PA 16866
|
- sq. feet
|
- baths - beds |
show details | |

|
#22
Rolley Rd
Olanta, PA 16863
|
- sq. feet
|
- baths - beds |
show details | |

|
#23
S Eagle Valley Rd
Tyrone, PA 16686
|
- sq. feet
|
- baths - beds |
show details | |

|
#24
Forest Rd
Morrisdale, PA 16858
|
- sq. feet
|
- baths - beds |
show details | |

|
#25
Power Rd
Morrisdale, PA 16858
|
- sq. feet
|
- baths - beds |
show details | |

|
#26
Morgan Run Rd
West Decatur, PA 16878
|
- sq. feet
|
- baths - beds |
show details | |

|
#27
Morgan Run Rd
West Decatur, PA 16878
|
- sq. feet
|
- baths - beds |
show details | |

|
#28
Village Dr # 205
Houtzdale, PA 16651
|
- sq. feet
|
- baths - beds |
show details | |

|
#29
Parks Rd
Irvona, PA 16656
|
- sq. feet
|
- baths - beds |
show details | |

|
#30
W 6th Ave
Clearfield, PA 16830
|
- sq. feet
|
- baths - beds |
show details |
| Photo | Address | Area | Beds / Baths | Price | Details |
|---|---|---|---|---|---|

|
#31
Bowers St
Clearfield, PA 16830
|
- sq. feet
|
- baths - beds |
show details | |

|
#32
Bald Hill Rd
Frenchville, PA 16836
|
- sq. feet
|
- baths - beds |
show details | |

|
#33
Shardan Ave
Curwensville, PA 16833
|
- sq. feet
|
- baths - beds |
show details | |

|
#34
W 21st St
Tyrone, PA 16686
|
- sq. feet
|
- baths - beds |
show details | |

|
#35
Old Turnpike Rd
Allport, PA 16821
|
- sq. feet
|
- baths - beds |
show details | |

|
#36
Chevy Ln
Clearfield, PA 16830
|
- sq. feet
|
- baths - beds |
show details | |

|
#37
Old Route 322
Philipsburg, PA 16866
|
- sq. feet
|
- baths - beds |
show details | |

|
#38
Chevy Ln
Clearfield, PA 16830
|
- sq. feet
|
- baths - beds |
show details | |

|
#39
2nd St
Flinton, PA 16640
|
- sq. feet
|
- baths - beds |
show details | |

|
#40
Irvona Rd
Irvona, PA 16656
|
- sq. feet
|
- baths - beds |
show details |
| Photo | Address | Area | Beds / Baths | Price | Details |
|---|---|---|---|---|---|

|
#41
Emigh Run Rd
Morrisdale, PA 16858
|
- sq. feet
|
- baths - beds |
show details | |

|
#42
Nichols St # 1
Clearfield, PA 16830
|
- sq. feet
|
- baths - beds |
show details | |

|
#43
Daisy St
Clearfield, PA 16830
|
- sq. feet
|
- baths - beds |
show details | |

|
#44
W 5th Ave
Clearfield, PA 16830
|
- sq. feet
|
- baths - beds |
show details | |

|
#45
Columbia Ave
Tyrone, PA 16686
|
- sq. feet
|
- baths - beds |
show details | |

|
#46
Spring St
Houtzdale, PA 16651
|
- sq. feet
|
- baths - beds |
show details | |

|
#47
E 6th St
Clearfield, PA 16830
|
- sq. feet
|
- baths - beds |
show details | |

|
#48
Village Rd
Clearfield, PA 16830
|
- sq. feet
|
- baths - beds |
show details | |

|
#49
W 1st Ave
Clearfield, PA 16830
|
- sq. feet
|
- baths - beds |
show details | |

|
Check over 1 million property listings on Foreclosure.com!
|
browse all offers | |||


 | Best little towns in Central PA? (State College/Du Bois, Clearfield County, etc. areas) (28 replies) |
Median year apartment built: 1946
Household type by relationship:
Households: 1,149- Male householders: 213 (72 living alone), Female householders: 288 (58 living alone)
177 spouses (169 opposite-sex spouses), 38 unmarried partners, (38 opposite-sex unmarried partners), 369 children (358 natural, 0 adopted, 10 stepchildren), 21 grandchildren, 5 brothers or sisters, 2 parents, 0 foster children, 20 other relatives, 11 non-relatives
Size of family households: 211 2-persons, 38 3-persons, 113 4-persons, 13 5-persons, 2 6-persons.
Size of nonfamily households: 141 1-person, 8 2-persons, 1 4-persons.
121 married couples with children.
62 single-parent households (37 men, 25 women).
94.7% of residents of Osceola Mills speak English at home.
4.2% of residents speak Spanish at home (100% speak English very well).
0.3% of residents speak other Indo-European language at home (100% speak English well).
Foreign born population: 19 (1.7%)
(26.3% of them are naturalized citizens)
| Here: | 6.4 |
| State: | 6.8 |
| Here: | 5.1 |
| State: | 4.3 |
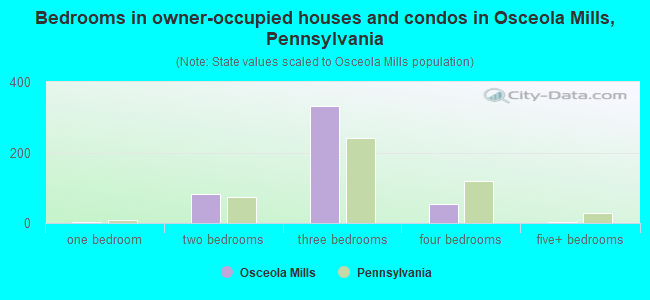
- Bedrooms in owner-occupied houses and condos in Osceola Mills, Pennsylvania
- 0no bedroom
- 31 bedroom
- 832 bedrooms
- 3323 bedrooms
- 544 bedrooms
- 45+ bedrooms
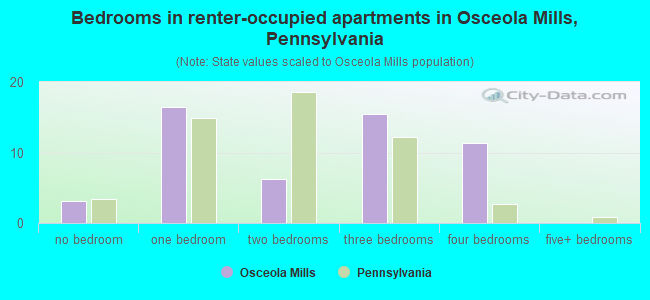
- Bedrooms in renter-occupied apartments in Osceola Mills, Pennsylvania
- 3no bedroom
- 161 bedroom
- 62 bedrooms
- 153 bedrooms
- 114 bedrooms
- 05+ bedrooms
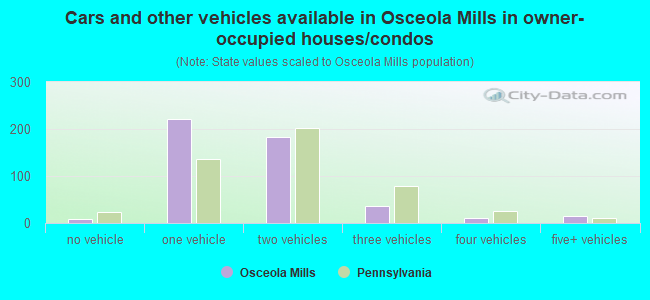
- Cars and other vehicles available in Osceola Mills in owner-occupied houses/condos
- 8no vehicle
- 2221 vehicle
- 1842 vehicles
- 373 vehicles
- 104 vehicles
- 145+ vehicles
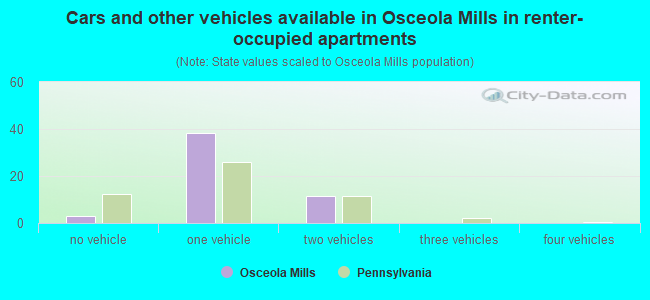
- Cars and other vehicles available in Osceola Mills in renter-occupied apartments
- 3no vehicle
- 381 vehicle
- 112 vehicles
- 03 vehicles
- 04 vehicles
- 05+ vehicles
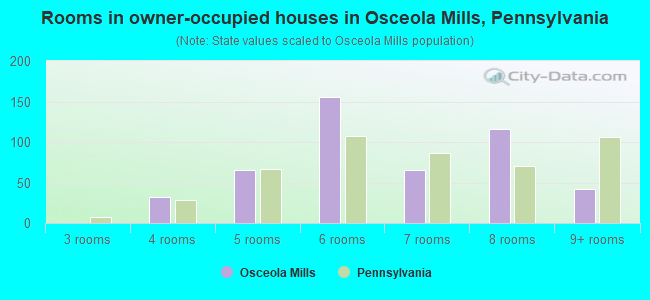
- Rooms in owner-occupied houses in Osceola Mills, Pennsylvania
- 01 room
- 02 rooms
- 03 rooms
- 324 rooms
- 655 rooms
- 1556 rooms
- 667 rooms
- 1168 rooms
- 429+ rooms
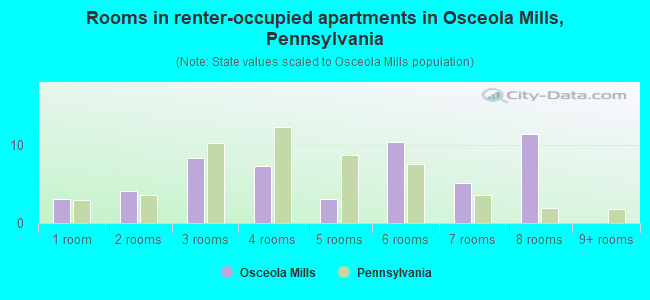
- Rooms in renter-occupied apartments in Osceola Mills, Pennsylvania
- 31 room
- 42 rooms
- 83 rooms
- 74 rooms
- 35 rooms
- 106 rooms
- 57 rooms
- 118 rooms
- 09+ rooms
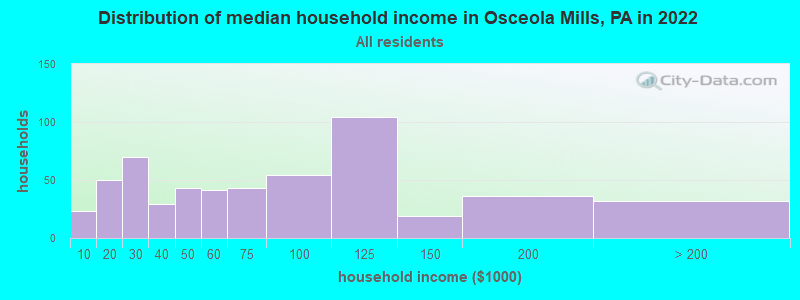
Osceola Mills, PA household income distribution

- 23Less than $10,000
- 50$10,000 to $19,999
- 70$20,000 to $29,999
- 29$30,000 to $39,999
- 43$40,000 to $49,999
- 41$50,000 to $59,999
- 43$60,000 to $74,999
- 54$75,000 to $99,999
- 104$100,000 to $124,999
- 19$125,000 to $149,999
- 36$150,000 to $199,999
- 32$200,000 or more
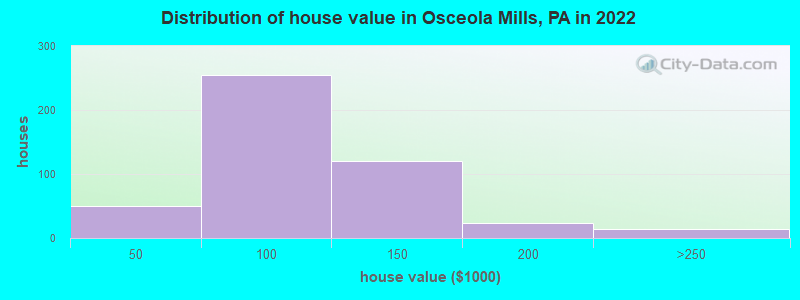
Home value of owner - occupied houses in 2022 in Osceola Mills, PA
-
- 1Less than $10,000
- 7$15,000 to $19,999
- 8$20,000 to $24,999
- 3$25,000 to $29,999
- 4$30,000 to $34,999
- 4$35,000 to $39,999
- 20$40,000 to $49,999
- 16$50,000 to $59,999
- 13$60,000 to $69,999
- 96$70,000 to $79,999
- 55$80,000 to $89,999
- 52$90,000 to $99,999
- 53$100,000 to $124,999
- 68$125,000 to $149,999
- 14$150,000 to $174,999
- 9$175,000 to $199,999
- 11$200,000 to $249,999
- 3$250,000 to $299,999
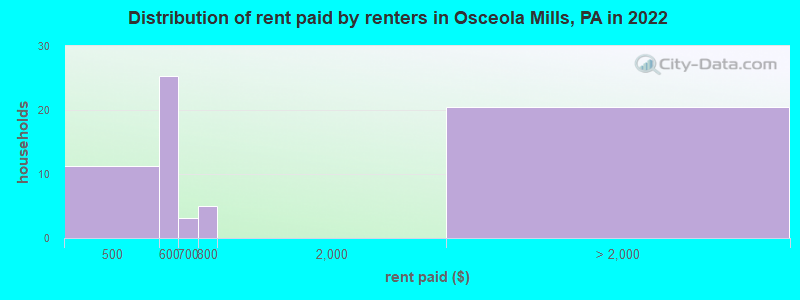
Rent paid by renters in 2022 in Osceola Mills, PA
-
- 8$400 to $449
- 2$450 to $499
- 6$500 to $549
- 18$550 to $599
- 3$600 to $649
- 5$750 to $799
- 20No cash rent
Percentage of workers working in this county: 33.9%
Number of people working at home: 6 (1.2% of all workers)
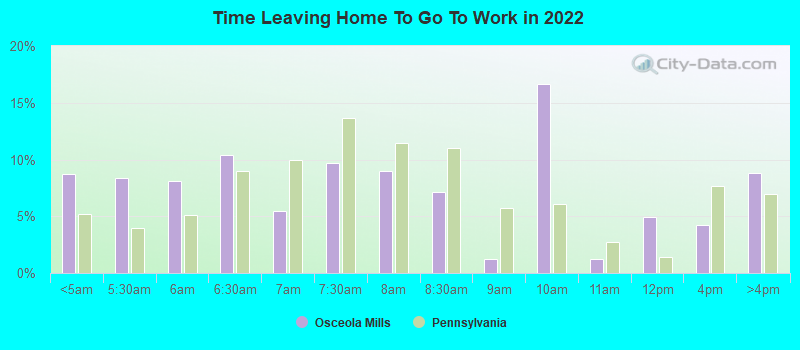
Travel time to work (commute)
- Less than 5 minutes: 55
- 5 to 9 minutes: 25
- 10 to 14 minutes: 94
- 15 to 19 minutes: 28
- 20 to 24 minutes: 5
- 25 to 29 minutes: 8
- 30 to 34 minutes: 60
- 35 to 39 minutes: 33
- 40 to 44 minutes: 21
- 45 to 59 minutes: 92
- 60 to 89 minutes: 11
- 90 or more minutes: 27
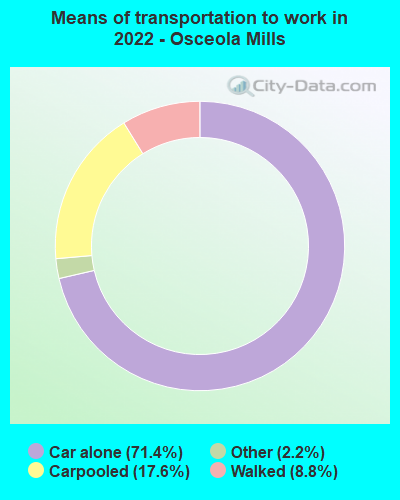
Means of transportation to work:
- Drove a car alone: 154 (63.6%)
- Carpooled: 37 (15.3%)
- Taxi: 6 (2.5%)
- Walked: 18 (7.4%)
- Worked at home: 24 (9.9%)
- Unemployment by race in 2022
- Unemployment rate for White non-Hispanic residents
- 9.4%Males
- 2.3%Females
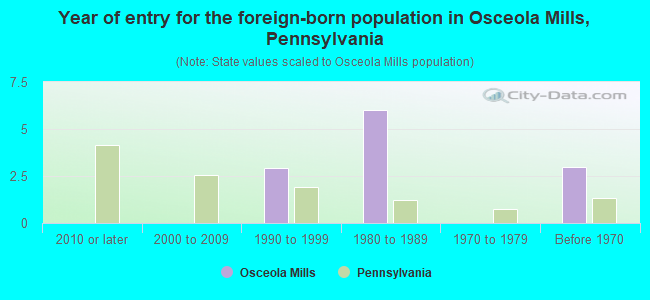
- Year of entry for the foreign-born population in Osceola Mills, Pennsylvania
- 02010 or later
- 02000 to 2009
- 31990 to 1999
- 61980 to 1989
- 01970 to 1979
- 3Before 1970
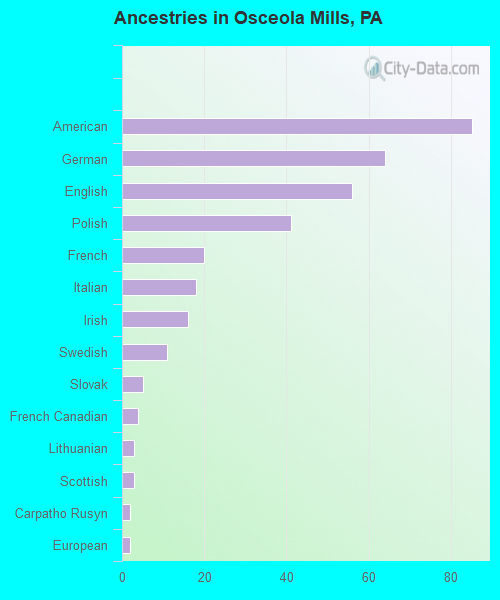
First ancestries reported:
- American: 85 (20.2%)
- German: 64 (15.2%)
- English: 56 (13.3%)
- Polish: 41 (9.7%)
- French: 20 (4.7%)
- Italian: 18 (4.3%)
- Irish: 16 (3.8%)
- Swedish: 11 (2.6%)
- Slovak: 5 (1.2%)
- French Canadian: 4 (0.9%)
- Lithuanian: 3 (0.7%)
- Scottish: 3 (0.7%)
- Carpatho Rusyn: 2 (0.5%)
- European: 2 (0.5%)
Most common places of birth for foreign-born residents (%):
| Osceola Mills: | 80.6% (25) |
| Pennsylvania: | 1.4% (13,268) |
| Osceola Mills: | 6.5% (2) |
| Pennsylvania: | 1.3% (12,172) |
Place of birth for U.S.-born residents:
- This state: 1,029
- Other state: 102
- Northeast: 38
- Midwest: 8
- South: 52
- West: 4
89.3% of Osceola Mills residents lived in the same house 1 years ago.
Out of people who lived in different houses, 30.9% lived in this county.
Out of people who lived in different counties, 94.2% lived in Pennsylvania.
| Osceola Mills: | 89.3% |
| State average: | 89.3% |
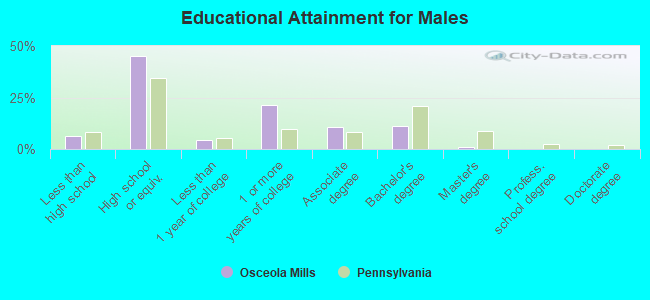
Education attainment for males 25 years and older:
- No schooling: 0
- Nursery to 4th grade: 0
- 5th and 6th grade: 0
- 7th and 8th grade: 7
- 9th grade: 5
- 10th grade: 6
- 11th grade: 0
- 12th grade, no diploma: 6
- High school graduate (or equivalency): 178
- Less than 1 year of college: 18
- Some college more than 1 year, no degree: 84
- Associate degree: 42
- Bachelor's degree: 44
- Master's degree: 4
- Professional school degree: 0
- Doctorate degree: 0
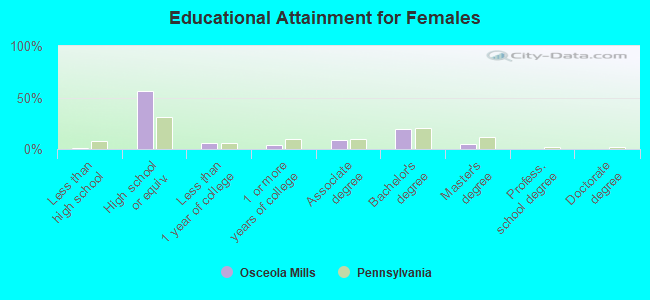
Education attainment for females 25 years and older:
- No schooling: 0
- Nursery to 4th grade: 0
- 5th and 6th grade: 0
- 7th and 8th grade: 1
- 9th grade: 0
- 10th grade: 0
- 11th grade: 0
- 12th grade, no diploma: 3
- High school graduate (or equivalency): 269
- Less than 1 year of college: 26
- Some college more than 1 year, no degree: 19
- Associate degree: 42
- Bachelor's degree: 94
- Master's degree: 22
- Professional school degree: 0
- Doctorate degree: 0
Housing units in structures:
- One, detached: 473
- One, attached: 38
- Two: 2
- 3 or 4: 29
- 5 to 9: 7
- 10 to 19: 4
- Mobile homes: 17
Housing units lacking complete kitchen facilities in 2022: 1.4%
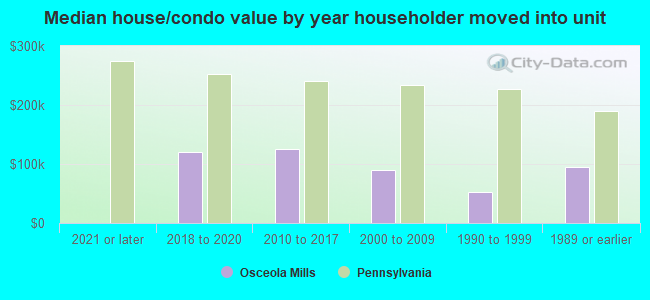
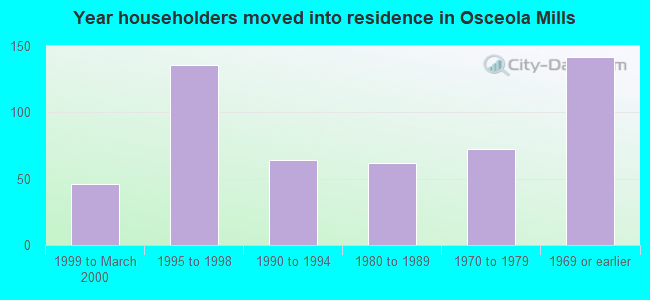
House/condo owner moved in on average 17 years ago
Renter moved in on average 10 years ago
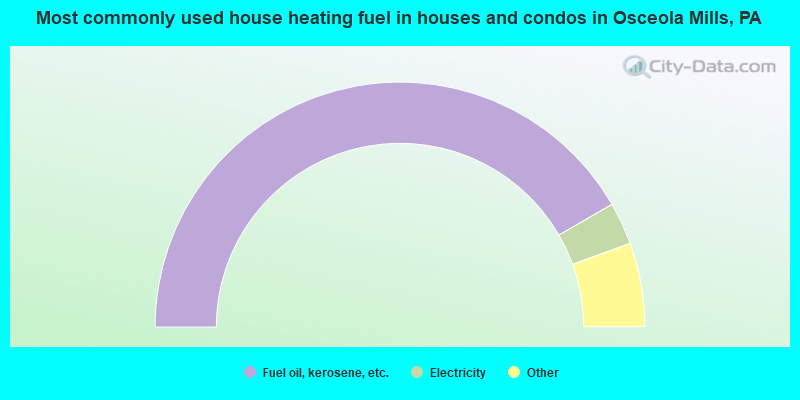
- 83.5%Fuel oil, kerosene, etc.
- 5.6%Electricity
- 3.9%Coal or coke
- 2.6%Bottled, tank, or LP gas
- 2.2%Utility gas
- 1.5%Wood
- 0.6%Other fuel
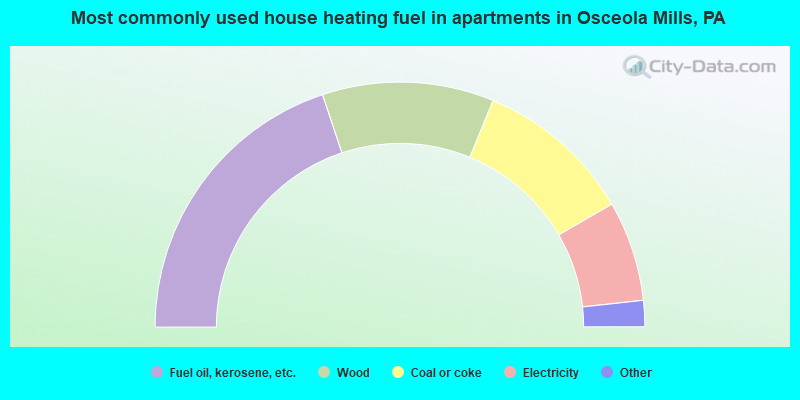
- 41.2%Fuel oil, kerosene, etc.
- 23.5%Wood
- 21.6%Coal or coke
- 13.7%Electricity
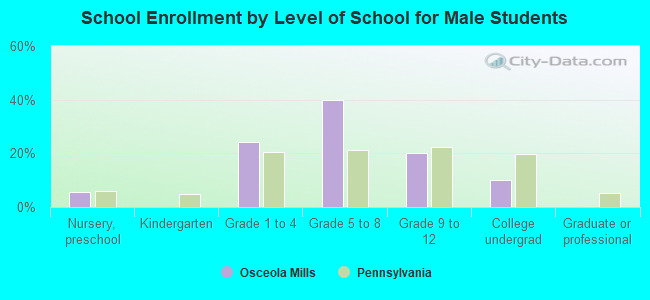
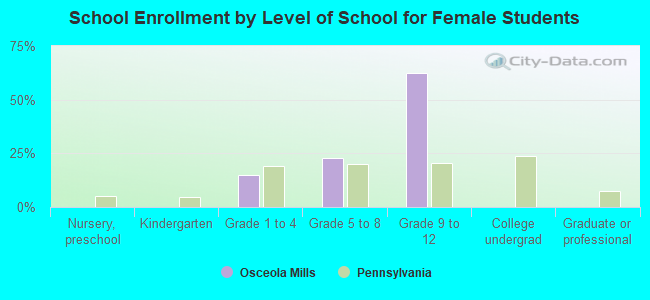
Private vs. public school enrollment:
| Here: | 2.8% |
| Pennsylvania: | 15.7% |
| Here: | 36.8% |
| Pennsylvania: | 13.4% |
| Here: | 0.0% |
| Pennsylvania: | 39.8% |