Palm City, FL (Florida) Houses and Residents
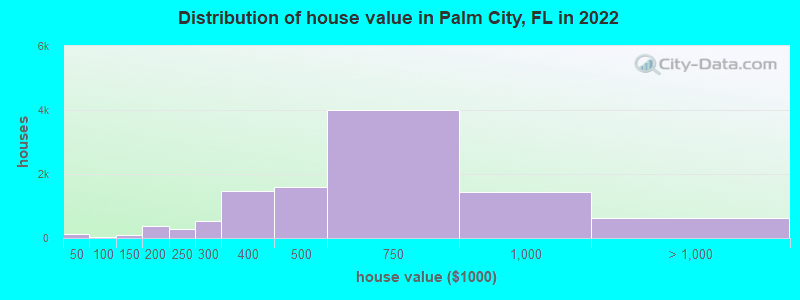
Estimated median house or condo value in 2022: $598,303 (it was $168,300 in 2000 )
Palm City:
$598,303Florida:
$354,100
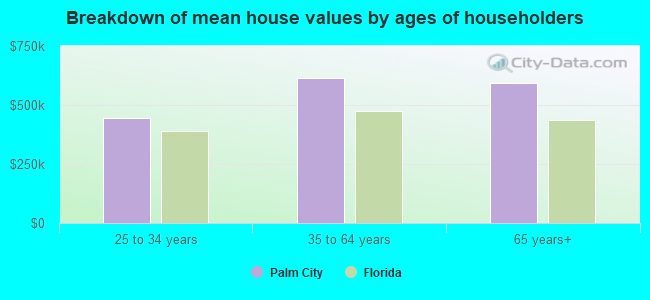
Lower value quartile - upper value quartile: $439,919 - $800,914Mean price in 2022: Detached houses: $652,817 Here:
$652,817State:
$500,941
Townhouses or other attached units: $309,030 Here:
$309,030State:
$370,869
In 2-unit structures: $399,347 Here:
$399,347State:
$423,188
In 3-to-4-unit structures: $260,956 Here:
$260,956State:
$309,944
In 5-or-more-unit structures: $338,051 Here:
$338,051State:
$447,145
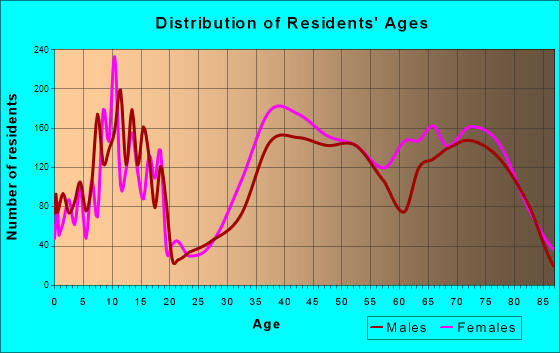
Total population: 23,120 (Urban population: 19,859, Rural population: 251 (all nonfarm) )
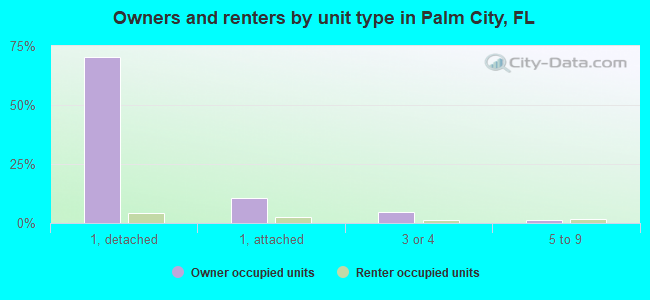
Houses: 11,767 (10,456 occupied: 9,027 owner occupied, 1,283 renter occupied )
% of renters here:
12%State:
33%
Housing density: 804 houses/condos per square mile
Median price asked for vacant for-sale houses and condos in 2022: $851,479.
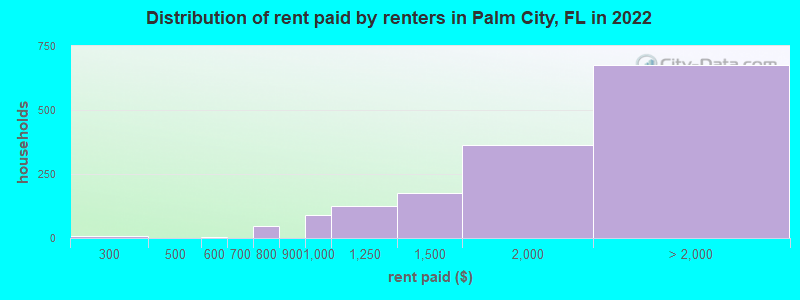
Median contract rent in 2022: over $2,000 (lower quartile is $1,450, upper quartile is over $2,000)
Median rent asked for vacant for-rent units in 2022: $2,646
Median gross rent in Palm City, FL in 2022: over $2,000
Housing units in Palm City with a mortgage: 5,586 (607 second mortgage, 0 home equity loan, 584 both second mortgage and home equity loan )Houses without a mortgage: 75
Median household income for houses/condos with a mortgage: $130,359
Median household income for apartments without a mortgage: $91,646
Median monthly housing costs: $1,701
Data:
Median house or condo value ($)
Median house or condo value ($ change since 2000)
Median house or condo value ($) - White
Median house or condo value ($) - Black or African American
Median house or condo value ($) - Asian
Median house or condo value ($) - Hispanic or Latino
Median house or condo value ($) - American Indian and Alaska Native
Median house or condo value ($) - Multirace
Median house or condo value ($) - Other Race
Median price asked for mobile homes ($)
Household density (households per square mile)
Mean house or condo value by units in structure - 1, detached ($)
Mean house or condo value by units in structure - 1, attached ($)
Mean house or condo value by units in structure - 2 ($)
Mean house or condo value by units in structure by units in structure - 3 or 4 ($)
Mean house or condo value by units in structure - 5 or more ($)
Mean house or condo value by units in structure - Boat, RV, van, etc. ($)
Mean house or condo value by units in structure - Mobile home ($)
Median contract rent ($)
Median contract rent - Lower quartile ($)
Median contract rent - Upper quartile ($)
Median gross rent ($)
Urban houses (%)
Rural houses (%)
Houses occupied (%)
Houses occupied (% change since 2000)
Houses owner occupied (%)
Houses owner occupied (% change since 2000)
Houses renter occupied (%)
Houses renter occupied (% change since 2000)
Vacant housing units - For rent (%)
Vacant housing units - For rent (% change since 2000)
Vacant housing units - For sale only (%)
Vacant housing units - For sale only (% change since 2000)
Vacant housing units - Rented or sold, not occupied (%)
Vacant housing units - Rented or sold, not occupied (% change since 2000)
Vacant housing units - For seasonal, recreational, or occasional use (%)
Vacant housing units - For seasonal, recreational, or occasional use (% change since 2000)
Vacant housing units - For migrant workers (%)
Vacant housing units - For migrant workers (% change since 2000)
Vacant housing units - Other vacant (%)
Vacant housing units - Other vacant (% change since 2000)
Median monthly housing costs ($)
Median household income for houses/condos with a mortgage ($)
Median household income for houses/condos without a mortgage ($)
Median household income ($)
Median household income ($) - White
Median household income ($) - Black or African American
Median household income ($) - Asian
Median household income ($) - Hispanic or Latino
Median household income ($) - American Indian and Alaska Native
Median household income ($) - Multirace
Median household income ($) - Other Race
Mortgage status - with mortgage (%)
Mortgage status - with second mortgage (%)
Mortgage status - with home equity loan (%)
Mortgage status - with both second mortgage and home equity loan (%)
Mortgage status - without a mortgage (%)
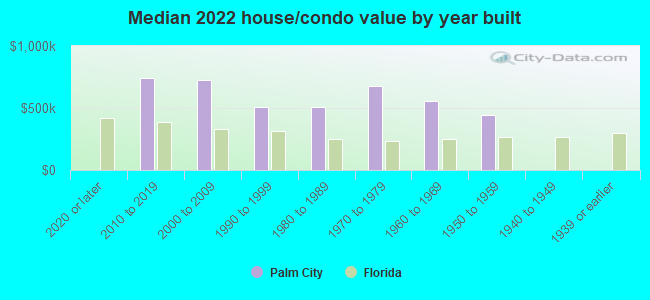
Median year house/condo built
Median year apartment built
Household type by relationship - Male householder living alone (%)
Household type by relationship - Male householder not living alone (%)
Household type by relationship - Female householder living alone (%)
Household type by relationship - Female householder not living alone (%)
Household type by relationship - Opposite-Sex spouse (%)
Household type by relationship - Same-Sex spouse (%)
Household type by relationship - Opposite-Sex unmarried partner (%)
Household type by relationship - Same-Sex unmarried partner (%)
Household type by relationship - In group quarters (%)
Size of family households - 2-person household (%)
Size of family households - 3-person household (%)
Size of family households - 4-person household (%)
Size of family households - 5-person household (%)
Size of family households - 6-person household (%)
Size of family households - 7-or-more-person household (%)
Size of nonfamily households - 1-person household (%)
Size of nonfamily households - 2-person household (%)
Size of nonfamily households - 3-person household (%)
Size of nonfamily households - 4-person household (%)
Size of nonfamily households - 5-person household (%)
Size of nonfamily households - 6-person household (%)
Size of nonfamily households - 7-or-moreperson household (%)
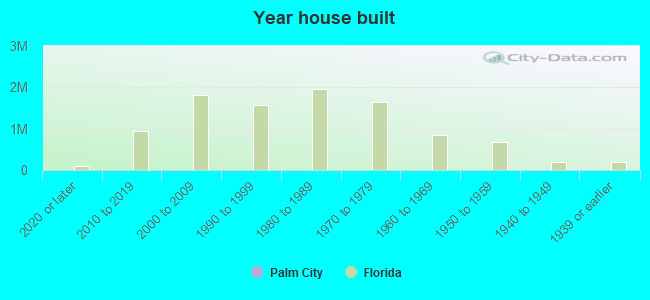
Year house built - Built 2010 or later (%)
Year house built - Built 2000 to 2009 (%)
Year house built - Built 1990 to 1999 (%)
Year house built - Built 1980 to 1989 (%)
Year house built - Built 1970 to 1979 (%)
Year house built - Built 1960 to 1969 (%)
Year house built - Built 1950 to 1959 (%)
Year house built - Built 1940 to 1949 (%)
Year house built - Built 1939 or earlier (%)
Median number of rooms in houses and condos
Median number of rooms in apartments
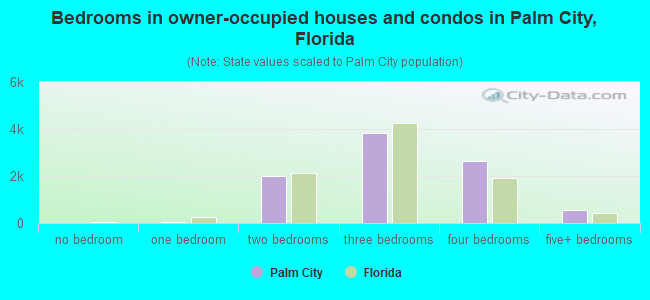
Median number of bedrooms in owner occupied houses
Mean number of bedrooms in owner occupied houses
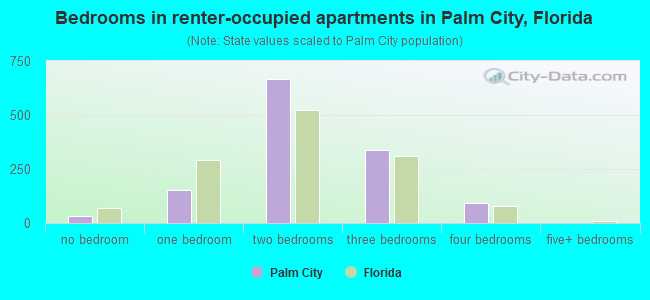
Median number of bedrooms in renter occupied houses
Mean number of bedrooms in renter occupied houses
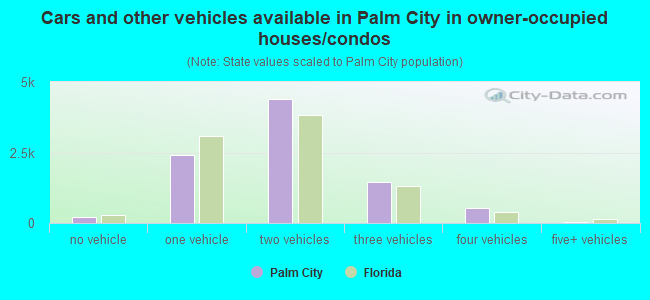
Median number of vehichles in owner occupied houses
Mean number of vehichles in owner occupied houses
Median number of vehichles in renter occupied houses
Mean number of vehichles in renter occupied houses
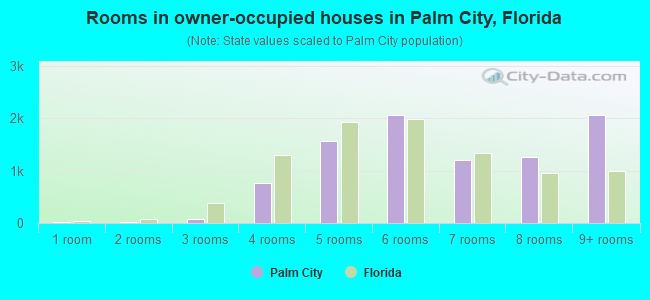
Rooms in owner-occupied houses - 1 room (%)
Rooms in owner-occupied houses - 2 rooms (%)
Rooms in owner-occupied houses - 3 rooms (%)
Rooms in owner-occupied houses - 4 rooms (%)
Rooms in owner-occupied houses - 5 rooms (%)
Rooms in owner-occupied houses - 6 rooms (%)
Rooms in owner-occupied houses - 7 rooms (%)
Rooms in owner-occupied houses - 8 rooms (%)
Rooms in owner-occupied houses - 9+ rooms (%)
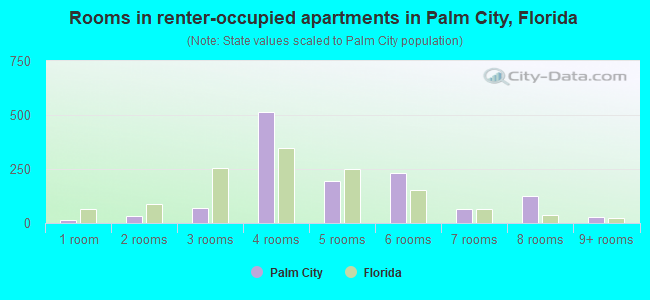
Rooms in renter-occupied houses - 1 room (%)
Rooms in renter-occupied houses - 2 rooms (%)
Rooms in renter-occupied houses - 3 rooms (%)
Rooms in renter-occupied houses - 4 rooms (%)
Rooms in renter-occupied houses - 5 rooms (%)
Rooms in renter-occupied houses - 6 rooms (%)
Rooms in renter-occupied houses - 7 rooms (%)
Rooms in renter-occupied houses - 8 rooms (%)
Rooms in renter-occupied houses - 9+ rooms (%)
Bedrooms in owner-occupied houses - no bedrooms (%)
Bedrooms in owner-occupied houses - 1 bedroom (%)
Bedrooms in owner-occupied houses - 2 bedrooms (%)
Bedrooms in owner-occupied houses - 3 bedrooms (%)
Bedrooms in owner-occupied houses - 4 bedrooms (%)
Bedrooms in owner-occupied houses - 5+ bedrooms (%)
Bedrooms in renter-occupied houses - no bedrooms (%)
Bedrooms in renter-occupied houses - 1 bedroom (%)
Bedrooms in renter-occupied houses - 2 bedrooms (%)
Bedrooms in renter-occupied houses - 3 bedrooms (%)
Bedrooms in renter-occupied houses - 4 bedrooms (%)
Bedrooms in renter-occupied houses - 5+ bedrooms (%)
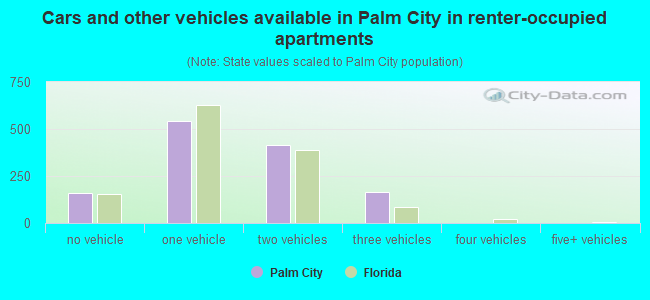
Vehicles available in owner-occupied houses - no vehicle available (%)
Vehicles available in owner-occupied houses - 1 vehicle available(%)
Vehicles available in owner-occupied houses - 2 Vehicles available (%)
Vehicles available in owner-occupied houses - 3 Vehicles available (%)
Vehicles available in owner-occupied houses - 4 Vehicles available (%)
Vehicles available in owner-occupied houses - 5+ Vehicles available (%)
Vehicles available in renter-occupied houses - no vehicle available (%)
Vehicles available in renter-occupied houses - 1 vehicle available (%)
Vehicles available in renter-occupied houses - 2 Vehicles available (%)
Vehicles available in renter-occupied houses - 3 Vehicles available (%)
Vehicles available in renter-occupied houses - 4 Vehicles available (%)
Vehicles available in renter-occupied houses - 5+ Vehicles available (%)
Housing units in structures - 1, detached (%)
Housing units in structures - 1, attached (%)
Housing units in structures - 2 (%)
Housing units in structures - 3 or 4 (%)
Housing units in structures - 5 to 9 (%)
Housing units in structures - 10 to 19 (%)
Housing units in structures - 20 to 49 (%)
Housing units in structures - 50 or more (%)
Housing units in structures - Mobile home (%)
Housing units in structures - Boat, RV, van, etc. (%)
Housing units in structures - Owners - 1, detached (%)
Housing units in structures - Owners - 1, attached (%)
Housing units in structures - Owners - 2 (%)
Housing units in structures - Owners - 3 or 4 (%)
Housing units in structures - Owners - 5 to 9 (%)
Housing units in structures - Owners - 10 to 19 (%)
Housing units in structures - Owners - 20 to 49 (%)
Housing units in structures - Owners - 50 or more (%)
Housing units in structures - Owners - Mobile home (%)
Housing units in structures - Owners - Boat, RV, van, etc. (%)
Housing units in structures - Renters - 1, detached (%)
Housing units in structures - Renters - 1, attached (%)
Housing units in structures - Renters - 2 (%)
Housing units in structures - Renters - 3 or 4 (%)
Housing units in structures - Renters - 5 to 9 (%)
Housing units in structures - Renters - 10 to 19 (%)
Housing units in structures - Renters - 20 to 49 (%)
Housing units in structures - Renters - 50 or more (%)
Housing units in structures - Renters - Mobile home (%)
Housing units in structures - Renters - Boat, RV, van, etc. (%)
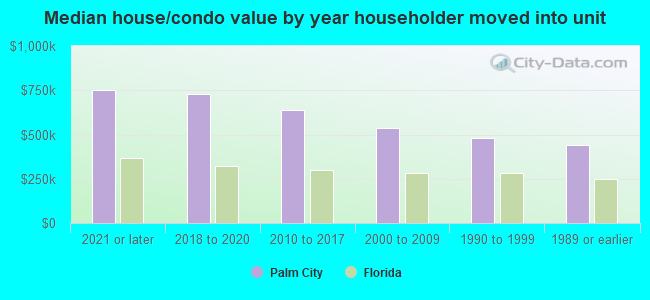
House/condo owner moved in on average (years ago)
Renter moved in on average (years ago)
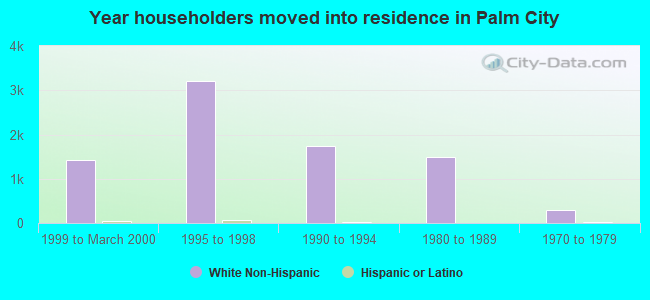
Year householder moved into unit - Moved in 1999 to March 2000 (%)
Year householder moved into unit - Moved in 1999 to March 2000 (%) - White
Year householder moved into unit - Moved in 1999 to March 2000 (%) - Black or African American
Year householder moved into unit - Moved in 1999 to March 2000 (%) - Asian
Year householder moved into unit - Moved in 1999 to March 2000 (%) - Hispanic or Latino
Year householder moved into unit - Moved in 1999 to March 2000 (%) - American Indian and Alaska Native
Year householder moved into unit - Moved in 1999 to March 2000 (%) - Multirace
Year householder moved into unit - Moved in 1999 to March 2000 (%) - Other Race
Year householder moved into unit - Moved in 1995 to 1998 (%)
Year householder moved into unit - Moved in 1995 to 1998 (%) - White
Year householder moved into unit - Moved in 1995 to 1998 (%) - Black or African American
Year householder moved into unit - Moved in 1995 to 1998 (%) - Asian
Year householder moved into unit - Moved in 1995 to 1998 (%) - Hispanic or Latino
Year householder moved into unit - Moved in 1995 to 1998 (%) - American Indian and Alaska Native
Year householder moved into unit - Moved in 1995 to 1998 (%) - Multirace
Year householder moved into unit - Moved in 1995 to 1998 (%) - Other Race
Year householder moved into unit - Moved in 1990 to 1994 (%)
Year householder moved into unit - Moved in 1990 to 1994 (%) - White
Year householder moved into unit - Moved in 1990 to 1994 (%) - Black or African American
Year householder moved into unit - Moved in 1990 to 1994 (%) - Asian
Year householder moved into unit - Moved in 1990 to 1994 (%) - Hispanic or Latino
Year householder moved into unit - Moved in 1990 to 1994 (%) - American Indian and Alaska Native
Year householder moved into unit - Moved in 1990 to 1994 (%) - Multirace
Year householder moved into unit - Moved in 1990 to 1994 (%) - Other Race
Year householder moved into unit - Moved in 1980 to 1989 (%)
Year householder moved into unit - Moved in 1980 to 1989 (%) - White
Year householder moved into unit - Moved in 1980 to 1989 (%) - Black or African American
Year householder moved into unit - Moved in 1980 to 1989 (%) - Asian
Year householder moved into unit - Moved in 1980 to 1989 (%) - Hispanic or Latino
Year householder moved into unit - Moved in 1980 to 1989 (%) - American Indian and Alaska Native
Year householder moved into unit - Moved in 1980 to 1989 (%) - Multirace
Year householder moved into unit - Moved in 1980 to 1989 (%) - Other Race
Year householder moved into unit - Moved in 1970 to 1979 (%)
Year householder moved into unit - Moved in 1970 to 1979 (%) - White
Year householder moved into unit - Moved in 1970 to 1979 (%) - Black or African American
Year householder moved into unit - Moved in 1970 to 1979 (%) - Asian
Year householder moved into unit - Moved in 1970 to 1979 (%) - Hispanic or Latino
Year householder moved into unit - Moved in 1970 to 1979 (%) - American Indian and Alaska Native
Year householder moved into unit - Moved in 1970 to 1979 (%) - Multirace
Year householder moved into unit - Moved in 1970 to 1979 (%) - Other Race
Year householder moved into unit - Moved in 1969 or earlier (%)
Year householder moved into unit - Moved in 1969 or earlier (%) - White
Year householder moved into unit - Moved in 1969 or earlier (%) - Black or African American
Year householder moved into unit - Moved in 1969 or earlier (%) - Asian
Year householder moved into unit - Moved in 1969 or earlier (%) - Hispanic or Latino
Year householder moved into unit - Moved in 1969 or earlier (%) - American Indian and Alaska Native
Year householder moved into unit - Moved in 1969 or earlier (%) - Multirace
Year householder moved into unit - Moved in 1969 or earlier (%) - Other Race
Housing units lacking complete plumbing facilities (%)
Housing units lacking complete kitchen facilities (%)
House heating fuel used in houses and condos - Utility gas (%)
House heating fuel used in houses and condos - Bottled, tank, or LP gas (%)
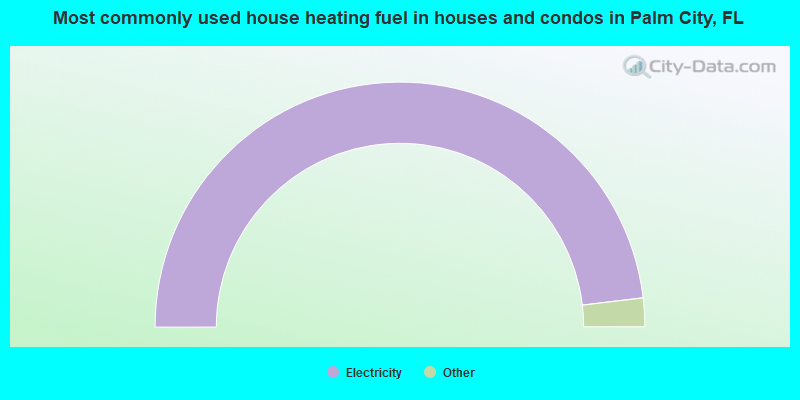
House heating fuel used in houses and condos - Electricity (%)
House heating fuel used in houses and condos - Fuel oil, kerosene, etc. (%)
House heating fuel used in houses and condos - Coal or coke (%)
House heating fuel used in houses and condos - Wood (%)
House heating fuel used in houses and condos - Solar energy (%)
House heating fuel used in houses and condos - Other fuel (%)
House heating fuel used in houses and condos - No fuel used (%)
House heating fuel used in apartments - Utility gas (%)
House heating fuel used in apartments - Bottled, tank, or LP gas (%)
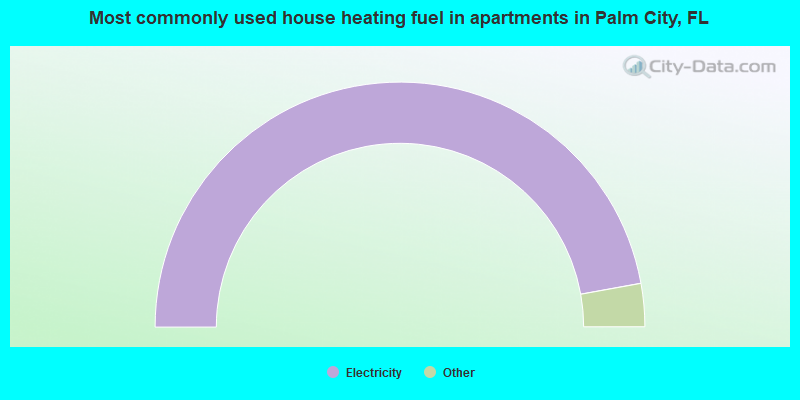
House heating fuel used in apartments - Electricity (%)
House heating fuel used in apartments - Fuel oil, kerosene, etc. (%)
House heating fuel used in apartments - Coal or coke (%)
House heating fuel used in apartments - Wood (%)
House heating fuel used in apartments - Solar energy (%)
House heating fuel used in apartments - Other fuel (%)
House heating fuel used in apartments - No fuel used (%)
Median year house/condo built: 1993Median year apartment built: 1990Household type by relationship:
Households: 26,381
Male householders: 5,025 (860 living alone ), Female householders: 5,431 (1,636 living alone )6,855 spouses (6,822 opposite-sex spouses ), 252 unmarried partners , (239 opposite-sex unmarried partners ), 7,107 children (6,572 natural , 265 adopted , 269 stepchildren ), 299 grandchildren , 138 brothers or sisters , 503 parents , 0 foster children , 177 other relatives , 392 non-relatives In group quarters: 198
Size of family households: 4,285 2-persons , 1,526 3-persons , 1,194 4-persons , 450 5-persons , 94 6-persons , 58 7-or-more-persons .
Size of nonfamily households: 2,497 1-person , 214 2-persons .
4,004 married couples with children. single-parent households (56 men , 321 women ).
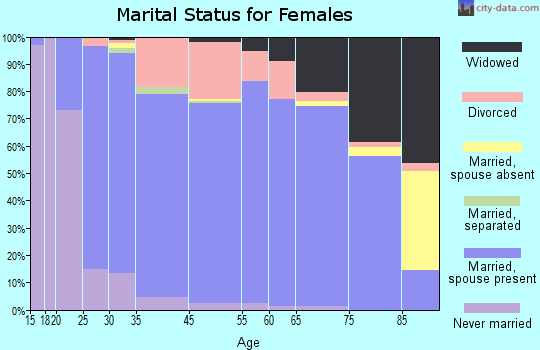
90.9% of residents of Palm City speak English at home. of residents speak Spanish at home (89% speak English very well , 4% speak English well , 5% speak English not well , 2% don't speak English at all ).of residents speak other Indo-European language at home (81% speak English very well , 19% speak English well ).of residents speak Asian or Pacific Island language at home (87% speak English very well , 11% speak English well , 2% speak English not well ).of residents speak other language at home (100% speak English very well ).
Foreign born population: 2,248 (8.5%)of them are naturalized citizens )
Median number of rooms in houses and condos:
Median number of rooms in apartments
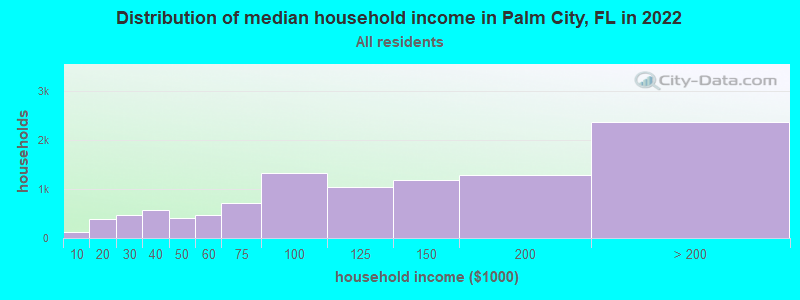
Palm City, FL household income distribution 130 Less than $10,000397 $10,000 to $19,999474 $20,000 to $29,999564 $30,000 to $39,999413 $40,000 to $49,999466 $50,000 to $59,999723 $60,000 to $74,9991,337 $75,000 to $99,9991,038 $100,000 to $124,9991,185 $125,000 to $149,9991,297 $150,000 to $199,9992,374 $200,000 or more
Home value of owner - occupied houses in 2022 in Palm City, FL 38 Less than $10,00013 $15,000 to $19,9999 $20,000 to $24,9997 $30,000 to $34,99918 $35,000 to $39,99927 $40,000 to $49,99911 $50,000 to $59,99936 $100,000 to $124,99950 $125,000 to $149,999152 $150,000 to $174,999208 $175,000 to $199,999281 $200,000 to $249,999529 $250,000 to $299,9991,461 $300,000 to $399,9991,586 $400,000 to $499,9994,013 $500,000 to $749,9991,433 $750,000 to $999,999357 $1,000,000 to $1,499,999259 $1,500,000 to $1,999,99920 $2,000,000 or moreRent paid by renters in 2022 in Palm City, FL 8 $200 to $2494 $550 to $59948 $700 to $74989 $900 to $999124 $1,000 to $1,249174 $1,250 to $1,499363 $1,500 to $1,999206 $2,000 to $2,49993 $2,500 to $2,999274 $3,500 or more100 No cash rent
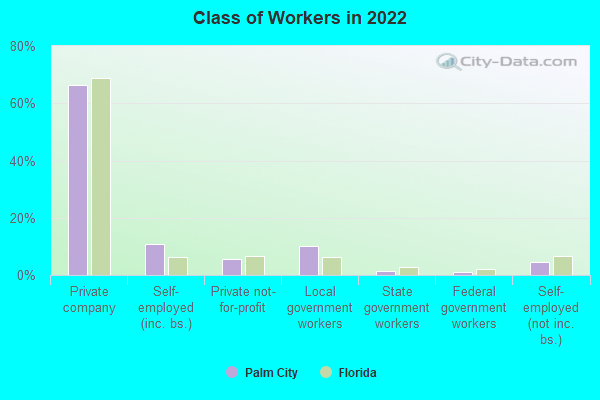
Percentage of workers working in this county: 66.5%Number of people working at home: 2,996 (25.1% of all workers )
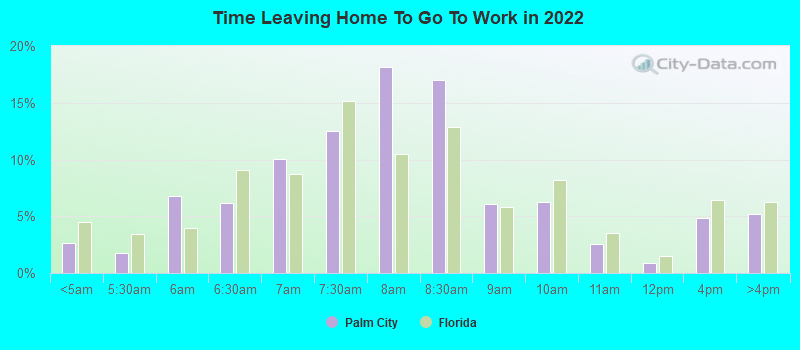
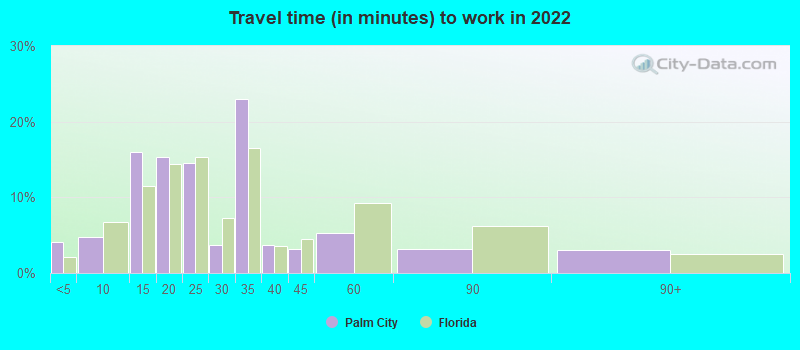
Travel time to work (commute)
Less than 5 minutes: 3645 to 9 minutes: 48510 to 14 minutes: 1,39615 to 19 minutes: 1,35620 to 24 minutes: 1,11025 to 29 minutes: 46930 to 34 minutes: 1,35035 to 39 minutes: 41340 to 44 minutes: 53145 to 59 minutes: 88260 to 89 minutes: 87490 or more minutes: 333
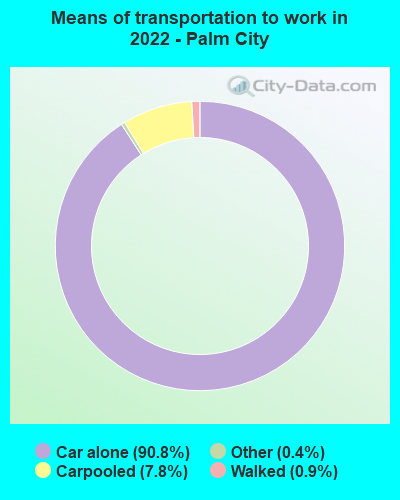
Means of transportation to work:
Drove a car alone: 5,683 (64.3%)Carpooled: 521 (5.9%)Taxi: 29 (0.3%)Walked: 61 (0.7%)Worked at home: 2,996 (33.9%)
Unemployment by race in 2022
Unemployment rate for White non-Hispanic residents 5.4% Males4.4% FemalesUnemployment rate for two or more race residents 2.7% Males12.1% FemalesUnemployment rate for Hispanic or Latino residents 2.3% Males5.5% Females
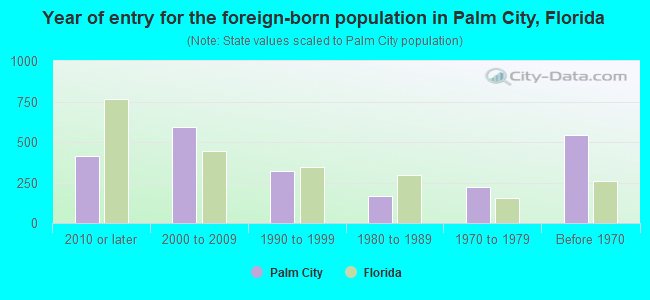
Year of entry for the foreign-born population in Palm City, Florida
412 2010 or later 594 2000 to 2009 324 1990 to 1999 164 1980 to 1989 220 1970 to 1979 545 Before 1970
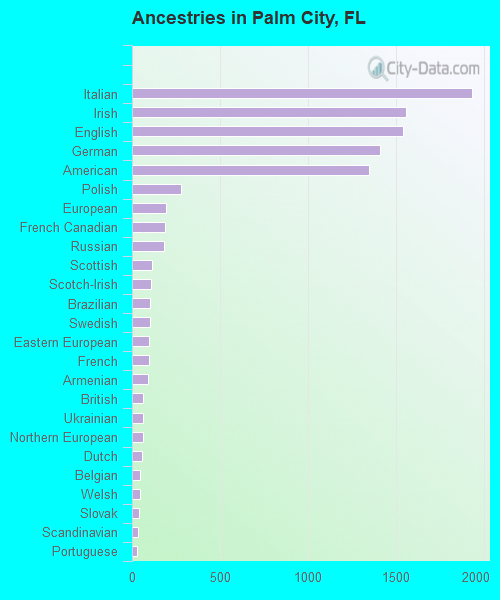
First ancestries reported:
Italian: 1,934 (16.5%)
Irish: 1,558 (13.3%)
English: 1,541 (13.1%)
German: 1,411 (12.0%)
American: 1,348 (11.5%)
Polish: 276 (2.3%)
European: 195 (1.7%)
French Canadian: 189 (1.6%)
Russian: 181 (1.5%)
Scottish: 114 (1.0%)
Scotch-Irish: 106 (0.9%)
Brazilian: 105 (0.9%)
Swedish: 103 (0.9%)
Eastern European: 97 (0.8%)
French: 95 (0.8%)
Armenian: 89 (0.8%)
British: 64 (0.5%)
Ukrainian: 63 (0.5%)
Northern European: 62 (0.5%)
Dutch: 56 (0.5%)
Belgian: 47 (0.4%)
Welsh: 44 (0.4%)
Slovak: 39 (0.3%)
Scandinavian: 32 (0.3%)
Portuguese: 28 (0.2%)
Canadian: 27 (0.2%)
Norwegian: 26 (0.2%)
Lithuanian: 25 (0.2%)
Jamaican: 22 (0.2%)
Hungarian: 20 (0.2%)
Iranian: 20 (0.2%)
Haitian: 19 (0.2%)
Croatian: 16 (0.1%)
Finnish: 16 (0.1%)
Swiss: 11 (0.09%)
Czechoslovakian: 10 (0.09%)
Czech: 10 (0.09%)
Estonian: 8 (0.07%) Most common places of birth for foreign-born residents (%): Philippines Palm City:
9.1% (217)Florida:
1.8% (84,403)
Canada Palm City:
8.6% (207)Florida:
2.4% (109,132)
Cuba Palm City:
7.6% (181)Florida:
22.0% (1,006,576)
India Palm City:
6.2% (149)Florida:
2.1% (94,349)
Russia Palm City:
5.5% (131)Florida:
0.7% (31,076)
Ireland Palm City:
4.9% (118)Florida:
0.2% (9,421)
United Kingdom, excluding England and Scotland Palm City:
4.6% (110)Florida:
0.7% (34,227)
Guatemala Palm City:
4.4% (106)Florida:
2.1% (97,632)
Colombia Palm City:
3.8% (91)Florida:
6.5% (298,669)
Brazil Palm City:
3.6% (87)Florida:
2.7% (122,906)
Costa Rica Palm City:
3.2% (77)Florida:
0.4% (16,570)
England Palm City:
2.8% (66)Florida:
0.8% (37,723)
China, excluding Hong Kong and Taiwan Palm City:
2.6% (63)Florida:
1.2% (56,071)
Hong Kong Palm City:
2.2% (53)Florida:
0.1% (4,585)
Uruguay Palm City:
2.1% (50)Florida:
0.3% (14,809)
Israel Palm City:
1.9% (46)Florida:
0.3% (14,535)
Thailand Palm City:
1.9% (45)Florida:
0.3% (12,303)
Dominican Republic Palm City:
1.9% (45)Florida:
3.0% (137,727)
Belgium Palm City:
1.8% (44)Florida:
0.1% (4,289)
Germany Palm City:
1.8% (43)Florida:
1.2% (54,272)
Other Caribbean Palm City:
1.8% (43)Florida:
0.3% (15,079)
Italy Palm City:
1.8% (42)Florida:
0.7% (30,755)
South Africa Palm City:
1.6% (38)Florida:
0.2% (11,243)
Trinidad and Tobago Palm City:
1.5% (36)Florida:
1.0% (43,642)
Place of birth for U.S.-born residents:
This state: 7,933Other state: 15,890Northeast: 7,911Midwest: 3,942South: 2,859West: 997 90.2% of Palm City residents lived in the same house 1 years ago.
Out of people who lived in different houses, 27.9% lived in this county.
Out of people who lived in different counties, 47.3% lived in Florida.
Palm City:
90.2%State average:
86.3%
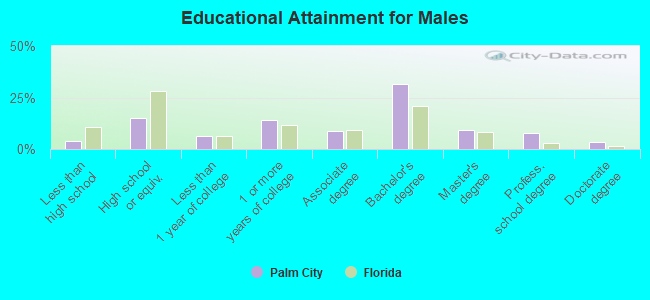
Education attainment for males 25 years and older:
No schooling: 90Nursery to 4th grade: 65th and 6th grade: 07th and 8th grade: 79th grade: 610th grade: 5511th grade: 2812th grade, no diploma: 146High school graduate (or equivalency): 1,365Less than 1 year of college: 596Some college more than 1 year, no degree: 1,316Associate degree: 804Bachelor's degree: 2,918Master's degree: 871Professional school degree: 695Doctorate degree: 314
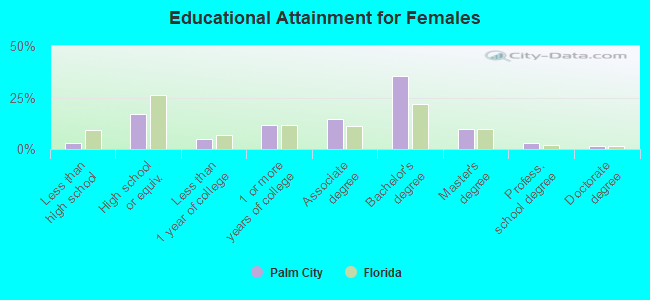
Education attainment for females 25 years and older:
No schooling: 144Nursery to 4th grade: 135th and 6th grade: 317th and 8th grade: 09th grade: 1710th grade: 2011th grade: 6712th grade, no diploma: 7High school graduate (or equivalency): 1,813Less than 1 year of college: 514Some college more than 1 year, no degree: 1,263Associate degree: 1,559Bachelor's degree: 3,793Master's degree: 1,033Professional school degree: 295Doctorate degree: 149
Housing units in structures:
One, detached: 8,765One, attached: 1,294Two: 743 or 4: 6245 to 9: 56010 to 19: 7520 to 49: 15550 or more: 209Mobile homes: 8Housing units lacking complete plumbing facilities in 2022: 0.5%Housing units lacking complete kitchen facilities in 2022: 0.5%House/condo owner moved in on average 9 years ago
Renter moved in on average 1 years ago
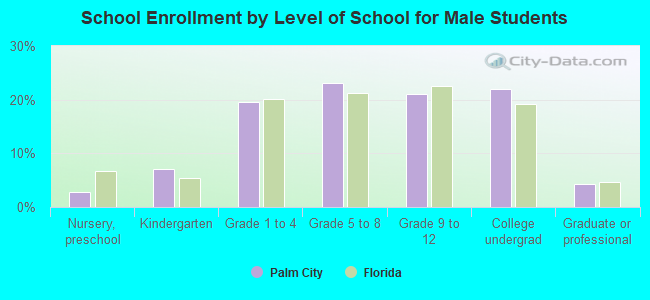
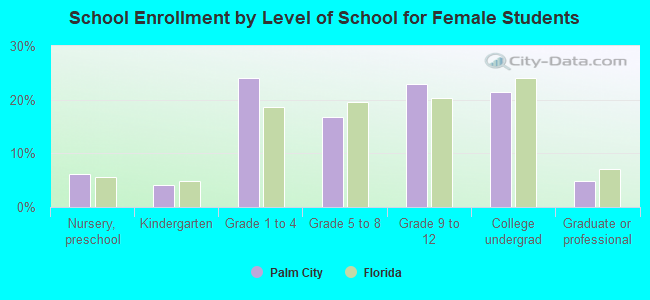
Private vs. public school enrollment:
Students in private schools in grades 1 to 8 (elementary and middle school): 272 Students in private schools in grades 9 to 12 (high school): 45 Students in private undergraduate colleges: 71