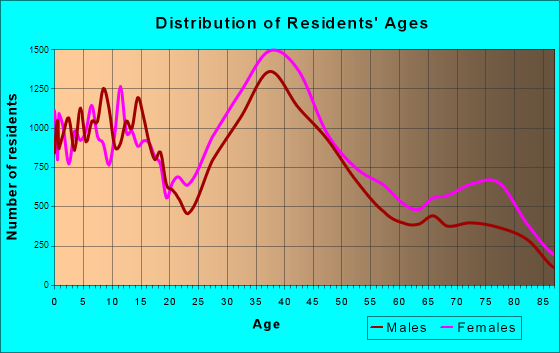
Pembroke Pines, FL (Florida) Houses and Residents
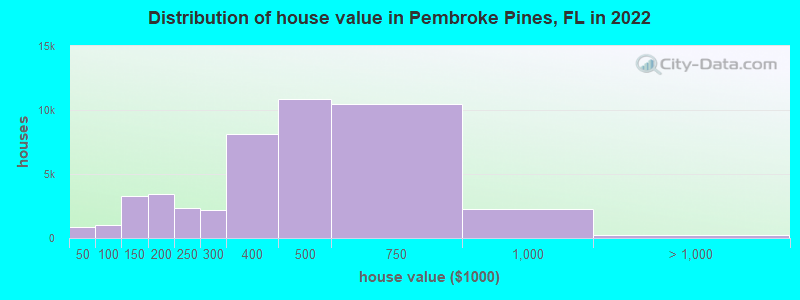
Estimated median house or condo value in 2022: $429,700 (it was $122,700 in 2000 )
Pembroke Pines:
$429,700Florida:
$354,100
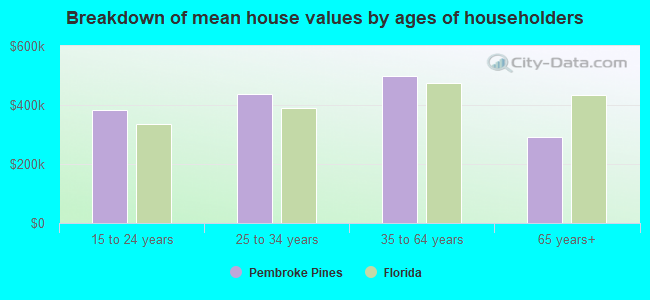
Lower value quartile - upper value quartile: $284,800 - $590,000Mean price in 2022: Detached houses: $541,566 Here:
$541,566State:
$500,941
Townhouses or other attached units: $348,619 Here:
$348,619State:
$370,869
In 2-unit structures: $297,695 Here:
$297,695State:
$423,188
In 3-to-4-unit structures: $247,653 Here:
$247,653State:
$309,944
In 5-or-more-unit structures: $181,968 Here:
$181,968State:
$447,145
Mobile homes: $148,728 Here:
$148,728State:
$113,202
Total population: 164,626 (Urban population: 137,095, Rural population: 17 (all nonfarm) )
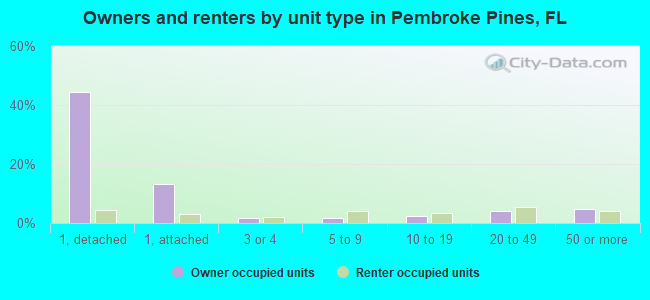
Houses: 64,070 (62,685 occupied: 46,202 owner occupied, 16,483 renter occupied )
% of renters here:
26%State:
33%
Housing density: 1,938 houses/condos per square mile
Median price asked for vacant for-sale houses and condos in 2022: $323,726.
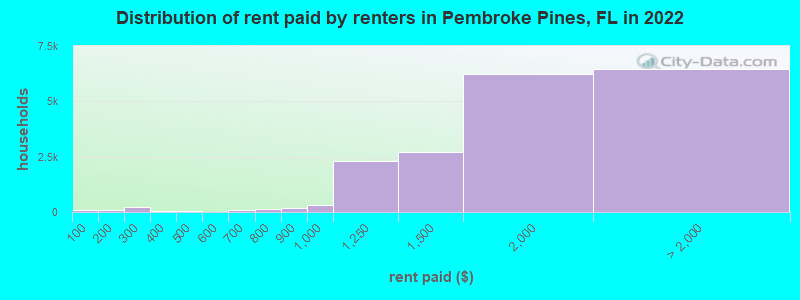
Median contract rent in 2022: $1,777 (lower quartile is $1,497, upper quartile is over $2,000)
Median rent asked for vacant for-rent units in 2022: $1,623
Median gross rent in Pembroke Pines, FL in 2022: $1,977
Housing units in Pembroke Pines with a mortgage: 26,266 (3,146 second mortgage, 197 home equity loan, 2,584 both second mortgage and home equity loan )Houses without a mortgage: 890
Median household income for houses/condos with a mortgage: $124,895
Median household income for apartments without a mortgage: $62,816
Median monthly housing costs: $1,654
Data:
Median house or condo value ($)
Median house or condo value ($ change since 2000)
Median house or condo value ($) - White
Median house or condo value ($) - Black or African American
Median house or condo value ($) - Asian
Median house or condo value ($) - Hispanic or Latino
Median house or condo value ($) - American Indian and Alaska Native
Median house or condo value ($) - Multirace
Median house or condo value ($) - Other Race
Median price asked for mobile homes ($)
Household density (households per square mile)
Mean house or condo value by units in structure - 1, detached ($)
Mean house or condo value by units in structure - 1, attached ($)
Mean house or condo value by units in structure - 2 ($)
Mean house or condo value by units in structure by units in structure - 3 or 4 ($)
Mean house or condo value by units in structure - 5 or more ($)
Mean house or condo value by units in structure - Boat, RV, van, etc. ($)
Mean house or condo value by units in structure - Mobile home ($)
Median contract rent ($)
Median contract rent - Lower quartile ($)
Median contract rent - Upper quartile ($)
Median gross rent ($)
Urban houses (%)
Rural houses (%)
Houses occupied (%)
Houses occupied (% change since 2000)
Houses owner occupied (%)
Houses owner occupied (% change since 2000)
Houses renter occupied (%)
Houses renter occupied (% change since 2000)
Vacant housing units - For rent (%)
Vacant housing units - For rent (% change since 2000)
Vacant housing units - For sale only (%)
Vacant housing units - For sale only (% change since 2000)
Vacant housing units - Rented or sold, not occupied (%)
Vacant housing units - Rented or sold, not occupied (% change since 2000)
Vacant housing units - For seasonal, recreational, or occasional use (%)
Vacant housing units - For seasonal, recreational, or occasional use (% change since 2000)
Vacant housing units - For migrant workers (%)
Vacant housing units - For migrant workers (% change since 2000)
Vacant housing units - Other vacant (%)
Vacant housing units - Other vacant (% change since 2000)
Median monthly housing costs ($)
Median household income for houses/condos with a mortgage ($)
Median household income for houses/condos without a mortgage ($)
Median household income ($)
Median household income ($) - White
Median household income ($) - Black or African American
Median household income ($) - Asian
Median household income ($) - Hispanic or Latino
Median household income ($) - American Indian and Alaska Native
Median household income ($) - Multirace
Median household income ($) - Other Race
Mortgage status - with mortgage (%)
Mortgage status - with second mortgage (%)
Mortgage status - with home equity loan (%)
Mortgage status - with both second mortgage and home equity loan (%)
Mortgage status - without a mortgage (%)
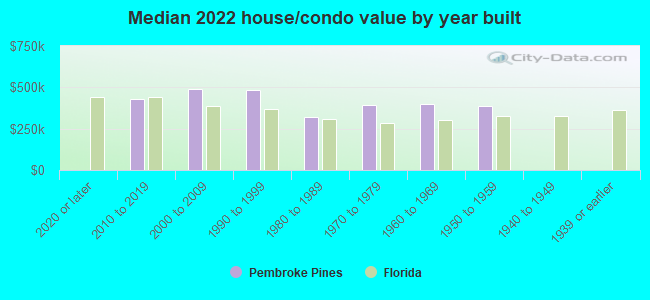
Median year house/condo built
Median year apartment built
Household type by relationship - Male householder living alone (%)
Household type by relationship - Male householder not living alone (%)
Household type by relationship - Female householder living alone (%)
Household type by relationship - Female householder not living alone (%)
Household type by relationship - Opposite-Sex spouse (%)
Household type by relationship - Same-Sex spouse (%)
Household type by relationship - Opposite-Sex unmarried partner (%)
Household type by relationship - Same-Sex unmarried partner (%)
Household type by relationship - In group quarters (%)
Size of family households - 2-person household (%)
Size of family households - 3-person household (%)
Size of family households - 4-person household (%)
Size of family households - 5-person household (%)
Size of family households - 6-person household (%)
Size of family households - 7-or-more-person household (%)
Size of nonfamily households - 1-person household (%)
Size of nonfamily households - 2-person household (%)
Size of nonfamily households - 3-person household (%)
Size of nonfamily households - 4-person household (%)
Size of nonfamily households - 5-person household (%)
Size of nonfamily households - 6-person household (%)
Size of nonfamily households - 7-or-moreperson household (%)
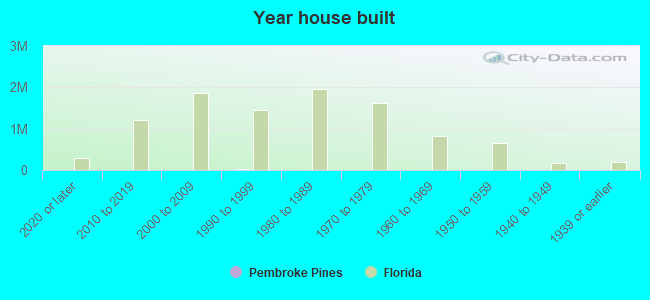
Year house built - Built 2010 or later (%)
Year house built - Built 2000 to 2009 (%)
Year house built - Built 1990 to 1999 (%)
Year house built - Built 1980 to 1989 (%)
Year house built - Built 1970 to 1979 (%)
Year house built - Built 1960 to 1969 (%)
Year house built - Built 1950 to 1959 (%)
Year house built - Built 1940 to 1949 (%)
Year house built - Built 1939 or earlier (%)
Median number of rooms in houses and condos
Median number of rooms in apartments
Median number of bedrooms in owner occupied houses
Mean number of bedrooms in owner occupied houses
Median number of bedrooms in renter occupied houses
Mean number of bedrooms in renter occupied houses
Median number of vehichles in owner occupied houses
Mean number of vehichles in owner occupied houses
Median number of vehichles in renter occupied houses
Mean number of vehichles in renter occupied houses
Rooms in owner-occupied houses - 1 room (%)
Rooms in owner-occupied houses - 2 rooms (%)
Rooms in owner-occupied houses - 3 rooms (%)
Rooms in owner-occupied houses - 4 rooms (%)
Rooms in owner-occupied houses - 5 rooms (%)
Rooms in owner-occupied houses - 6 rooms (%)
Rooms in owner-occupied houses - 7 rooms (%)
Rooms in owner-occupied houses - 8 rooms (%)
Rooms in owner-occupied houses - 9+ rooms (%)
Rooms in renter-occupied houses - 1 room (%)
Rooms in renter-occupied houses - 2 rooms (%)
Rooms in renter-occupied houses - 3 rooms (%)
Rooms in renter-occupied houses - 4 rooms (%)
Rooms in renter-occupied houses - 5 rooms (%)
Rooms in renter-occupied houses - 6 rooms (%)
Rooms in renter-occupied houses - 7 rooms (%)
Rooms in renter-occupied houses - 8 rooms (%)
Rooms in renter-occupied houses - 9+ rooms (%)
Bedrooms in owner-occupied houses - no bedrooms (%)
Bedrooms in owner-occupied houses - 1 bedroom (%)
Bedrooms in owner-occupied houses - 2 bedrooms (%)
Bedrooms in owner-occupied houses - 3 bedrooms (%)
Bedrooms in owner-occupied houses - 4 bedrooms (%)
Bedrooms in owner-occupied houses - 5+ bedrooms (%)
Bedrooms in renter-occupied houses - no bedrooms (%)
Bedrooms in renter-occupied houses - 1 bedroom (%)
Bedrooms in renter-occupied houses - 2 bedrooms (%)
Bedrooms in renter-occupied houses - 3 bedrooms (%)
Bedrooms in renter-occupied houses - 4 bedrooms (%)
Bedrooms in renter-occupied houses - 5+ bedrooms (%)
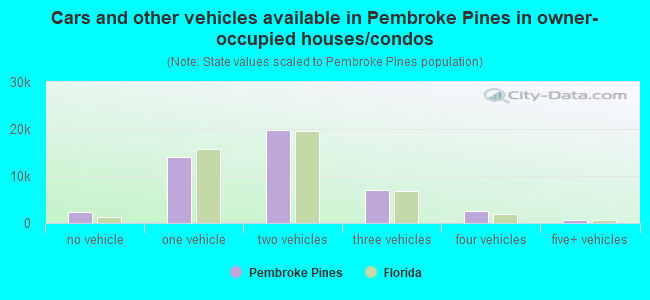
Vehicles available in owner-occupied houses - no vehicle available (%)
Vehicles available in owner-occupied houses - 1 vehicle available(%)
Vehicles available in owner-occupied houses - 2 Vehicles available (%)
Vehicles available in owner-occupied houses - 3 Vehicles available (%)
Vehicles available in owner-occupied houses - 4 Vehicles available (%)
Vehicles available in owner-occupied houses - 5+ Vehicles available (%)
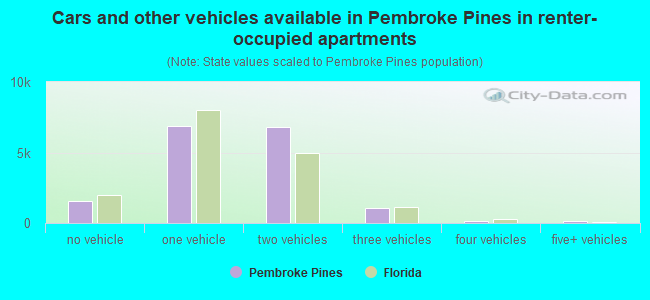
Vehicles available in renter-occupied houses - no vehicle available (%)
Vehicles available in renter-occupied houses - 1 vehicle available (%)
Vehicles available in renter-occupied houses - 2 Vehicles available (%)
Vehicles available in renter-occupied houses - 3 Vehicles available (%)
Vehicles available in renter-occupied houses - 4 Vehicles available (%)
Vehicles available in renter-occupied houses - 5+ Vehicles available (%)
Housing units in structures - 1, detached (%)
Housing units in structures - 1, attached (%)
Housing units in structures - 2 (%)
Housing units in structures - 3 or 4 (%)
Housing units in structures - 5 to 9 (%)
Housing units in structures - 10 to 19 (%)
Housing units in structures - 20 to 49 (%)
Housing units in structures - 50 or more (%)
Housing units in structures - Mobile home (%)
Housing units in structures - Boat, RV, van, etc. (%)
Housing units in structures - Owners - 1, detached (%)
Housing units in structures - Owners - 1, attached (%)
Housing units in structures - Owners - 2 (%)
Housing units in structures - Owners - 3 or 4 (%)
Housing units in structures - Owners - 5 to 9 (%)
Housing units in structures - Owners - 10 to 19 (%)
Housing units in structures - Owners - 20 to 49 (%)
Housing units in structures - Owners - 50 or more (%)
Housing units in structures - Owners - Mobile home (%)
Housing units in structures - Owners - Boat, RV, van, etc. (%)
Housing units in structures - Renters - 1, detached (%)
Housing units in structures - Renters - 1, attached (%)
Housing units in structures - Renters - 2 (%)
Housing units in structures - Renters - 3 or 4 (%)
Housing units in structures - Renters - 5 to 9 (%)
Housing units in structures - Renters - 10 to 19 (%)
Housing units in structures - Renters - 20 to 49 (%)
Housing units in structures - Renters - 50 or more (%)
Housing units in structures - Renters - Mobile home (%)
Housing units in structures - Renters - Boat, RV, van, etc. (%)
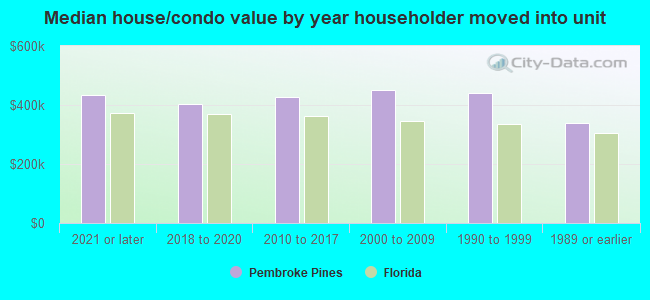
House/condo owner moved in on average (years ago)
Renter moved in on average (years ago)
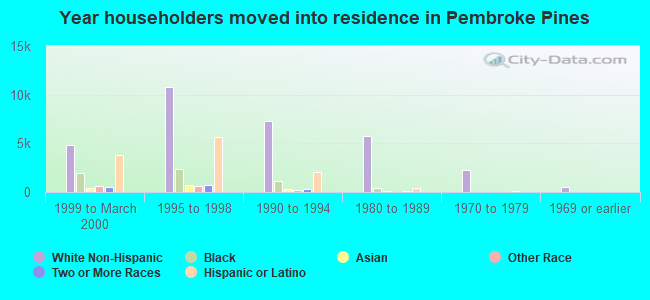
Year householder moved into unit - Moved in 1999 to March 2000 (%)
Year householder moved into unit - Moved in 1999 to March 2000 (%) - White
Year householder moved into unit - Moved in 1999 to March 2000 (%) - Black or African American
Year householder moved into unit - Moved in 1999 to March 2000 (%) - Asian
Year householder moved into unit - Moved in 1999 to March 2000 (%) - Hispanic or Latino
Year householder moved into unit - Moved in 1999 to March 2000 (%) - American Indian and Alaska Native
Year householder moved into unit - Moved in 1999 to March 2000 (%) - Multirace
Year householder moved into unit - Moved in 1999 to March 2000 (%) - Other Race
Year householder moved into unit - Moved in 1995 to 1998 (%)
Year householder moved into unit - Moved in 1995 to 1998 (%) - White
Year householder moved into unit - Moved in 1995 to 1998 (%) - Black or African American
Year householder moved into unit - Moved in 1995 to 1998 (%) - Asian
Year householder moved into unit - Moved in 1995 to 1998 (%) - Hispanic or Latino
Year householder moved into unit - Moved in 1995 to 1998 (%) - American Indian and Alaska Native
Year householder moved into unit - Moved in 1995 to 1998 (%) - Multirace
Year householder moved into unit - Moved in 1995 to 1998 (%) - Other Race
Year householder moved into unit - Moved in 1990 to 1994 (%)
Year householder moved into unit - Moved in 1990 to 1994 (%) - White
Year householder moved into unit - Moved in 1990 to 1994 (%) - Black or African American
Year householder moved into unit - Moved in 1990 to 1994 (%) - Asian
Year householder moved into unit - Moved in 1990 to 1994 (%) - Hispanic or Latino
Year householder moved into unit - Moved in 1990 to 1994 (%) - American Indian and Alaska Native
Year householder moved into unit - Moved in 1990 to 1994 (%) - Multirace
Year householder moved into unit - Moved in 1990 to 1994 (%) - Other Race
Year householder moved into unit - Moved in 1980 to 1989 (%)
Year householder moved into unit - Moved in 1980 to 1989 (%) - White
Year householder moved into unit - Moved in 1980 to 1989 (%) - Black or African American
Year householder moved into unit - Moved in 1980 to 1989 (%) - Asian
Year householder moved into unit - Moved in 1980 to 1989 (%) - Hispanic or Latino
Year householder moved into unit - Moved in 1980 to 1989 (%) - American Indian and Alaska Native
Year householder moved into unit - Moved in 1980 to 1989 (%) - Multirace
Year householder moved into unit - Moved in 1980 to 1989 (%) - Other Race
Year householder moved into unit - Moved in 1970 to 1979 (%)
Year householder moved into unit - Moved in 1970 to 1979 (%) - White
Year householder moved into unit - Moved in 1970 to 1979 (%) - Black or African American
Year householder moved into unit - Moved in 1970 to 1979 (%) - Asian
Year householder moved into unit - Moved in 1970 to 1979 (%) - Hispanic or Latino
Year householder moved into unit - Moved in 1970 to 1979 (%) - American Indian and Alaska Native
Year householder moved into unit - Moved in 1970 to 1979 (%) - Multirace
Year householder moved into unit - Moved in 1970 to 1979 (%) - Other Race
Year householder moved into unit - Moved in 1969 or earlier (%)
Year householder moved into unit - Moved in 1969 or earlier (%) - White
Year householder moved into unit - Moved in 1969 or earlier (%) - Black or African American
Year householder moved into unit - Moved in 1969 or earlier (%) - Asian
Year householder moved into unit - Moved in 1969 or earlier (%) - Hispanic or Latino
Year householder moved into unit - Moved in 1969 or earlier (%) - American Indian and Alaska Native
Year householder moved into unit - Moved in 1969 or earlier (%) - Multirace
Year householder moved into unit - Moved in 1969 or earlier (%) - Other Race
Housing units lacking complete plumbing facilities (%)
Housing units lacking complete kitchen facilities (%)
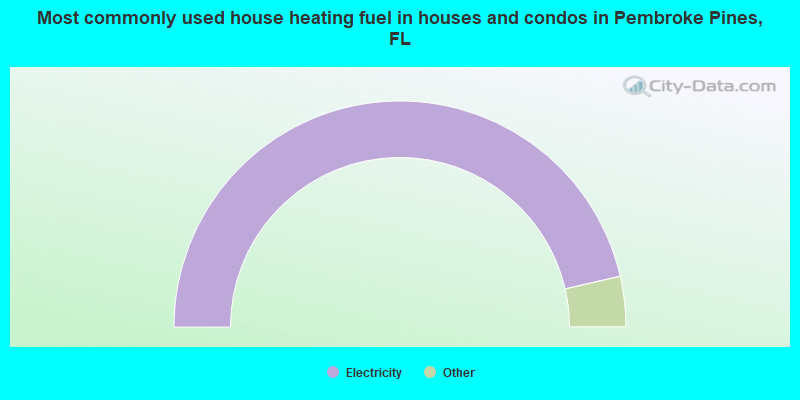
House heating fuel used in houses and condos - Utility gas (%)
House heating fuel used in houses and condos - Bottled, tank, or LP gas (%)
House heating fuel used in houses and condos - Electricity (%)
House heating fuel used in houses and condos - Fuel oil, kerosene, etc. (%)
House heating fuel used in houses and condos - Coal or coke (%)
House heating fuel used in houses and condos - Wood (%)
House heating fuel used in houses and condos - Solar energy (%)
House heating fuel used in houses and condos - Other fuel (%)
House heating fuel used in houses and condos - No fuel used (%)
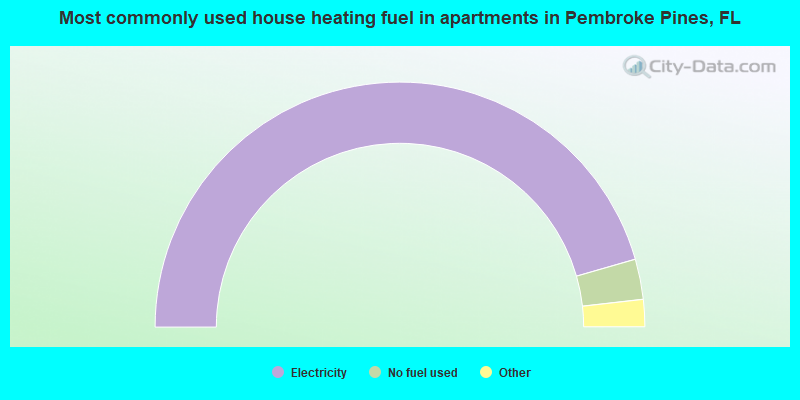
House heating fuel used in apartments - Utility gas (%)
House heating fuel used in apartments - Bottled, tank, or LP gas (%)
House heating fuel used in apartments - Electricity (%)
House heating fuel used in apartments - Fuel oil, kerosene, etc. (%)
House heating fuel used in apartments - Coal or coke (%)
House heating fuel used in apartments - Wood (%)
House heating fuel used in apartments - Solar energy (%)
House heating fuel used in apartments - Other fuel (%)
House heating fuel used in apartments - No fuel used (%)
Median year house/condo built: 1991Median year apartment built: 1998Household type by relationship:
Households: 169,875
Male householders: 27,597 (4,728 living alone ), Female householders: 35,088 (8,153 living alone )31,115 spouses (30,847 opposite-sex spouses ), 5,849 unmarried partners , (5,849 opposite-sex unmarried partners ), 52,729 children (49,206 natural , 962 adopted , 2,561 stepchildren ), 1,931 grandchildren , 3,109 brothers or sisters , 5,808 parents , 0 foster children , 2,699 other relatives , 2,888 non-relatives In group quarters: 1,062
Size of family households: 18,762 2-persons , 12,803 3-persons , 9,814 4-persons , 3,612 5-persons , 1,040 6-persons , 428 7-or-more-persons .
Size of nonfamily households: 12,881 1-person , 3,077 2-persons , 165 3-persons , 103 4-persons .
20,373 married couples with children. single-parent households (2,634 men , 6,905 women ).
46.7% of residents of Pembroke Pines speak English at home. of residents speak Spanish at home (62% speak English very well , 18% speak English well , 11% speak English not well , 9% don't speak English at all ).of residents speak other Indo-European language at home (75% speak English very well , 16% speak English well , 6% speak English not well , 3% don't speak English at all ).of residents speak Asian or Pacific Island language at home (59% speak English very well , 31% speak English well , 9% speak English not well , 2% don't speak English at all ).of residents speak other language at home (92% speak English very well , 3% speak English well , 5% speak English not well ).
Foreign born population: 68,730 (40.5%)of them are naturalized citizens )
Median number of rooms in houses and condos:
Median number of rooms in apartments
Owner-occupied Renter-occupied
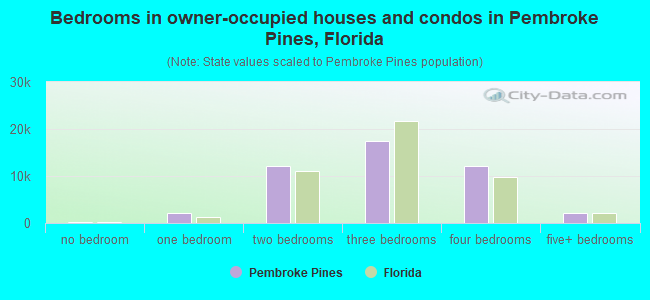
Bedrooms in owner-occupied houses and condos in Pembroke Pines, Florida
181 no bedroom 2,199 1 bedroom 12,050 2 bedrooms 17,441 3 bedrooms 12,154 4 bedrooms 2,177 5+ bedrooms
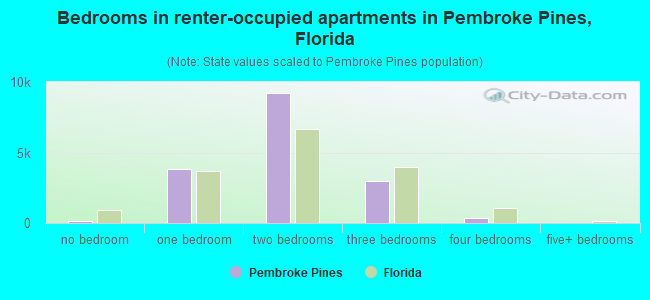
Bedrooms in renter-occupied apartments in Pembroke Pines, Florida
151 no bedroom 3,838 1 bedroom 9,186 2 bedrooms 2,973 3 bedrooms 335 4 bedrooms 0 5+ bedrooms
Owner-occupied Renter-occupied
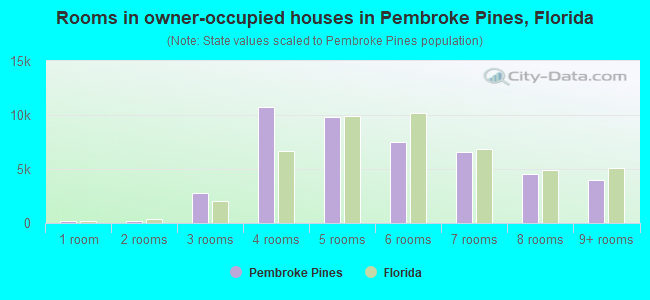
Rooms in owner-occupied houses in Pembroke Pines, Florida
181 1 room 157 2 rooms 2,775 3 rooms 10,741 4 rooms 9,807 5 rooms 7,482 6 rooms 6,615 7 rooms 4,500 8 rooms 3,944 9+ rooms
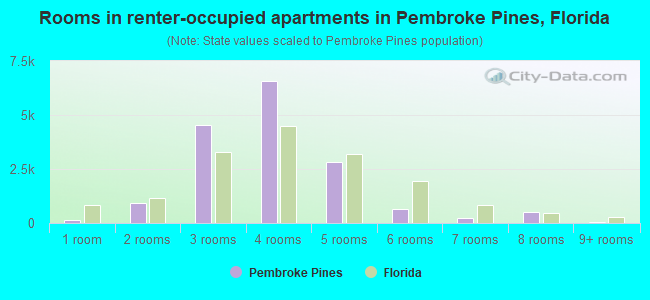
Rooms in renter-occupied apartments in Pembroke Pines, Florida
151 1 room 941 2 rooms 4,521 3 rooms 6,589 4 rooms 2,835 5 rooms 659 6 rooms 245 7 rooms 492 8 rooms 50 9+ rooms
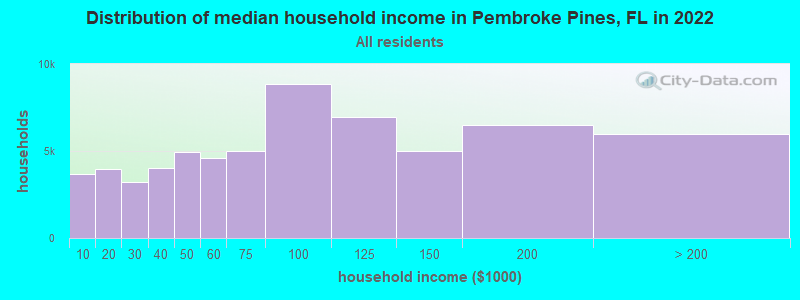
Pembroke Pines, FL household income distribution 3,691 Less than $10,0003,971 $10,000 to $19,9993,190 $20,000 to $29,9994,032 $30,000 to $39,9994,931 $40,000 to $49,9994,587 $50,000 to $59,9995,008 $60,000 to $74,9998,827 $75,000 to $99,9996,941 $100,000 to $124,9995,003 $125,000 to $149,9996,517 $150,000 to $199,9995,987 $200,000 or more
Home value of owner - occupied houses in 2022 in Pembroke Pines, FL 360 Less than $10,000237 $10,000 to $14,99969 $20,000 to $24,99919 $25,000 to $29,99987 $30,000 to $34,99919 $35,000 to $39,99993 $40,000 to $49,999224 $50,000 to $59,99982 $60,000 to $69,999135 $70,000 to $79,999291 $80,000 to $89,999157 $90,000 to $99,9991,460 $100,000 to $124,9991,849 $125,000 to $149,9992,112 $150,000 to $174,9991,362 $175,000 to $199,9992,334 $200,000 to $249,9992,191 $250,000 to $299,9998,111 $300,000 to $399,99910,873 $400,000 to $499,99910,473 $500,000 to $749,9992,286 $750,000 to $999,999167 $1,000,000 to $1,499,99991 $2,000,000 or moreRent paid by renters in 2022 in Pembroke Pines, FL 82 Less than $10079 $100 to $1497 $150 to $199142 $200 to $24963 $250 to $29927 $300 to $34936 $350 to $39929 $450 to $49917 $500 to $54962 $600 to $64937 $650 to $69931 $700 to $74983 $750 to $799188 $800 to $899327 $900 to $9992,304 $1,000 to $1,2492,708 $1,250 to $1,4996,247 $1,500 to $1,9993,900 $2,000 to $2,499825 $2,500 to $2,999655 $3,000 to $3,499448 $3,500 or more630 No cash rent
Percentage of workers working in this county: 71.4%Number of people working at home: 11,691 (14.0% of all workers )
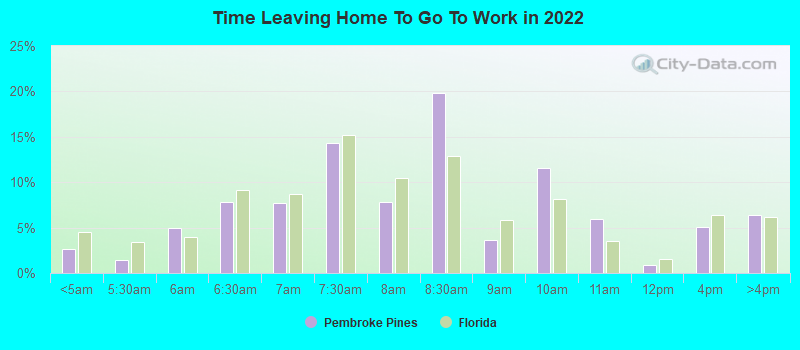
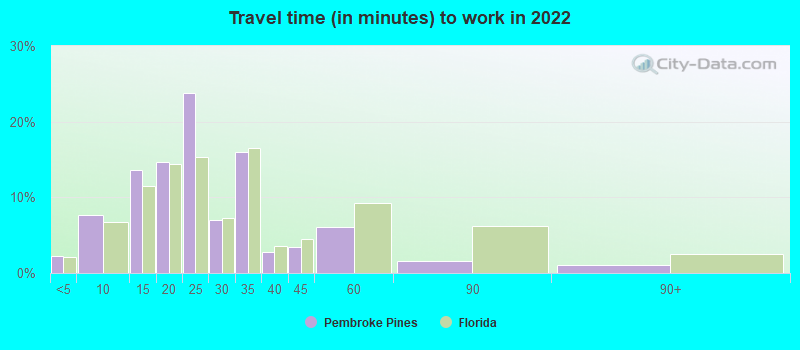
Travel time to work (commute)
Less than 5 minutes: 6855 to 9 minutes: 2,80110 to 14 minutes: 6,05615 to 19 minutes: 6,63720 to 24 minutes: 15,02025 to 29 minutes: 4,35630 to 34 minutes: 13,53235 to 39 minutes: 4,71340 to 44 minutes: 3,08245 to 59 minutes: 4,48260 to 89 minutes: 5,72590 or more minutes: 1,769
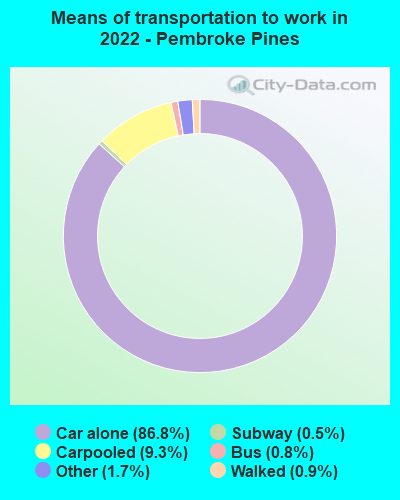
Means of transportation to work:
Drove a car alone: 39,211 (68.7%)Carpooled: 4,771 (8.4%)Bus : 375 (0.7%)Long-distance train or commuter rail : 220 (0.4%)Taxi: 797 (1.4%)Bicycle: 47 (0.1%)Walked: 480 (0.8%)Worked at home: 11,691 (20.5%)
Unemployment by race in 2022
Unemployment rate for White non-Hispanic residents 1.5% Males1.3% FemalesUnemployment rate for Black residents 2.0% Males8.2% FemalesUnemployment rate for Asian residents 2.9% Males1.9% FemalesUnemployment rate for other race residents 8.1% Males5.1% FemalesUnemployment rate for two or more race residents 3.7% Males3.1% FemalesUnemployment rate for Hispanic or Latino residents 4.4% Males3.6% Females
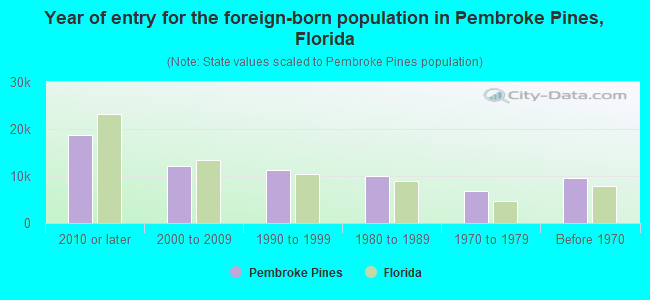
Year of entry for the foreign-born population in Pembroke Pines, Florida
18,686 2010 or later 12,143 2000 to 2009 11,187 1990 to 1999 9,965 1980 to 1989 6,843 1970 to 1979 9,533 Before 1970
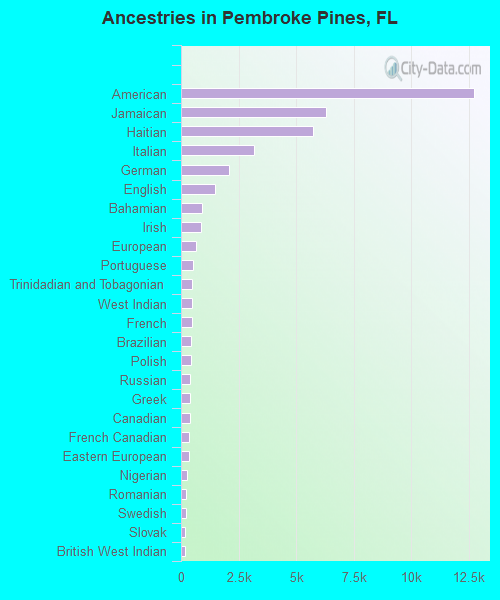
First ancestries reported:
American: 12,752 (11.3%)
Jamaican: 6,316 (5.6%)
Haitian: 5,746 (5.1%)
Italian: 3,158 (2.8%)
German: 2,084 (1.8%)
English: 1,486 (1.3%)
Bahamian: 907 (0.8%)
Irish: 883 (0.8%)
European: 650 (0.6%)
Portuguese: 517 (0.5%)
Trinidadian and Tobagonian: 494 (0.4%)
West Indian: 475 (0.4%)
French: 463 (0.4%)
Brazilian: 439 (0.4%)
Polish: 421 (0.4%)
Russian: 405 (0.4%)
Greek: 399 (0.4%)
Canadian: 373 (0.3%)
French Canadian: 362 (0.3%)
Eastern European: 356 (0.3%)
Nigerian: 267 (0.2%)
Romanian: 202 (0.2%)
Swedish: 197 (0.2%)
Slovak: 193 (0.2%)
British West Indian: 159 (0.1%)
British: 154 (0.1%)
Guyanese: 151 (0.1%)
Hungarian: 147 (0.1%)
Scottish: 140 (0.1%)
Turkish: 139 (0.1%)
Jordanian: 118 (0.1%)
Dutch: 108 (0.10%)
African: 105 (0.09%)
Lebanese: 102 (0.09%)
Norwegian: 101 (0.09%)
Egyptian: 90 (0.08%)
Arab: 75 (0.07%)
Palestinian: 73 (0.06%)
Barbadian: 60 (0.05%)
Ukrainian: 56 (0.05%)
Czech: 54 (0.05%)
Cape Verdean: 51 (0.05%)
Israeli: 47 (0.04%)
Scotch-Irish: 46 (0.04%)
Northern European: 44 (0.04%)
Dutch West Indian: 40 (0.04%)
Syrian: 38 (0.03%)
U.S. Virgin Islander: 26 (0.02%)
Moroccan: 25 (0.02%)
Iranian: 25 (0.02%)
Armenian: 24 (0.02%)
Yugoslavian: 21 (0.02%)
Belizean: 20 (0.02%)
Scandinavian: 19 (0.02%)
Ghanaian: 13 (0.01%)
Danish: 13 (0.01%)
Bulgarian: 11 (0.01%)
Croatian: 9 (0.01%)
Austrian: 9 (0.01%)
Czechoslovakian: 8 (0.01%)
Welsh: 6 (0.01%)
Most common places of birth for foreign-born residents (%): Cuba Pembroke Pines:
20.5% (14,140)Florida:
22.0% (1,006,576)
Colombia Pembroke Pines:
13.8% (9,537)Florida:
6.5% (298,669)
Venezuela Pembroke Pines:
12.6% (8,687)Florida:
5.7% (262,042)
Jamaica Pembroke Pines:
8.3% (5,725)Florida:
5.0% (227,319)
Haiti Pembroke Pines:
6.8% (4,672)Florida:
7.5% (342,375)
Dominican Republic Pembroke Pines:
5.5% (3,808)Florida:
3.0% (137,727)
Peru Pembroke Pines:
3.9% (2,664)Florida:
2.1% (96,693)
Nicaragua Pembroke Pines:
2.2% (1,489)Florida:
2.3% (105,066)
India Pembroke Pines:
2.1% (1,471)Florida:
2.1% (94,349)
Ecuador Pembroke Pines:
1.7% (1,199)Florida:
1.2% (54,585)
Canada Pembroke Pines:
1.5% (1,037)Florida:
2.4% (109,132)
Place of birth for U.S.-born residents:
This state: 66,290Other state: 30,353Northeast: 18,477Midwest: 4,362South: 5,869West: 1,645 91.1% of Pembroke Pines residents lived in the same house 1 years ago.
Out of people who lived in different houses, 36.6% lived in this county.
Out of people who lived in different counties, 69.9% lived in Florida.
Pembroke Pines:
91.1%State average:
86.3%
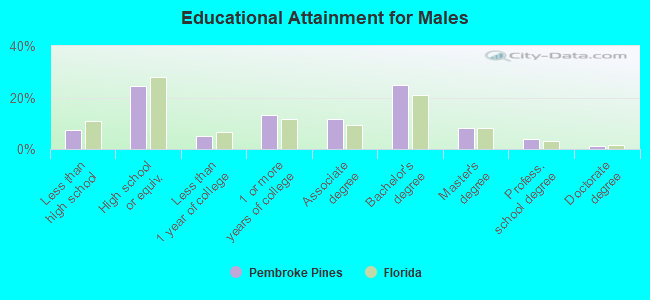
Education attainment for males 25 years and older:
No schooling: 1,272Nursery to 4th grade: 3355th and 6th grade: 07th and 8th grade: 2039th grade: 1,18310th grade: 10311th grade: 35012th grade, no diploma: 846High school graduate (or equivalency): 14,287Less than 1 year of college: 2,966Some college more than 1 year, no degree: 7,696Associate degree: 6,709Bachelor's degree: 14,475Master's degree: 4,670Professional school degree: 2,361Doctorate degree: 574
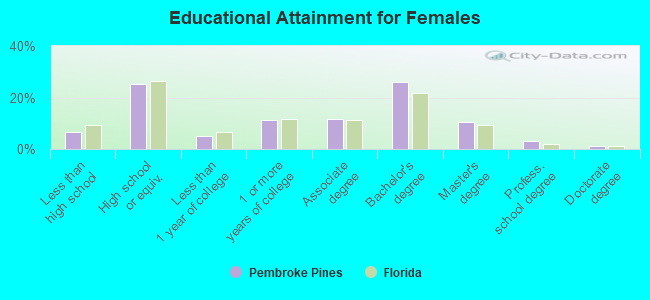
Education attainment for females 25 years and older:
No schooling: 1,186Nursery to 4th grade: 3485th and 6th grade: 2447th and 8th grade: 1259th grade: 35510th grade: 60111th grade: 11912th grade, no diploma: 1,307High school graduate (or equivalency): 16,581Less than 1 year of college: 3,343Some college more than 1 year, no degree: 7,490Associate degree: 7,613Bachelor's degree: 17,131Master's degree: 6,829Professional school degree: 2,075Doctorate degree: 653
Housing units in structures:
One, detached: 30,947One, attached: 10,343Two: 3473 or 4: 2,3395 to 9: 3,71210 to 19: 3,74320 to 49: 6,19350 or more: 5,810Mobile homes: 636Median worth of mobile homes: $146,900
Housing units lacking complete plumbing facilities in 2022: 0.8%Housing units lacking complete kitchen facilities in 2022: 0.5%House/condo owner moved in on average 11 years ago
Renter moved in on average 2 years ago
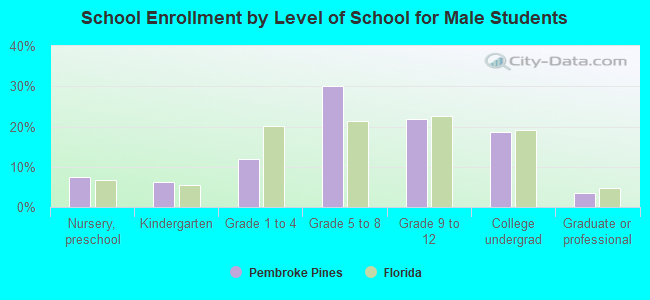
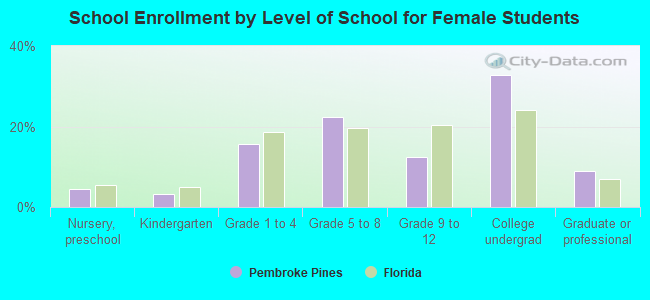
Private vs. public school enrollment:
Students in private schools in grades 1 to 8 (elementary and middle school): 3,130 Students in private schools in grades 9 to 12 (high school): 973 Students in private undergraduate colleges: 2,140