Housing density: 575 houses/condos per square mile
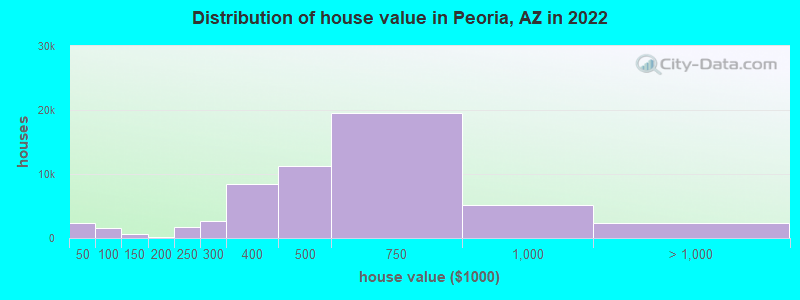
Median price asked for vacant for-sale houses and condos in 2022: $520,501.
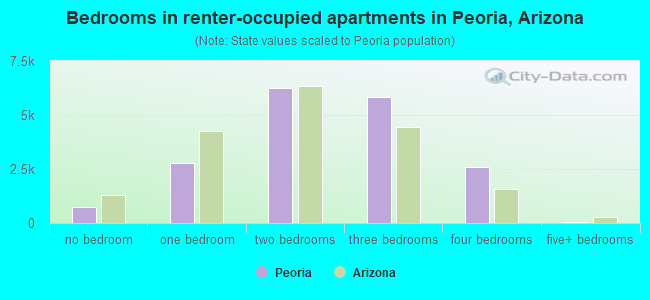
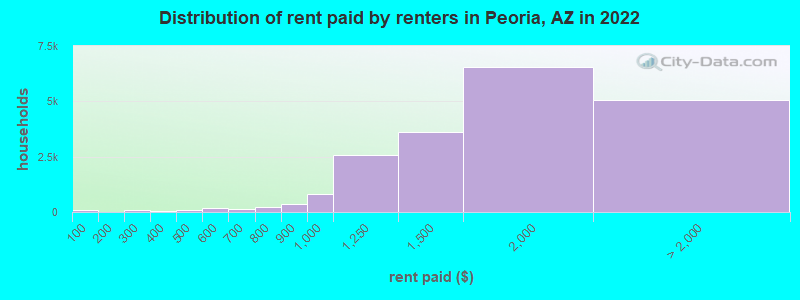
Median contract rent in 2022: $1,710 (lower quartile is $1,355, upper quartile is over $2,000)
Median rent asked for vacant for-rent units in 2022: $2,757
Median gross rent in Peoria, AZ in 2022: $1,860
Housing units in Peoria with a mortgage: 37,707 (4,513 second mortgage, 62 home equity loan, 3,625 both second mortgage and home equity loan) Houses without a mortgage: 381
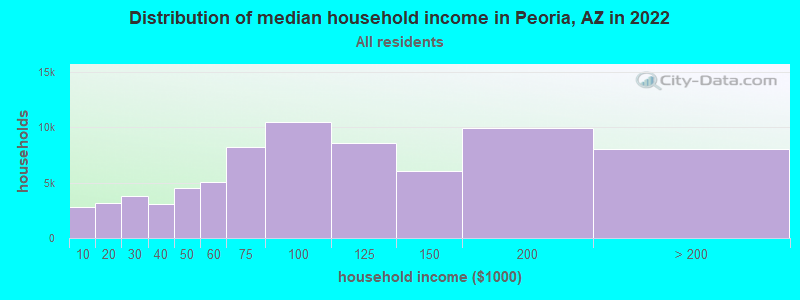
Median household income for houses/condos with a mortgage: $120,010
Median household income for apartments without a mortgage: $78,317
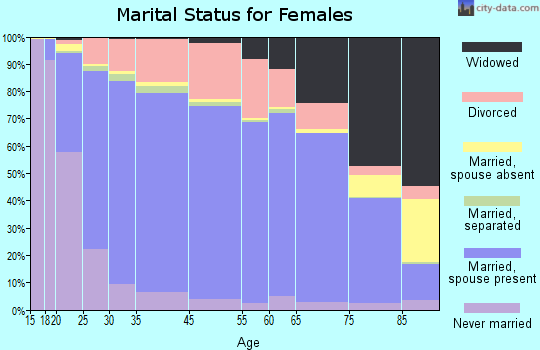
29,645 married couples with children.
6,472 single-parent households (1,772 men, 4,700 women).
82.8% of residents of Peoria speak English at home.
9.7% of residents speak Spanish at home (73% speak English very well, 16% speak English well, 8% speak English not well, 3% don't speak English at all).
2.6% of residents speak other Indo-European language at home (77% speak English very well, 17% speak English well, 5% speak English not well, 1% don't speak English at all).
3.6% of residents speak Asian or Pacific Island language at home (60% speak English very well, 25% speak English well, 12% speak English not well, 3% don't speak English at all).
1.4% of residents speak other language at home (66% speak English very well, 23% speak English well, 11% speak English not well, 1% don't speak English at all).
Foreign born population: 23,379 (11.8%)
(69.4% of them are naturalized citizens)
Percentage of workers working in this county: 98.9% Number of people working at home: 18,969 (20.0% of all workers)
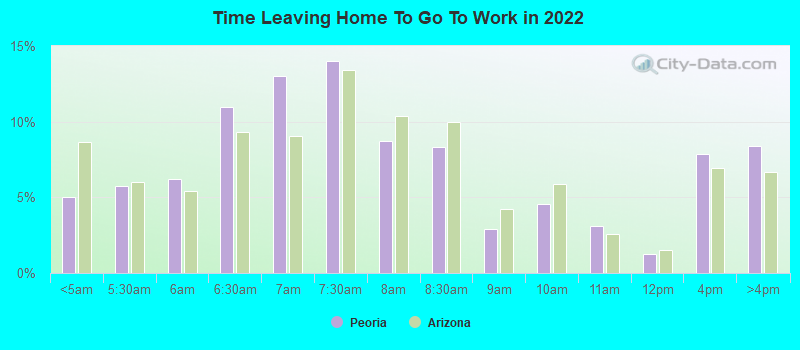
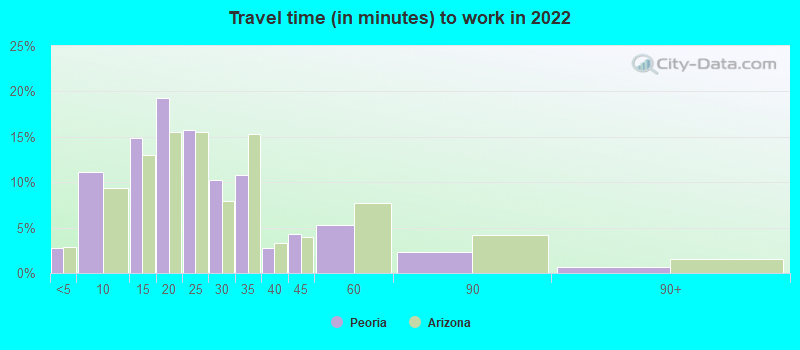
Travel time to work (commute)
Less than 5 minutes: 1,184
5 to 9 minutes: 6,772
10 to 14 minutes: 6,335
15 to 19 minutes: 10,408
20 to 24 minutes: 13,651
25 to 29 minutes: 6,516
30 to 34 minutes: 10,759
35 to 39 minutes: 2,972
40 to 44 minutes: 2,875
45 to 59 minutes: 9,173
60 to 89 minutes: 4,388
90 or more minutes: 659
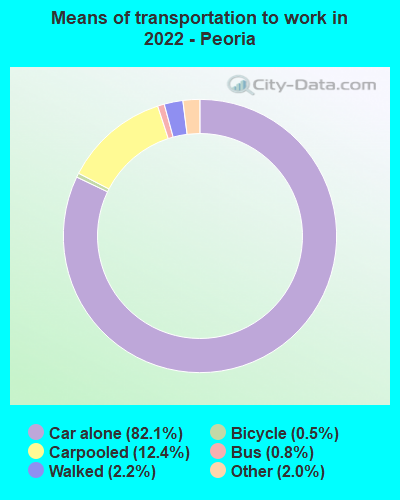
Means of transportation to work:
Drove a car alone: 42,930 (60.2%)
Carpooled: 6,489 (9.1%)
Bus: 406 (0.6%)
Taxi: 1,039 (1.5%)
Bicycle: 267 (0.4%)
Walked: 1,157 (1.6%)
Worked at home: 18,969 (26.6%)
Unemployment by race in 2022
Unemployment rate for White non-Hispanic residents
3.4%Males
1.9%Females
Unemployment rate for Black residents
8.6%Males
8.7%Females
Unemployment rate for American Indian and Alaska Native residents
2.0%Males
2.7%Females
Unemployment rate for Asian residents
1.3%Males
2.5%Females
Unemployment rate for other race residents
0.8%Males
3.1%Females
Unemployment rate for two or more race residents
2.5%Males
4.0%Females
Unemployment rate for Hispanic or Latino residents
1.9%Males
3.6%Females
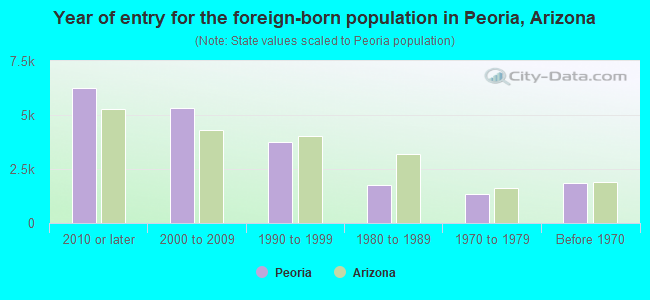
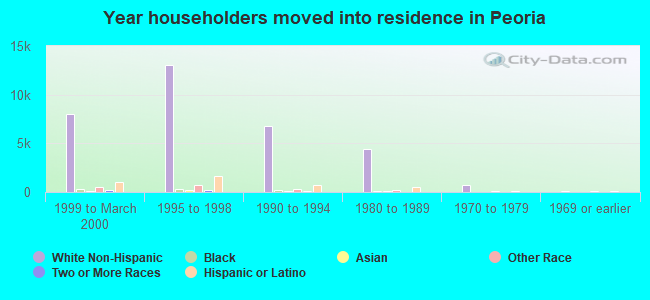
Year of entry for the foreign-born population in Peoria, Arizona
6,2522010 or later
5,3442000 to 2009
3,7721990 to 1999
1,7371980 to 1989
1,3221970 to 1979
1,855Before 1970
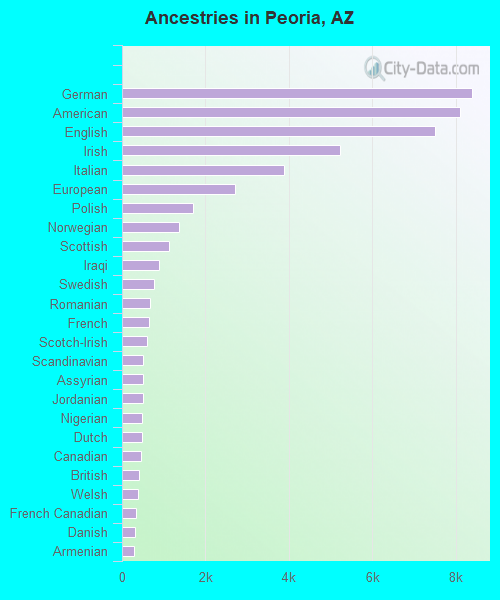
First ancestries reported:
German: 8,379 (9.2%)
American: 8,099 (8.9%)
English: 7,515 (8.2%)
Irish: 5,234 (5.7%)
Italian: 3,878 (4.2%)
European: 2,718 (3.0%)
Polish: 1,705 (1.9%)
Norwegian: 1,374 (1.5%)
Scottish: 1,120 (1.2%)
Iraqi: 885 (1.0%)
Swedish: 779 (0.9%)
Romanian: 661 (0.7%)
French: 643 (0.7%)
Scotch-Irish: 592 (0.6%)
Scandinavian: 514 (0.6%)
Assyrian: 504 (0.6%)
Jordanian: 503 (0.6%)
Nigerian: 472 (0.5%)
Dutch: 469 (0.5%)
Canadian: 446 (0.5%)
British: 418 (0.5%)
Welsh: 385 (0.4%)
French Canadian: 338 (0.4%)
Danish: 312 (0.3%)
Armenian: 283 (0.3%)
Greek: 275 (0.3%)
Finnish: 273 (0.3%)
Portuguese: 244 (0.3%)
Eastern European: 244 (0.3%)
Haitian: 238 (0.3%)
African: 210 (0.2%)
Hungarian: 183 (0.2%)
Russian: 173 (0.2%)
Yugoslavian: 170 (0.2%)
Afghan: 167 (0.2%)
Egyptian: 166 (0.2%)
Lebanese: 153 (0.2%)
Ethiopian: 145 (0.2%)
Ukrainian: 134 (0.1%)
Arab: 131 (0.1%)
Slavic: 125 (0.1%)
Serbian: 121 (0.1%)
Northern European: 121 (0.1%)
Macedonian: 109 (0.1%)
Croatian: 101 (0.1%)
Czech: 101 (0.1%)
Swiss: 85 (0.09%)
Slovak: 77 (0.08%)
Turkish: 75 (0.08%)
Austrian: 68 (0.07%)
Lithuanian: 61 (0.07%)
Estonian: 59 (0.06%)
Albanian: 48 (0.05%)
South African: 46 (0.05%)
Trinidadian and Tobagonian: 45 (0.05%)
Czechoslovakian: 44 (0.05%)
Pennsylvania German: 42 (0.05%)
Australian: 35 (0.04%)
Belgian: 35 (0.04%)
Iranian: 33 (0.04%)
Palestinian: 31 (0.03%)
Carpatho Rusyn: 27 (0.03%)
Sudanese: 26 (0.03%)
Syrian: 26 (0.03%)
Cape Verdean: 24 (0.03%)
Moroccan: 21 (0.02%)
Slovene: 14 (0.02%)
Bulgarian: 13 (0.01%)
Jamaican: 12 (0.01%)
Maltese: 11 (0.01%)
Ghanaian: 10 (0.01%)
Somali: 9 (0.01%)
Luxembourger: 8 (0.01%)
Zimbabwean: 7 (0.01%)
Brazilian: 6 (0.01%)
Most common places of birth for foreign-born residents (%):
Mexico
Peoria:
23.6% (5,083)
Arizona:
53.4% (500,086)
India
Peoria:
14.1% (3,045)
Arizona:
4.5% (41,719)
Iraq
Peoria:
7.7% (1,650)
Arizona:
1.0% (9,335)
Vietnam
Peoria:
5.7% (1,227)
Arizona:
2.1% (19,199)
Philippines
Peoria:
5.3% (1,139)
Arizona:
3.2% (30,378)
Canada
Peoria:
3.8% (812)
Arizona:
4.3% (40,102)
Cuba
Peoria:
3.2% (690)
Arizona:
1.0% (8,899)
Korea
Peoria:
2.6% (562)
Arizona:
1.2% (11,275)
China, excluding Hong Kong and Taiwan
Peoria:
2.4% (510)
Arizona:
2.3% (21,275)
Romania
Peoria:
2.3% (506)
Arizona:
0.6% (5,792)
Cambodia
Peoria:
1.8% (386)
Arizona:
0.2% (1,716)
Germany
Peoria:
1.7% (369)
Arizona:
1.5% (14,058)
Afghanistan
Peoria:
1.5% (330)
Arizona:
0.3% (2,420)
Place of birth for U.S.-born residents:
This state: 75,478
Other state: 95,519
Northeast: 14,848
Midwest: 33,315
South: 13,349
West: 34,007
88.1% of Peoria residents lived in the same house 1 years ago. Out of people who lived in different houses, 43.7% lived in this county. Out of people who lived in different counties, 10.5% lived in Arizona.
Peoria:
88.1%
State average:
86.0%
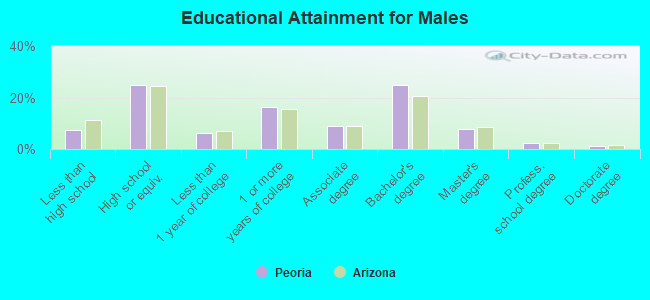
Education attainment for males 25 years and older:
No schooling: 1,355
Nursery to 4th grade: 173
5th and 6th grade: 429
7th and 8th grade: 385
9th grade: 0
10th grade: 705
11th grade: 630
12th grade, no diploma: 1,347
High school graduate (or equivalency): 16,874
Less than 1 year of college: 4,097
Some college more than 1 year, no degree: 11,137
Associate degree: 6,103
Bachelor's degree: 16,693
Master's degree: 5,195
Professional school degree: 1,667
Doctorate degree: 710
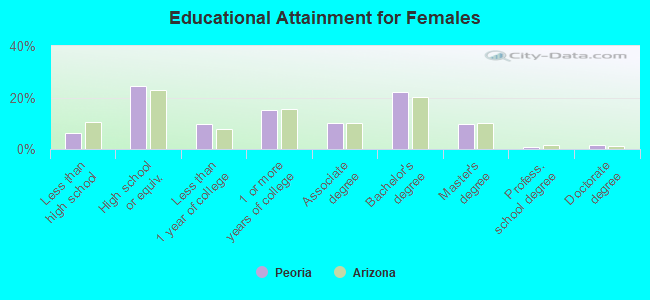
Education attainment for females 25 years and older:
No schooling: 979
Nursery to 4th grade: 328
5th and 6th grade: 160
7th and 8th grade: 174
9th grade: 133
10th grade: 1,085
11th grade: 563
12th grade, no diploma: 1,002
High school graduate (or equivalency): 17,306
Less than 1 year of college: 7,015
Some college more than 1 year, no degree: 10,769
Associate degree: 7,081
Bachelor's degree: 15,813
Master's degree: 7,009
Professional school degree: 598
Doctorate degree: 1,168
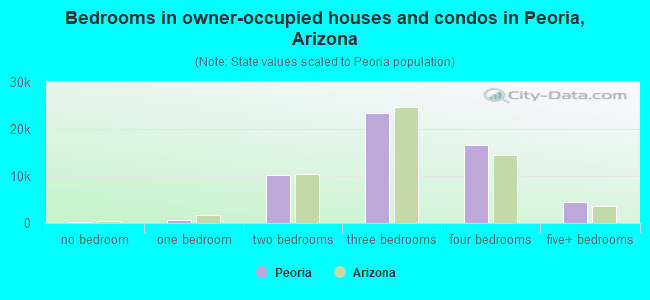
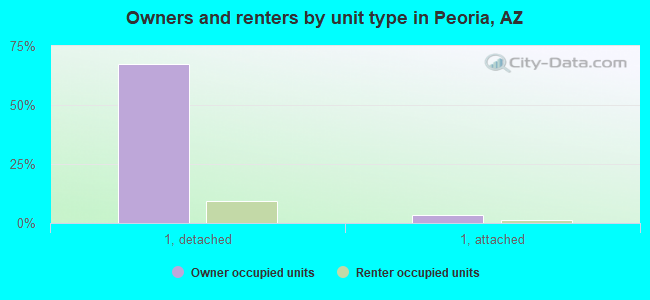
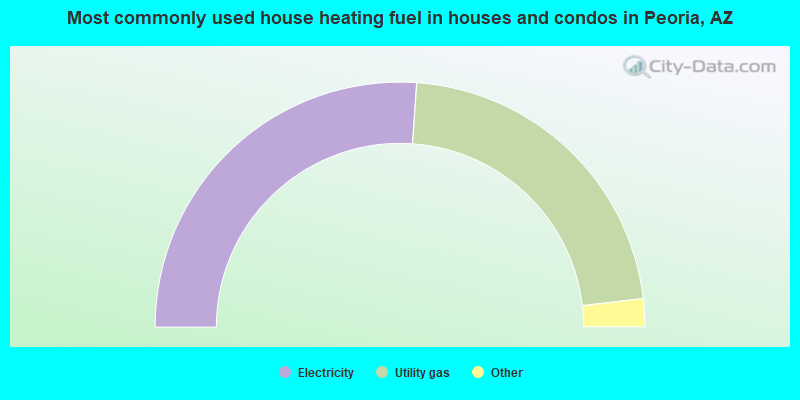
Housing units in structures:
One, detached: 59,339
One, attached: 4,246
Two: 406
3 or 4: 477
5 to 9: 1,386
10 to 19: 3,051
20 to 49: 1,195
50 or more: 5,580
Mobile homes: 3,763
Median worth of mobile homes: $46,300
Housing units lacking complete plumbing facilities in 2022: 0.4%
Housing units lacking complete kitchen facilities in 2022: 1.3%