Perryville, MD (Maryland) Houses and Residents
| Perryville: | $299,768 |
| Maryland: | $398,100 |
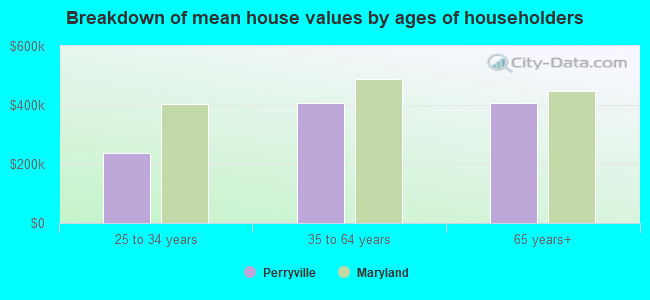
Mean price in 2022:
Detached houses: $417,593
Here: $417,593 State: $526,819 Townhouses or other attached units: $237,481
Here: $237,481 State: $328,305 In 5-or-more-unit structures: $299,296
Here: $299,296 State: $350,378
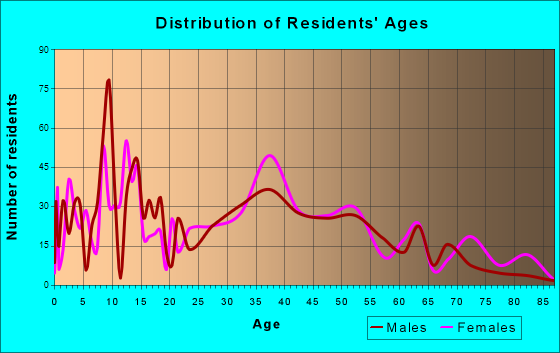
Total population: 4,429 (Urban population: 3,674, Rural population: 121 (all nonfarm))
Houses: 1,935 (1,668 occupied: 1,147 owner occupied, 561 renter occupied)
| % of renters here: | 33% |
| State: | 32% |
Housing density: 779 houses/condos per square mile
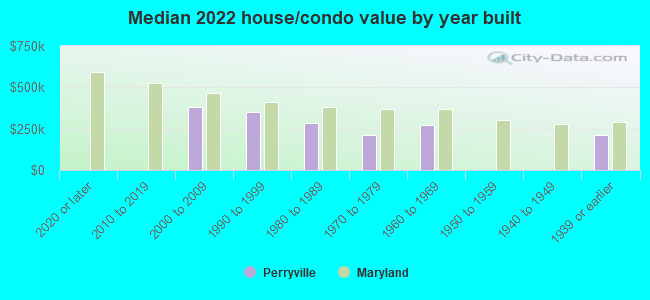
Median price asked for vacant for-sale houses and condos in 2022: $563,434.
Median contract rent in 2022: $984
Median rent asked for vacant for-rent units in 2022: $1,141
Median gross rent in Perryville, MD in 2022: $1,132
Housing units in Perryville with a mortgage: 800 (54 second mortgage, 0 home equity loan, 62 both second mortgage and home equity loan)
Houses without a mortgage: 0
Median household income for houses/condos with a mortgage: $112,322
Median household income for apartments without a mortgage: $111,320
Median monthly housing costs: $1,255
Compare current foreclosures near Perryville, MD:
| Photo | Address | Area | Beds / Baths | Price | Details |
|---|---|---|---|---|---|

|
#1
Jackson Station Rd
Perryville, MD 21903
|
1,863 sq. feet
|
3 baths - beds |
show details | |

|
#2
Cecil Ave
Perryville, MD 21903
|
1,320 sq. feet
|
3 baths - beds |
show details | |

|
#3
Concord Point Dr
Perryville, MD 21903
|
2,400 sq. feet
|
2 baths - beds |
show details | |

|
#4
Bayscape Dr
Perryville, MD 21903
|
1,836 sq. feet
|
2 baths - beds |
show details | |

|
#5
Cecil Ave
Perryville, MD 21903
|
1,058 sq. feet
|
1 baths - beds |
show details | |

|
#6
Starboard Ct
Perryville, MD 21903
|
1,350 sq. feet
|
1 baths - beds |
show details | |

|
#7
Cherry Ln
Perryville, MD 21903
|
991 sq. feet
|
1 baths - beds |
show details | |

|
#8
Bayscape Dr
Perryville, MD 21903
|
1,728 sq. feet
|
2 baths - beds |
show details | |

|
#9
Harford Square Dr
Edgewood, MD 21040
|
1,408 sq. feet
|
2 baths 3 beds |
$172,000
|
show details |

|
#10
Southridge Dr
Edgewood, MD 21040
|
1,244 sq. feet
|
2 baths 3 beds |
$344,900
|
show details |
| Photo | Address | Area | Beds / Baths | Price | Details |
|---|---|---|---|---|---|

|
#11
W Spring Meadow Ct
Edgewood, MD 21040
|
1,110 sq. feet
|
1 baths 2 beds |
$249,900
|
show details |

|
#12
Schoolview Ln
Oxford, PA 19363
|
3,504 sq. feet
|
2 baths 4 beds |
$346,389
|
show details |

|
#13
Quill Ct
Oxford, PA 19363
|
2,454 sq. feet
|
2 baths 3 beds |
$291,550
|
show details |

|
#14
Barnsley Rd
Oxford, PA 19363
|
1,288 sq. feet
|
1 baths 3 beds |
$176,718
|
show details |

|
#15
Red Pump Rd
Nottingham, PA 19362
|
725 sq. feet
|
1 baths 2 beds |
$211,586
|
show details |

|
#16
S 4th St
Oxford, PA 19363
|
- sq. feet
|
2 baths 3 beds |
show details | |

|
#17
Swamp Rd
Worton, MD 21678
|
760 sq. feet
|
1 baths 2 beds |
show details | |

|
#18
Media Rd
Oxford, PA 19363
|
1,155 sq. feet
|
1 baths 2 beds |
show details | |

|
#19
Sturgill Dr
Bel Air, MD 21015
|
680 sq. feet
|
2 baths 2 beds |
show details | |

|
#20
E Old Philadelphia Rd
Elkton, MD 21921
|
2,570 sq. feet
|
5 baths 4 beds |
show details |
| Photo | Address | Area | Beds / Baths | Price | Details |
|---|---|---|---|---|---|

|
#21
Robinhood Rd
Havre De Grace, MD 21078
|
3,250 sq. feet
|
2 baths 5 beds |
show details | |

|
#22
Merion Ct
Elkton, MD 21921
|
2,014 sq. feet
|
3 baths 3 beds |
show details | |

|
#23
Woodbine Ct
Forest Hill, MD 21050
|
2,400 sq. feet
|
2 baths 4 beds |
show details | |

|
#24
Liberty Grove Rd
Colora, MD 21917
|
4,212 sq. feet
|
3 baths 5 beds |
show details | |

|
#25
W Shore Dr
Edgewood, MD 21040
|
1,166 sq. feet
|
1 baths 3 beds |
show details | |

|
#26
Little Britain Church Rd
Peach Bottom, PA 17563
|
960 sq. feet
|
2 baths 2 beds |
show details | |

|
#27
Post Rd
Port Deposit, MD 21904
|
1,306 sq. feet
|
1 baths - beds |
show details | |

|
#28
Aarons Ln
Nottingham, PA 19362
|
- sq. feet
|
- baths - beds |
$331,583
|
show details |

|
#29
Salvia Ct
Bel Air, MD 21015
|
3,344 sq. feet
|
3 baths - beds |
show details | |

|
#30
Rocky Glen Rd
Oxford, PA 19363
|
2,191 sq. feet
|
2 baths 4 beds |
show details |
| Photo | Address | Area | Beds / Baths | Price | Details |
|---|---|---|---|---|---|

|
#31
Little Elk Creek Rd
Oxford, PA 19363
|
1,357 sq. feet
|
3 baths 3 beds |
show details | |

|
#32
Commerce St
Oxford, PA 19363
|
- sq. feet
|
- baths - beds |
$218,179
|
show details |

|
#33
Lincoln St
Oxford, PA 19363
|
1,872 sq. feet
|
1 baths 4 beds |
show details | |

|
#34
Robert Fulton Hwy
Peach Bottom, PA 17563
|
2,080 sq. feet
|
2 baths 4 beds |
show details | |

|
#35
Osborne Rd
Oxford, PA 19363
|
1,161 sq. feet
|
1 baths 3 beds |
show details | |

|
#36
Media Rd
Oxford, PA 19363
|
1,155 sq. feet
|
1 baths 2 beds |
show details | |

|
#37
Appleton Rd
Elkton, MD 21921
|
1,936 sq. feet
|
1 baths - beds |
show details | |

|
#38
Eagle Rd
Nottingham, PA 19362
|
1,232 sq. feet
|
1 baths 2 beds |
show details | |

|
#39
Oaks Rd
Oxford, PA 19363
|
1,890 sq. feet
|
2 baths 3 beds |
show details | |

|
#40
Pilgrims Pathway
Peach Bottom, PA 17563
|
1,958 sq. feet
|
2 baths 4 beds |
show details |
| Photo | Address | Area | Beds / Baths | Price | Details |
|---|---|---|---|---|---|

|
#41
Douglass Ct
Rising Sun, MD 21911
|
2,100 sq. feet
|
2 baths - beds |
show details | |

|
#42
Ebbtide Dr
Edgewood, MD 21040
|
2,130 sq. feet
|
3 baths - beds |
show details | |

|
#43
Continental Dr
Elkton, MD 21921
|
3,120 sq. feet
|
2 baths - beds |
show details | |

|
#44
Haven Pl
Edgewood, MD 21040
|
1,496 sq. feet
|
2 baths - beds |
show details | |

|
#45
Laurel Valley Ct
Abingdon, MD 21009
|
1,172 sq. feet
|
2 baths - beds |
show details | |

|
#46
Mahonia Way
Edgewood, MD 21040
|
1,933 sq. feet
|
2 baths - beds |
show details | |

|
#47
Valley Forge Way
Abingdon, MD 21009
|
1,920 sq. feet
|
2 baths - beds |
show details | |

|
#48
Vermont Pl
Bel Air, MD 21014
|
1,285 sq. feet
|
1 baths - beds |
show details | |

|
#49
Augustine Herman Hwy
Elkton, MD 21921
|
1,092 sq. feet
|
1 baths - beds |
show details | |

|
Check over 1 million property listings on Foreclosure.com!
|
browse all offers | |||

Latest news about housing in Perryville, MD collected exclusively by city-data.com from local newspapers, TV, and radio stations

 | Looking to buy a House in MD (71 replies) |
| Concord Apartments, Perryville, MD (1 reply) |
| Homes for rent in Cecil Co.? (1 reply) |
| National Harbor - News, Events, Updates, Questions and Developments Etc. (2062 replies) |
| Considering relocating to Northern MD (6 replies) |
| MGM Resorts strikes agreement to build casino at National Harbor near nation’s capital (622 replies) |
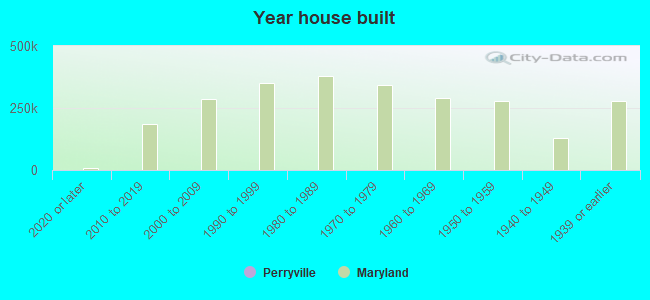
Median year apartment built: 1984
Household type by relationship:
Households: 4,443- Male householders: 765 (165 living alone), Female householders: 903 (321 living alone)
773 spouses (773 opposite-sex spouses), 163 unmarried partners, (163 opposite-sex unmarried partners), 1,198 children (947 natural, 40 adopted, 210 stepchildren), 296 grandchildren, 38 brothers or sisters, 147 parents, 0 foster children, 119 other relatives, 0 non-relatives
- In group quarters: 37
Size of family households: 405 2-persons, 374 3-persons, 143 4-persons, 126 5-persons, 37 6-persons, 87 7-or-more-persons.
Size of nonfamily households: 427 1-person, 88 2-persons.
365 married couples with children.
320 single-parent households (137 men, 183 women).
94.7% of residents of Perryville speak English at home.
2.0% of residents speak Spanish at home (88% speak English very well, 12% speak English well).
0.9% of residents speak other Indo-European language at home (100% speak English very well).
1.8% of residents speak other language at home (100% speak English very well).
Foreign born population: 72 (1.6%)
(130.6% of them are naturalized citizens)
| Here: | 7.7 |
| State: | 7.3 |
| Here: | 4.0 |
| State: | 4.2 |
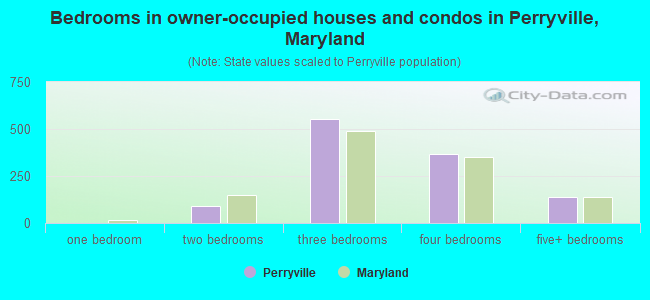
- Bedrooms in owner-occupied houses and condos in Perryville, Maryland
- 0no bedroom
- 01 bedroom
- 892 bedrooms
- 5543 bedrooms
- 3654 bedrooms
- 1405+ bedrooms
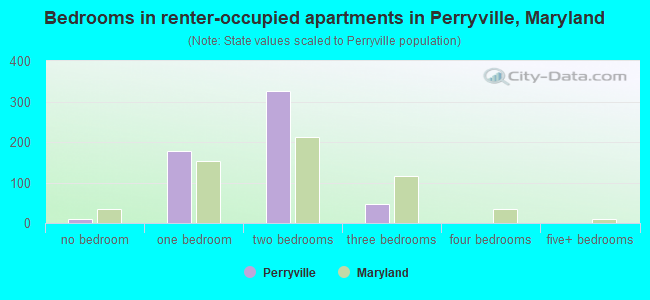
- Bedrooms in renter-occupied apartments in Perryville, Maryland
- 9no bedroom
- 1781 bedroom
- 3272 bedrooms
- 483 bedrooms
- 04 bedrooms
- 05+ bedrooms
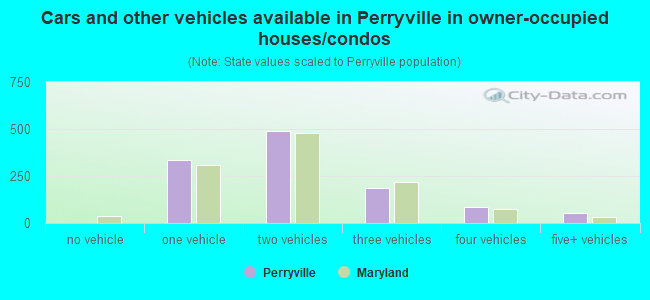
- Cars and other vehicles available in Perryville in owner-occupied houses/condos
- 0no vehicle
- 3361 vehicle
- 4892 vehicles
- 1863 vehicles
- 844 vehicles
- 525+ vehicles
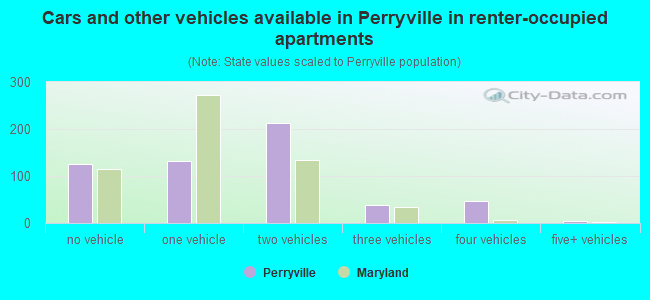
- Cars and other vehicles available in Perryville in renter-occupied apartments
- 126no vehicle
- 1321 vehicle
- 2132 vehicles
- 393 vehicles
- 464 vehicles
- 55+ vehicles
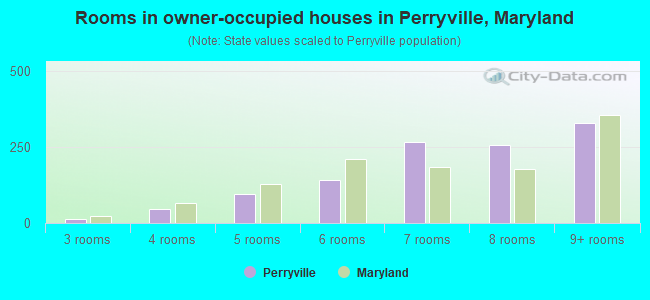
- Rooms in owner-occupied houses in Perryville, Maryland
- 01 room
- 02 rooms
- 143 rooms
- 474 rooms
- 955 rooms
- 1406 rooms
- 2667 rooms
- 2578 rooms
- 3299+ rooms
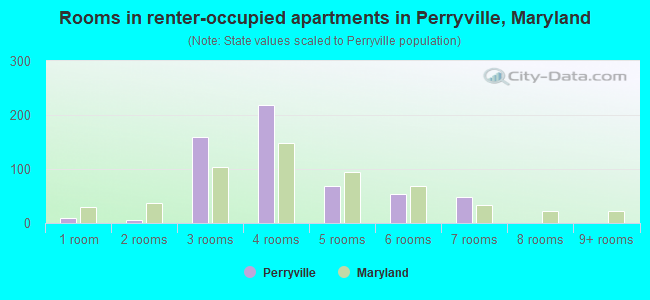
- Rooms in renter-occupied apartments in Perryville, Maryland
- 91 room
- 62 rooms
- 1593 rooms
- 2184 rooms
- 685 rooms
- 536 rooms
- 487 rooms
- 08 rooms
- 09+ rooms
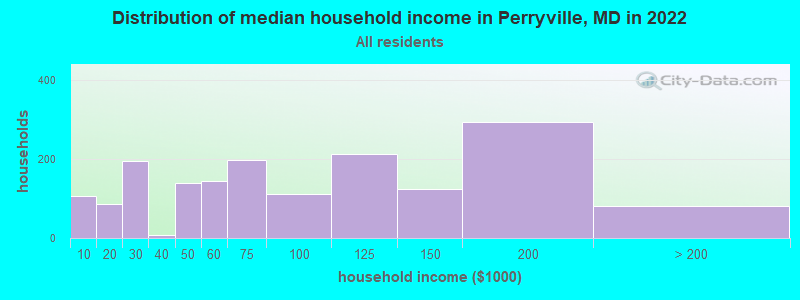
Perryville, MD household income distribution

- 105Less than $10,000
- 85$10,000 to $19,999
- 195$20,000 to $29,999
- 7$30,000 to $39,999
- 138$40,000 to $49,999
- 144$50,000 to $59,999
- 196$60,000 to $74,999
- 111$75,000 to $99,999
- 212$100,000 to $124,999
- 125$125,000 to $149,999
- 293$150,000 to $199,999
- 81$200,000 or more
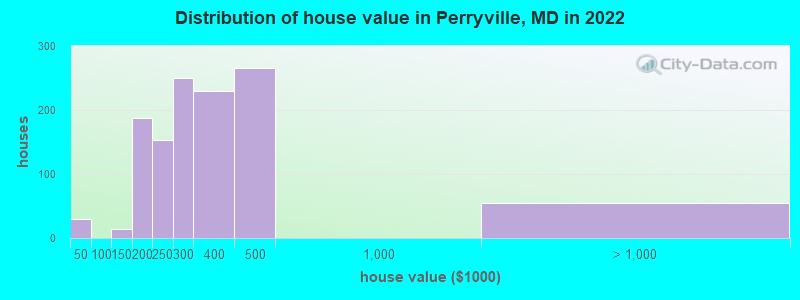
Home value of owner - occupied houses in 2022 in Perryville, MD
-
- 28Less than $10,000
- 14$125,000 to $149,999
- 99$150,000 to $174,999
- 87$175,000 to $199,999
- 152$200,000 to $249,999
- 250$250,000 to $299,999
- 229$300,000 to $399,999
- 266$400,000 to $499,999
- 53$1,500,000 to $1,999,999
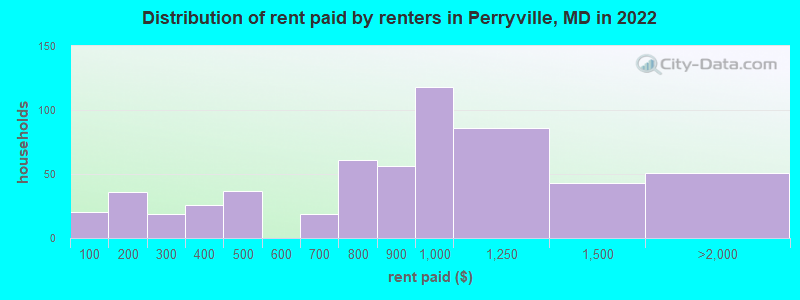
Rent paid by renters in 2022 in Perryville, MD
-
- 19Less than $100
- 35$150 to $199
- 13$200 to $249
- 5$250 to $299
- 25$350 to $399
- 37$400 to $449
- 18$650 to $699
- 60$700 to $749
- 55$800 to $899
- 118$900 to $999
- 85$1,000 to $1,249
- 42$1,250 to $1,499
- 51$1,500 to $1,999
Percentage of workers working in this county: 45.0%
Number of people working at home: 153 (7.1% of all workers)
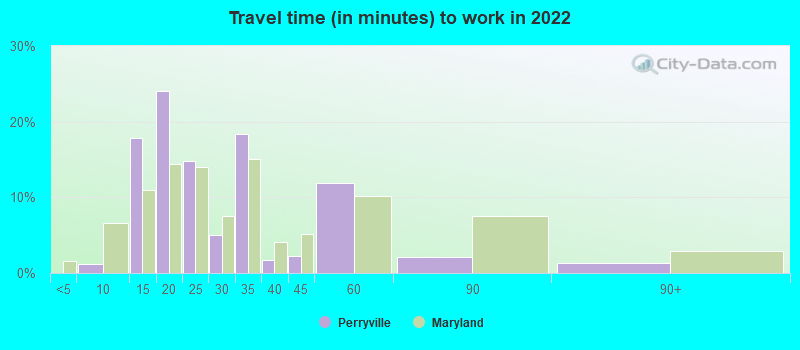
Travel time to work (commute)
- Less than 5 minutes: 0
- 5 to 9 minutes: 175
- 10 to 14 minutes: 248
- 15 to 19 minutes: 141
- 20 to 24 minutes: 537
- 25 to 29 minutes: 118
- 30 to 34 minutes: 287
- 35 to 39 minutes: 29
- 40 to 44 minutes: 60
- 45 to 59 minutes: 160
- 60 to 89 minutes: 111
- 90 or more minutes: 12
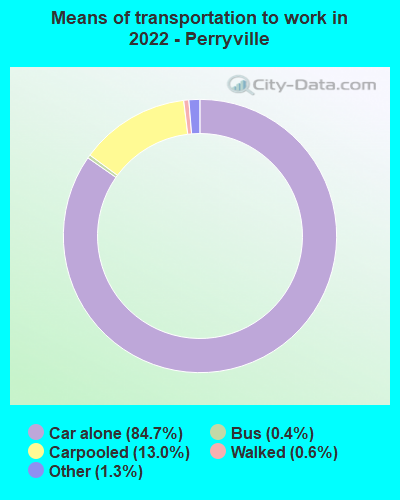
Means of transportation to work:
- Drove a car alone: 1,167 (74.0%)
- Carpooled: 190 (12.1%)
- Bus: 4 (0.3%)
- Taxi: 19 (1.2%)
- Walked: 8 (0.5%)
- Worked at home: 153 (9.7%)
- Unemployment by race in 2022
- Unemployment rate for White non-Hispanic residents
- 2.8%Males
- 5.8%Females
- Unemployment rate for Black residents
- 9.0%Males
- 2.7%Females
- Unemployment rate for two or more race residents
- 100.0%Females
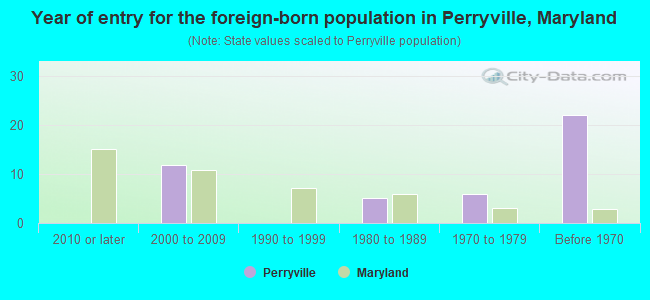
- Year of entry for the foreign-born population in Perryville, Maryland
- 02010 or later
- 122000 to 2009
- 01990 to 1999
- 51980 to 1989
- 61970 to 1979
- 22Before 1970
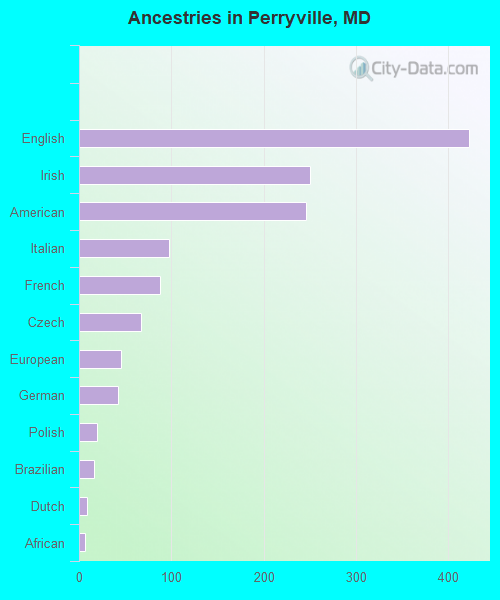
First ancestries reported:
- English: 423 (24.1%)
- Irish: 250 (14.3%)
- American: 246 (14.0%)
- Italian: 97 (5.5%)
- French: 88 (5.0%)
- Czech: 67 (3.8%)
- European: 46 (2.6%)
- German: 42 (2.4%)
- Polish: 19 (1.1%)
- Brazilian: 16 (0.9%)
- Dutch: 9 (0.5%)
- African: 6 (0.3%)
Most common places of birth for foreign-born residents (%):
| Perryville: | 71.1% (54) |
| Maryland: | 1.2% (11,265) |
| Perryville: | 14.5% (11) |
| Maryland: | 0.9% (8,603) |
| Perryville: | 11.8% (9) |
| Maryland: | 4.6% (44,825) |
Place of birth for U.S.-born residents:
- This state: 2,666
- Other state: 1,538
- Northeast: 793
- Midwest: 119
- South: 487
- West: 149
85.1% of Perryville residents lived in the same house 1 years ago.
Out of people who lived in different houses, 29.3% lived in this county.
Out of people who lived in different counties, 42.4% lived in Maryland.
| Perryville: | 85.1% |
| State average: | 88.5% |
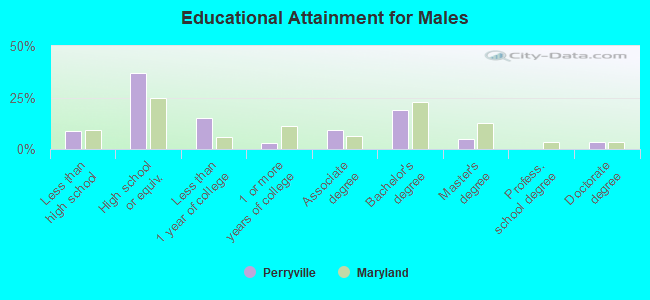
Education attainment for males 25 years and older:
- No schooling: 0
- Nursery to 4th grade: 0
- 5th and 6th grade: 0
- 7th and 8th grade: 17
- 9th grade: 0
- 10th grade: 19
- 11th grade: 0
- 12th grade, no diploma: 97
- High school graduate (or equivalency): 559
- Less than 1 year of college: 229
- Some college more than 1 year, no degree: 46
- Associate degree: 139
- Bachelor's degree: 292
- Master's degree: 73
- Professional school degree: 0
- Doctorate degree: 54
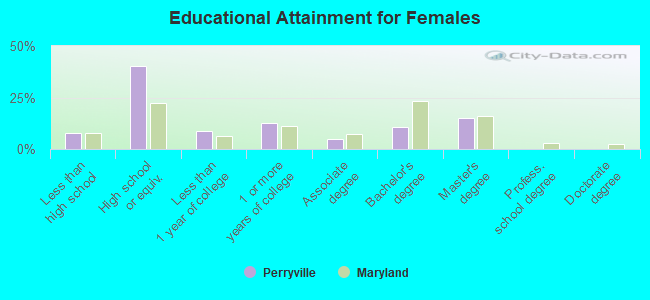
Education attainment for females 25 years and older:
- No schooling: 8
- Nursery to 4th grade: 0
- 5th and 6th grade: 0
- 7th and 8th grade: 38
- 9th grade: 16
- 10th grade: 30
- 11th grade: 20
- 12th grade, no diploma: 25
- High school graduate (or equivalency): 692
- Less than 1 year of college: 146
- Some college more than 1 year, no degree: 214
- Associate degree: 81
- Bachelor's degree: 186
- Master's degree: 258
- Professional school degree: 0
- Doctorate degree: 0
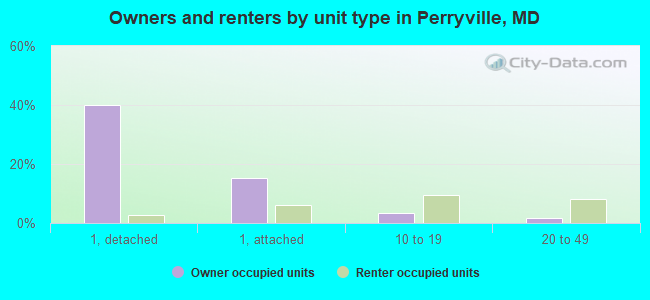
Housing units in structures:
- One, detached: 935
- One, attached: 291
- Two: 105
- 3 or 4: 40
- 5 to 9: 110
- 10 to 19: 220
- 20 to 49: 116
- 50 or more: 72
- Mobile homes: 44
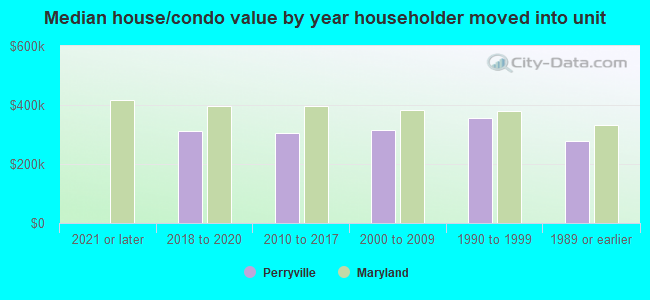
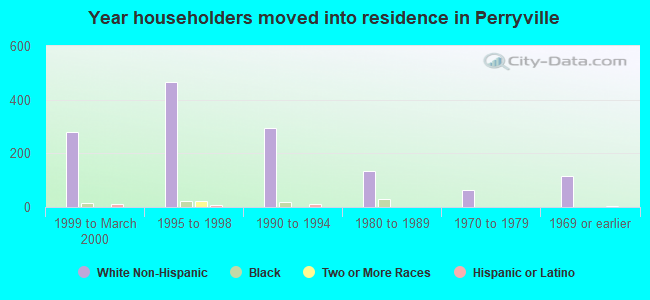
House/condo owner moved in on average 10 years ago
Renter moved in on average 3 years ago
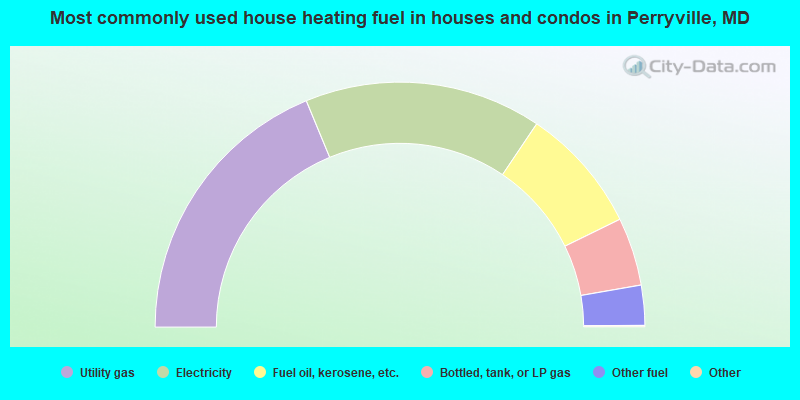
- 37.6%Utility gas
- 31.4%Electricity
- 16.7%Fuel oil, kerosene, etc.
- 9.0%Bottled, tank, or LP gas
- 5.3%Other fuel
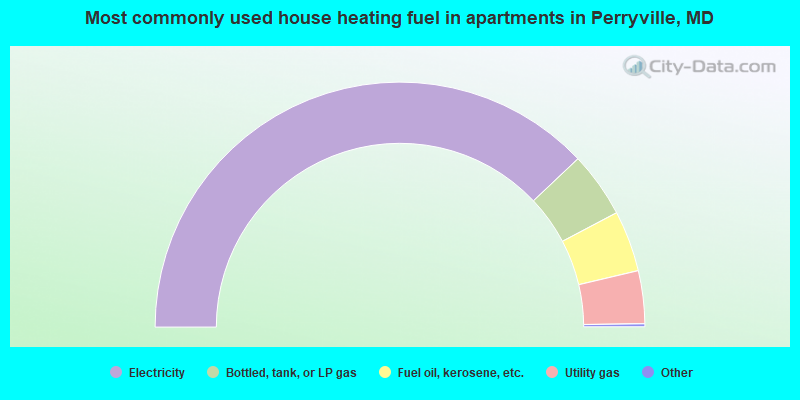
- 76.2%Electricity
- 8.7%Bottled, tank, or LP gas
- 8.1%Fuel oil, kerosene, etc.
- 7.0%Utility gas
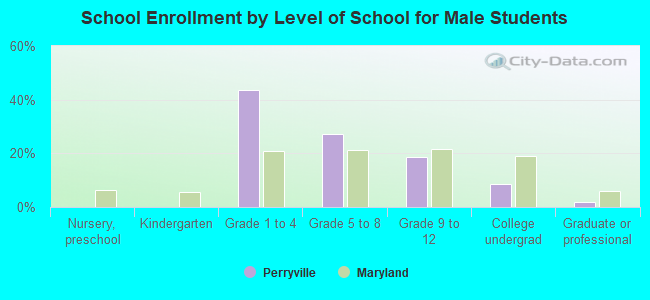
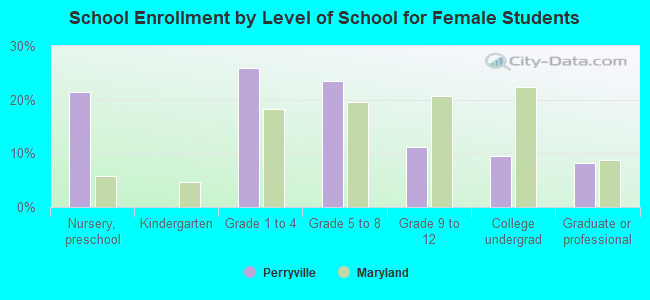
Private vs. public school enrollment:
| Here: | 4.5% |
| Maryland: | 15.2% |
| Here: | 0.0% |
| Maryland: | 14.4% |
| Here: | 0.0% |
| Maryland: | 20.2% |