Phillipsburg, NJ (New Jersey) Houses and Residents
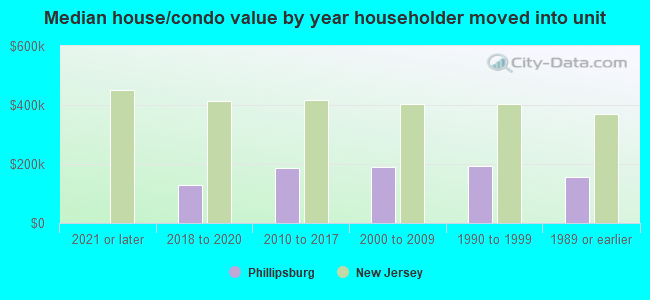
| Phillipsburg: | $182,352 |
| New Jersey: | $428,900 |
Total population: 14,570 (All urban)
Houses: 7,292 (6,643 occupied: 3,965 owner occupied, 2,806 renter occupied)
| % of renters here: | 41% |
| State: | 35% |
Housing density: 2,262 houses/condos per square mile
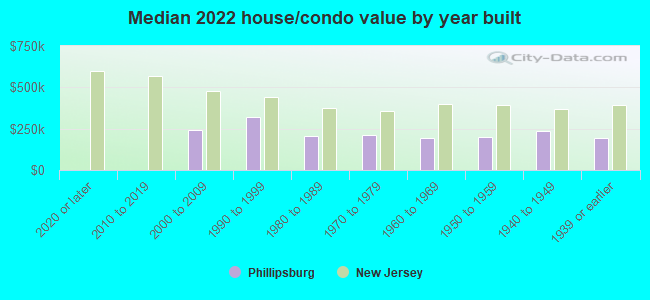
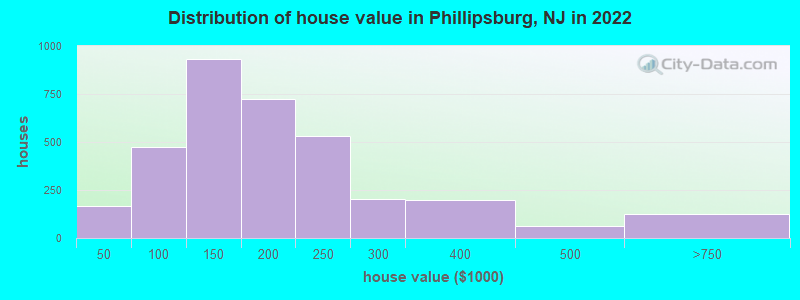
Median price asked for vacant for-sale houses and condos in 2022: $243,765.
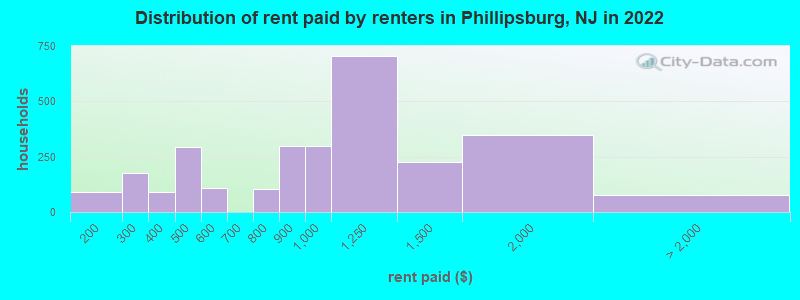
Median contract rent in 2022: $1,055 (lower quartile is $566, upper quartile is $1,343)
Median rent asked for vacant for-rent units in 2022: $3,059
Median gross rent in Phillipsburg, NJ in 2022: $1,197
Housing units in Phillipsburg with a mortgage: 2,555 (105 second mortgage, 0 home equity loan, 97 both second mortgage and home equity loan)
Houses without a mortgage: 99
Median household income for houses/condos with a mortgage: $84,228
Median household income for apartments without a mortgage: $66,236
Median monthly housing costs: $1,187
Compare current foreclosures in Phillipsburg, NJ:
| Photo | Address | Area | Beds / Baths | Price | Details |
|---|---|---|---|---|---|

|
#1
Glen Ave
Phillipsburg, NJ 08865
|
1,542 sq. feet
|
1 baths 3 beds |
$139,900
|
show details |

|
#2
Belvidere Rd
Phillipsburg, NJ 08865
|
2,154 sq. feet
|
2 baths 3 beds |
show details | |

|
#3
Mellicks Wood Rd
Phillipsburg, NJ 08865
|
936 sq. feet
|
1 baths 2 beds |
show details | |

|
#4
Grant Way
Phillipsburg, NJ 08865
|
2,440 sq. feet
|
- baths - beds |
show details | |

|
#5
E Central Ave
Phillipsburg, NJ 08865
|
1,680 sq. feet
|
- baths - beds |
show details | |

|
#6
Front St # 3
Phillipsburg, NJ 08865
|
- sq. feet
|
- baths - beds |
show details | |

|
#7
Filmore St
Phillipsburg, NJ 08865
|
1,632 sq. feet
|
- baths - beds |
show details | |

|
#8
E Central Ave
Phillipsburg, NJ 08865
|
- sq. feet
|
- baths - beds |
show details | |

|
#9
Red School Ln # D8
Phillipsburg, NJ 08865
|
- sq. feet
|
- baths - beds |
show details | |

|
#10
Francis St
Phillipsburg, NJ 08865
|
- sq. feet
|
- baths - beds |
show details |
| Photo | Address | Area | Beds / Baths | Price | Details |
|---|---|---|---|---|---|

|
#11
Lewis St
Phillipsburg, NJ 08865
|
1,659 sq. feet
|
- baths - beds |
show details | |

|
#12
Columbus Ave
Phillipsburg, NJ 08865
|
1,008 sq. feet
|
- baths - beds |
show details | |

|
#13
Mercer St
Phillipsburg, NJ 08865
|
1,638 sq. feet
|
- baths - beds |
show details | |

|
#14
S Main St
Phillipsburg, NJ 08865
|
1,608 sq. feet
|
- baths - beds |
show details | |

|
#15
Fleming Dr
Phillipsburg, NJ 08865
|
- sq. feet
|
- baths - beds |
show details | |

|
#16
Warren St
Phillipsburg, NJ 08865
|
1,320 sq. feet
|
- baths - beds |
show details | |

|
#17
Center St
Phillipsburg, NJ 08865
|
1,237 sq. feet
|
- baths - beds |
show details | |

|
#18
Wilson St
Phillipsburg, NJ 08865
|
1,200 sq. feet
|
- baths - beds |
show details | |

|
#19
Saint James Ave
Phillipsburg, NJ 08865
|
1,088 sq. feet
|
- baths - beds |
show details | |

|
#20
Warren St
Phillipsburg, NJ 08865
|
1,912 sq. feet
|
- baths - beds |
show details |
| Photo | Address | Area | Beds / Baths | Price | Details |
|---|---|---|---|---|---|

|
#21
Browning Ct
Phillipsburg, NJ 08865
|
1,928 sq. feet
|
- baths - beds |
show details | |

|
#22
Colby Pl
Phillipsburg, NJ 08865
|
1,528 sq. feet
|
- baths - beds |
show details | |

|
#23
Arlington Ave
Phillipsburg, NJ 08865
|
1,000 sq. feet
|
- baths - beds |
show details | |

|
#24
Ann St
Phillipsburg, NJ 08865
|
1,360 sq. feet
|
- baths - beds |
show details | |

|
#25
Warren St
Phillipsburg, NJ 08865
|
1,484 sq. feet
|
- baths - beds |
show details | |

|
#26
Chambers St
Phillipsburg, NJ 08865
|
1,323 sq. feet
|
- baths - beds |
show details | |

|
#27
Harmony Brass Castle Rd
Phillipsburg, NJ 08865
|
676 sq. feet
|
- baths - beds |
show details | |

|
#28
Summit Ave
Phillipsburg, NJ 08865
|
- sq. feet
|
- baths - beds |
show details | |

|
#29
Washington St
Phillipsburg, NJ 08865
|
2,972 sq. feet
|
- baths - beds |
show details | |

|
#30
County Road 519
Phillipsburg, NJ 08865
|
- sq. feet
|
- baths - beds |
show details |
| Photo | Address | Area | Beds / Baths | Price | Details |
|---|---|---|---|---|---|

|
#31
Lewis St
Phillipsburg, NJ 08865
|
1,652 sq. feet
|
- baths - beds |
show details | |

|
#32
Washington St
Phillipsburg, NJ 08865
|
1,350 sq. feet
|
- baths - beds |
show details | |

|
#33
Bates St
Phillipsburg, NJ 08865
|
1,481 sq. feet
|
- baths - beds |
show details | |

|
#34
Ann St
Phillipsburg, NJ 08865
|
1,360 sq. feet
|
- baths - beds |
show details | |

|
#35
Columbus Ave
Phillipsburg, NJ 08865
|
- sq. feet
|
- baths - beds |
show details | |

|
#36
Horseshoe Ct
Phillipsburg, NJ 08865
|
- sq. feet
|
- baths - beds |
show details | |

|
#37
Broad St
Phillipsburg, NJ 08865
|
- sq. feet
|
- baths - beds |
show details | |

|
#38
Filmore St
Phillipsburg, NJ 08865
|
1,868 sq. feet
|
- baths - beds |
show details | |

|
#39
Belvidere Rd
Phillipsburg, NJ 08865
|
- sq. feet
|
- baths - beds |
show details | |

|
#40
Manor Rd
Phillipsburg, NJ 08865
|
864 sq. feet
|
- baths - beds |
show details |
| Photo | Address | Area | Beds / Baths | Price | Details |
|---|---|---|---|---|---|

|
#41
Dana St
Phillipsburg, NJ 08865
|
1,332 sq. feet
|
- baths - beds |
show details | |

|
#42
Bullman St # B
Phillipsburg, NJ 08865
|
- sq. feet
|
- baths - beds |
show details | |

|
#43
Hope St
Phillipsburg, NJ 08865
|
- sq. feet
|
- baths - beds |
show details | |

|
#44
Irwin St
Phillipsburg, NJ 08865
|
1,080 sq. feet
|
- baths - beds |
show details | |

|
#45
Sitgreaves St
Phillipsburg, NJ 08865
|
2,376 sq. feet
|
- baths - beds |
show details | |

|
#46
2nd Ave
Phillipsburg, NJ 08865
|
1,548 sq. feet
|
- baths - beds |
show details | |

|
#47
Grant Way
Phillipsburg, NJ 08865
|
2,334 sq. feet
|
- baths - beds |
show details | |

|
#48
W Central Ave
Phillipsburg, NJ 08865
|
1,008 sq. feet
|
- baths - beds |
show details | |

|
#49
Rainbow Way
Phillipsburg, NJ 08865
|
1,632 sq. feet
|
- baths - beds |
show details | |

|
Check over 1 million property listings on Foreclosure.com!
|
browse all offers | |||

Latest news about housing in Phillipsburg, NJ collected exclusively by city-data.com from local newspapers, TV, and radio stations


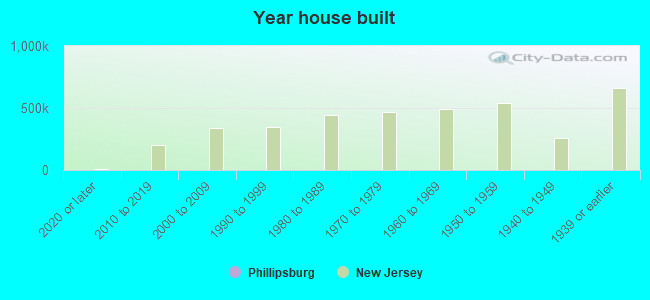
Median year apartment built: 1954
Household type by relationship:
Households: 15,370- Male householders: 2,941 (978 living alone), Female householders: 3,731 (1,457 living alone)
2,263 spouses (2,218 opposite-sex spouses), 642 unmarried partners, (642 opposite-sex unmarried partners), 4,584 children (4,184 natural, 30 adopted, 368 stepchildren), 194 grandchildren, 89 brothers or sisters, 101 parents, 73 foster children, 162 other relatives, 515 non-relatives
- In group quarters: 69
Size of family households: 1,827 2-persons, 886 3-persons, 775 4-persons, 342 5-persons, 160 6-persons, 13 7-or-more-persons.
Size of nonfamily households: 2,143 1-person, 444 2-persons, 23 3-persons, 43 4-persons, 30 5-persons.
1,482 married couples with children.
1,314 single-parent households (314 men, 1,000 women).
85.0% of residents of Phillipsburg speak English at home.
7.8% of residents speak Spanish at home (45% speak English very well, 23% speak English well, 24% speak English not well, 8% don't speak English at all).
2.2% of residents speak other Indo-European language at home (92% speak English very well, 8% speak English well).
0.9% of residents speak Asian or Pacific Island language at home (62% speak English very well, 10% speak English well, 28% speak English not well).
4.0% of residents speak other language at home (88% speak English very well, 7% speak English well, 5% speak English not well).
Foreign born population: 1,426 (9.3%)
(56.0% of them are naturalized citizens)
| Here: | 6.5 |
| State: | 6.8 |
| Here: | 4.6 |
| State: | 3.9 |
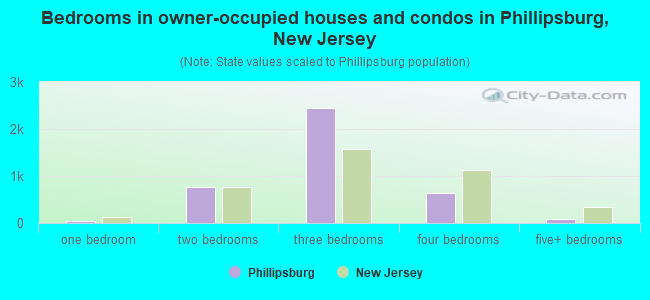
- Bedrooms in owner-occupied houses and condos in Phillipsburg, New Jersey
- 0no bedroom
- 431 bedroom
- 7582 bedrooms
- 2,4413 bedrooms
- 6384 bedrooms
- 855+ bedrooms
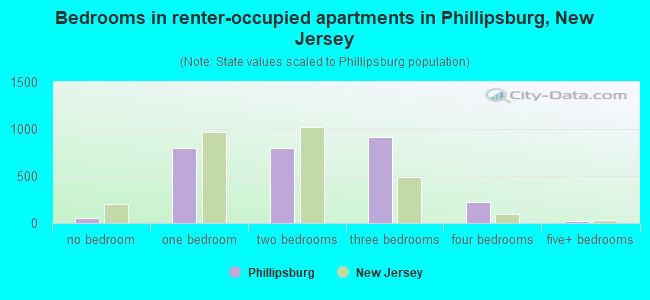
- Bedrooms in renter-occupied apartments in Phillipsburg, New Jersey
- 48no bedroom
- 7971 bedroom
- 7972 bedrooms
- 9203 bedrooms
- 2194 bedrooms
- 255+ bedrooms
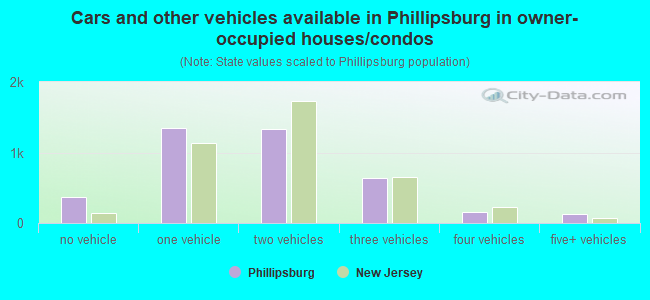
- Cars and other vehicles available in Phillipsburg in owner-occupied houses/condos
- 363no vehicle
- 1,3471 vehicle
- 1,3282 vehicles
- 6353 vehicles
- 1634 vehicles
- 1295+ vehicles
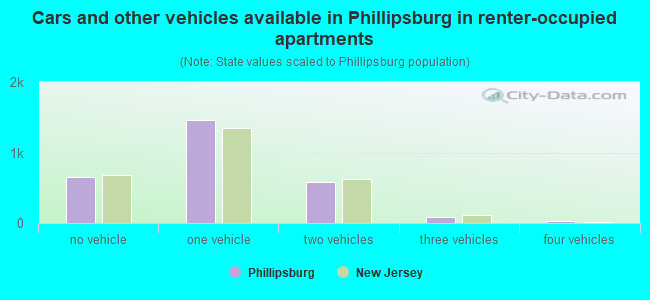
- Cars and other vehicles available in Phillipsburg in renter-occupied apartments
- 650no vehicle
- 1,4651 vehicle
- 5822 vehicles
- 813 vehicles
- 294 vehicles
- 05+ vehicles
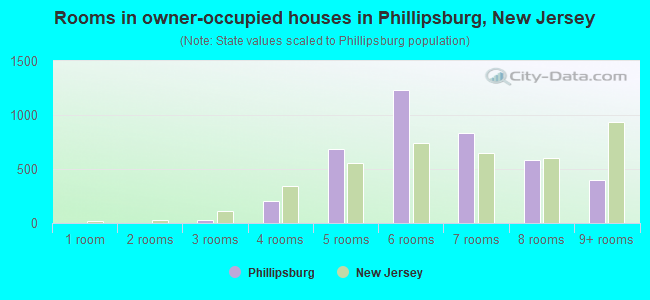
- Rooms in owner-occupied houses in Phillipsburg, New Jersey
- 01 room
- 02 rooms
- 323 rooms
- 2014 rooms
- 6815 rooms
- 1,2326 rooms
- 8327 rooms
- 5868 rooms
- 4029+ rooms
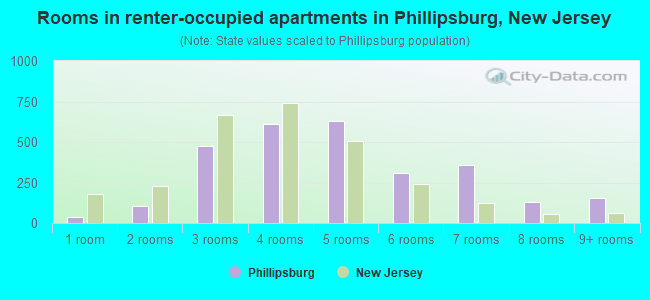
- Rooms in renter-occupied apartments in Phillipsburg, New Jersey
- 381 room
- 1022 rooms
- 4733 rooms
- 6134 rooms
- 6285 rooms
- 3076 rooms
- 3617 rooms
- 1298 rooms
- 1569+ rooms
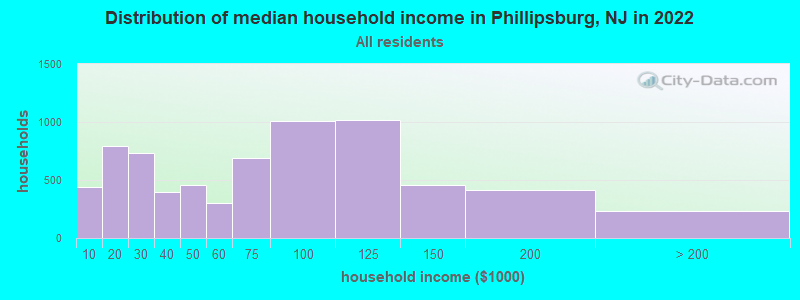
Phillipsburg, NJ household income distribution

- 440Less than $10,000
- 789$10,000 to $19,999
- 736$20,000 to $29,999
- 398$30,000 to $39,999
- 460$40,000 to $49,999
- 300$50,000 to $59,999
- 691$60,000 to $74,999
- 1,005$75,000 to $99,999
- 1,021$100,000 to $124,999
- 457$125,000 to $149,999
- 412$150,000 to $199,999
- 229$200,000 or more
Home value of owner - occupied houses in 2022 in Phillipsburg, NJ
-
- 46Less than $10,000
- 13$10,000 to $14,999
- 48$15,000 to $19,999
- 12$20,000 to $24,999
- 14$25,000 to $29,999
- 15$30,000 to $34,999
- 17$35,000 to $39,999
- 40$50,000 to $59,999
- 60$60,000 to $69,999
- 86$70,000 to $79,999
- 153$80,000 to $89,999
- 134$90,000 to $99,999
- 652$100,000 to $124,999
- 277$125,000 to $149,999
- 475$150,000 to $174,999
- 248$175,000 to $199,999
- 528$200,000 to $249,999
- 203$250,000 to $299,999
- 196$300,000 to $399,999
- 61$400,000 to $499,999
- 123$500,000 to $749,999
Rent paid by renters in 2022 in Phillipsburg, NJ
-
- 32$100 to $149
- 56$150 to $199
- 105$200 to $249
- 73$250 to $299
- 40$300 to $349
- 48$350 to $399
- 251$400 to $449
- 43$450 to $499
- 101$500 to $549
- 7$550 to $599
- 102$750 to $799
- 296$800 to $899
- 298$900 to $999
- 703$1,000 to $1,249
- 227$1,250 to $1,499
- 347$1,500 to $1,999
- 8$2,000 to $2,499
- 8$2,500 to $2,999
- 59No cash rent
Percentage of workers working in this county: 44.7%
Number of people working at home: 307 (4.2% of all workers)
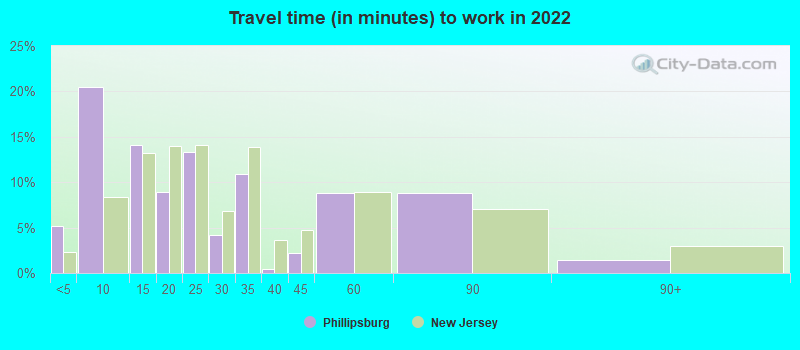
Travel time to work (commute)
- Less than 5 minutes: 257
- 5 to 9 minutes: 1,022
- 10 to 14 minutes: 1,061
- 15 to 19 minutes: 622
- 20 to 24 minutes: 793
- 25 to 29 minutes: 443
- 30 to 34 minutes: 890
- 35 to 39 minutes: 88
- 40 to 44 minutes: 432
- 45 to 59 minutes: 540
- 60 to 89 minutes: 788
- 90 or more minutes: 258
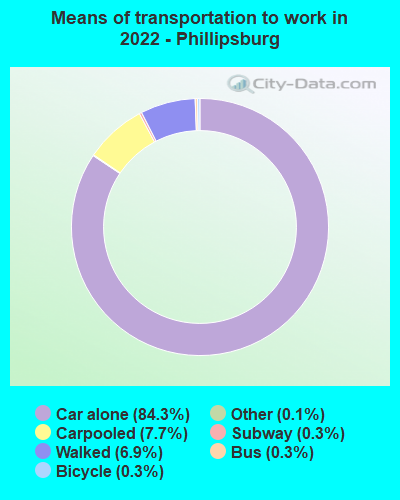
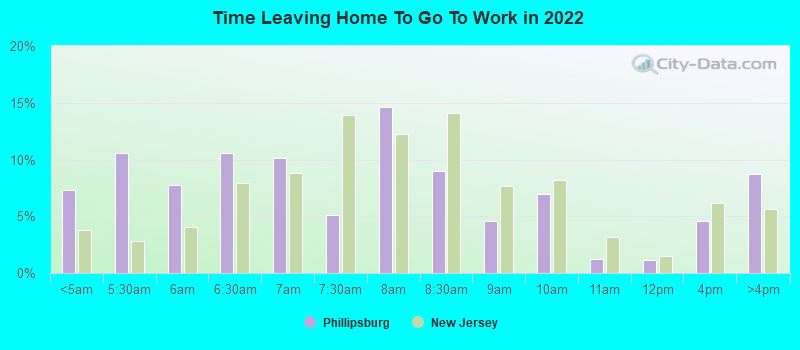
Means of transportation to work:
- Drove a car alone: 3,371 (74.6%)
- Carpooled: 355 (7.9%)
- Bus: 11 (0.2%)
- Long-distance train or commuter rail: 9 (0.2%)
- Taxi: 6 (0.1%)
- Bicycle: 14 (0.3%)
- Walked: 329 (7.3%)
- Worked at home: 307 (6.8%)
- Unemployment by race in 2022
- Unemployment rate for White non-Hispanic residents
- 3.2%Males
- 5.9%Females
- Unemployment rate for Black residents
- 3.1%Males
- 29.9%Females
- Unemployment rate for Asian residents
- 30.4%Males
- 16.1%Females
- Unemployment rate for other race residents
- 28.3%Females
- Unemployment rate for two or more race residents
- 4.4%Males
- Unemployment rate for Hispanic or Latino residents
- 5.9%Males
- 7.8%Females
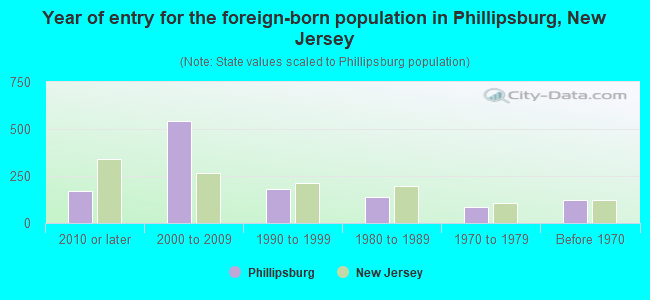
- Year of entry for the foreign-born population in Phillipsburg, New Jersey
- 1692010 or later
- 5442000 to 2009
- 1821990 to 1999
- 1391980 to 1989
- 861970 to 1979
- 122Before 1970
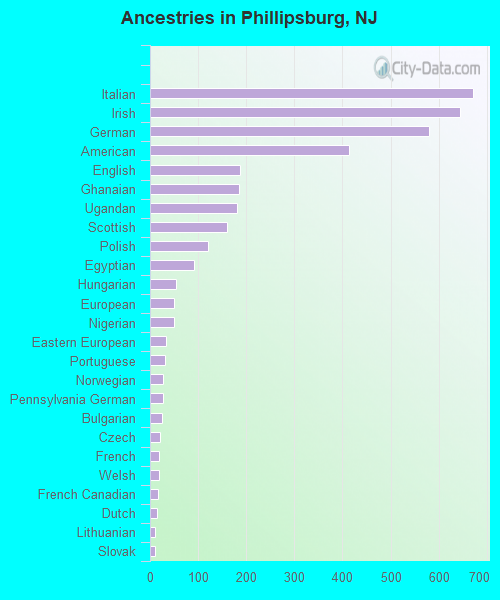
First ancestries reported:
- Italian: 671 (11.1%)
- Irish: 644 (10.7%)
- German: 579 (9.6%)
- American: 414 (6.9%)
- English: 187 (3.1%)
- Ghanaian: 186 (3.1%)
- Ugandan: 181 (3.0%)
- Scottish: 161 (2.7%)
- Polish: 120 (2.0%)
- Egyptian: 92 (1.5%)
- Hungarian: 54 (0.9%)
- European: 50 (0.8%)
- Nigerian: 50 (0.8%)
- Eastern European: 34 (0.6%)
- Portuguese: 31 (0.5%)
- Norwegian: 28 (0.5%)
- Pennsylvania German: 27 (0.4%)
- Bulgarian: 24 (0.4%)
- Czech: 21 (0.3%)
- French: 18 (0.3%)
- Welsh: 18 (0.3%)
- French Canadian: 16 (0.3%)
- Dutch: 15 (0.2%)
- Lithuanian: 11 (0.2%)
- Slovak: 11 (0.2%)
- Haitian: 11 (0.2%)
- Austrian: 10 (0.2%)
- Jamaican: 10 (0.2%)
- Danish: 9 (0.1%)
- Romanian: 9 (0.1%)
- Russian: 9 (0.1%)
- Guyanese: 6 (0.10%)
Most common places of birth for foreign-born residents (%):
| Phillipsburg: | 12.5% (149) |
| New Jersey: | 4.8% (102,527) |
| Phillipsburg: | 7.7% (92) |
| New Jersey: | 0.8% (17,949) |
| Phillipsburg: | 7.5% (89) |
| New Jersey: | 9.7% (209,055) |
| Phillipsburg: | 5.7% (68) |
| New Jersey: | 4.4% (95,275) |
| Phillipsburg: | 5.6% (66) |
| New Jersey: | 4.2% (90,817) |
| Phillipsburg: | 5.3% (63) |
| New Jersey: | 1.6% (33,678) |
| Phillipsburg: | 4.8% (57) |
| New Jersey: | 0.7% (14,405) |
| Phillipsburg: | 4.8% (57) |
| New Jersey: | 3.7% (78,969) |
| Phillipsburg: | 4.8% (57) |
| New Jersey: | 0.1% (1,291) |
| Phillipsburg: | 4.7% (56) |
| New Jersey: | 2.1% (46,020) |
| Phillipsburg: | 4.0% (47) |
| New Jersey: | 0.7% (14,848) |
| Phillipsburg: | 3.8% (45) |
| New Jersey: | 1.2% (26,173) |
| Phillipsburg: | 3.7% (44) |
| New Jersey: | 2.7% (58,563) |
| Phillipsburg: | 3.6% (43) |
| New Jersey: | 1.3% (27,580) |
| Phillipsburg: | 3.2% (38) |
| New Jersey: | 4.0% (85,934) |
| Phillipsburg: | 2.8% (33) |
| New Jersey: | 2.2% (47,365) |
| Phillipsburg: | 2.4% (28) |
| New Jersey: | 0.6% (12,793) |
| Phillipsburg: | 2.2% (26) |
| New Jersey: | 2.3% (48,885) |
| Phillipsburg: | 2.1% (25) |
| New Jersey: | 2.3% (49,491) |
| Phillipsburg: | 1.7% (20) |
| New Jersey: | 0.2% (3,249) |
| Phillipsburg: | 1.7% (20) |
| New Jersey: | 2.2% (46,813) |
Place of birth for U.S.-born residents:
- This state: 9,310
- Other state: 4,209
- Northeast: 3,444
- Midwest: 81
- South: 518
- West: 109
91.1% of Phillipsburg residents lived in the same house 1 years ago.
Out of people who lived in different houses, 19.9% lived in this county.
Out of people who lived in different counties, 78.0% lived in New Jersey.
| Phillipsburg: | 91.1% |
| State average: | 90.4% |
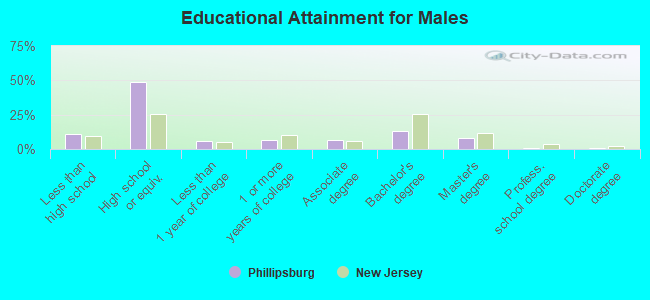
Education attainment for males 25 years and older:
- No schooling: 202
- Nursery to 4th grade: 12
- 5th and 6th grade: 31
- 7th and 8th grade: 69
- 9th grade: 35
- 10th grade: 62
- 11th grade: 99
- 12th grade, no diploma: 40
- High school graduate (or equivalency): 2,522
- Less than 1 year of college: 300
- Some college more than 1 year, no degree: 329
- Associate degree: 328
- Bachelor's degree: 685
- Master's degree: 432
- Professional school degree: 19
- Doctorate degree: 35
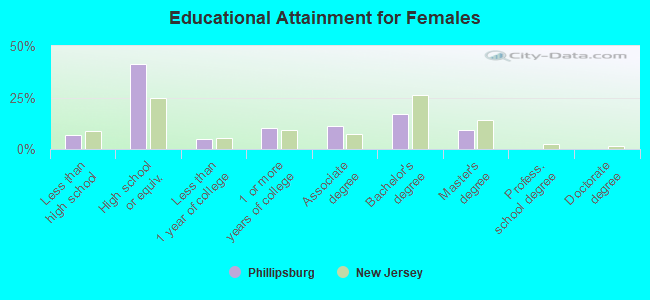
Education attainment for females 25 years and older:
- No schooling: 45
- Nursery to 4th grade: 12
- 5th and 6th grade: 38
- 7th and 8th grade: 39
- 9th grade: 27
- 10th grade: 38
- 11th grade: 91
- 12th grade, no diploma: 84
- High school graduate (or equivalency): 2,292
- Less than 1 year of college: 267
- Some college more than 1 year, no degree: 575
- Associate degree: 619
- Bachelor's degree: 947
- Master's degree: 507
- Professional school degree: 7
- Doctorate degree: 0
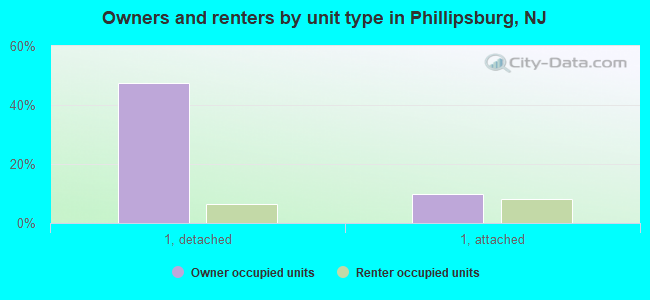
Housing units in structures:
- One, detached: 3,949
- One, attached: 1,507
- Two: 558
- 3 or 4: 368
- 5 to 9: 166
- 10 to 19: 246
- 20 to 49: 108
- 50 or more: 387
Housing units lacking complete kitchen facilities in 2022: 1.2%
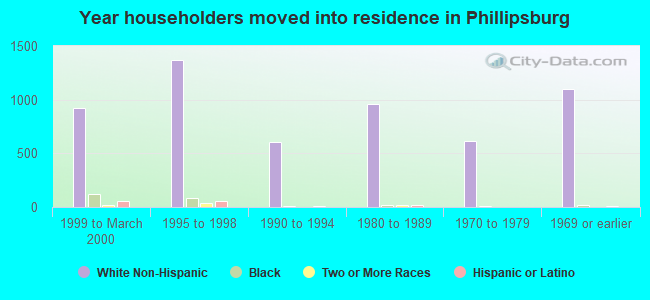
House/condo owner moved in on average 19 years ago
Renter moved in on average 3 years ago
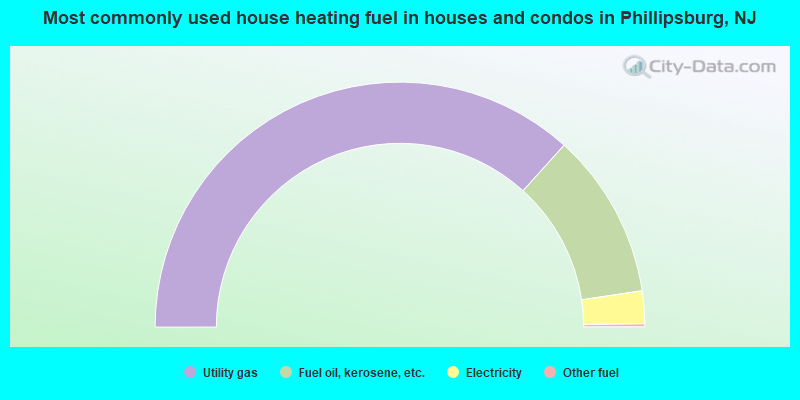
- 73.4%Utility gas
- 21.9%Fuel oil, kerosene, etc.
- 4.3%Electricity
- 0.4%Other fuel
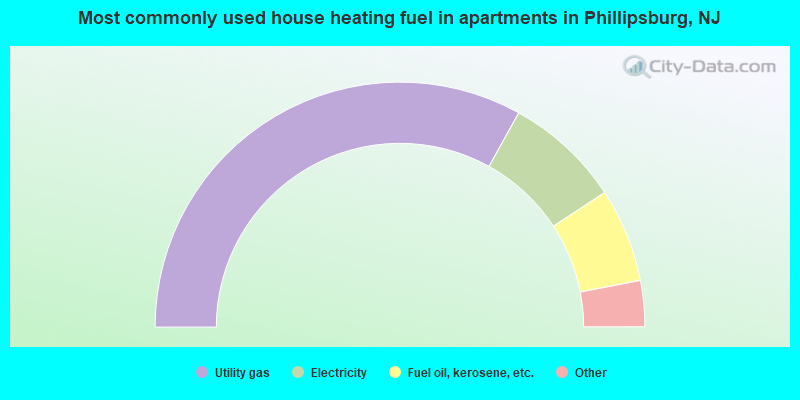
- 66.2%Utility gas
- 15.4%Electricity
- 12.4%Fuel oil, kerosene, etc.
- 2.9%No fuel used
- 1.8%Bottled, tank, or LP gas
- 1.4%Other fuel
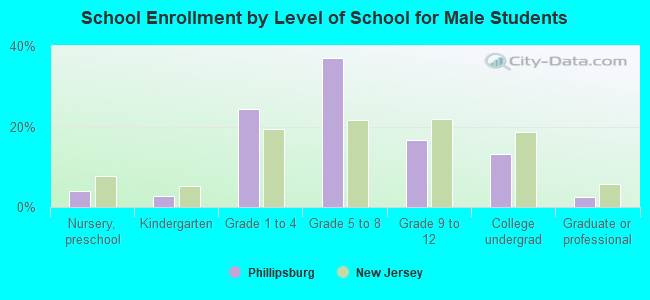
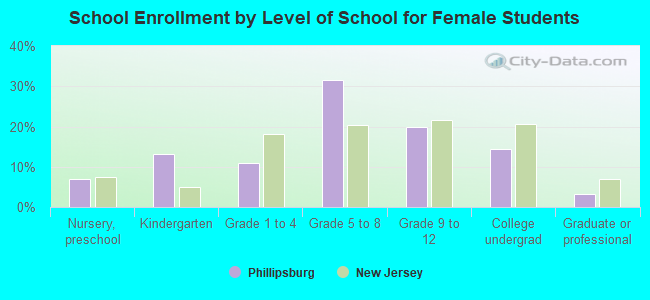
Private vs. public school enrollment:
| Here: | 21.7% |
| New Jersey: | 12.3% |
| Here: | 5.7% |
| New Jersey: | 13.1% |
| Here: | 22.5% |
| New Jersey: | 33.2% |