Pittsfield, NH (New Hampshire) Houses and Residents
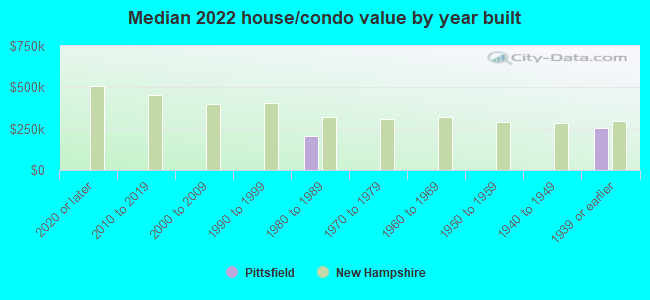
| Pittsfield: | $232,629 |
| New Hampshire: | $384,700 |
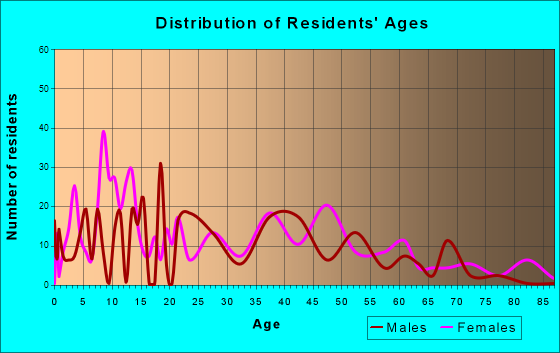
Total population: 1,576 (Urban population: 0, Rural population: 1,726 (all nonfarm))
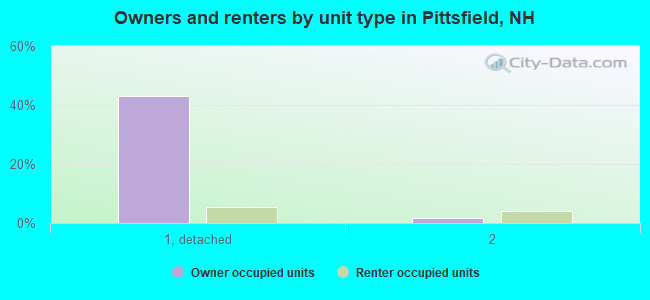
Houses: 1,020 (935 occupied: 447 owner occupied, 509 renter occupied)
| % of renters here: | 53% |
| State: | 28% |
Housing density: 629 houses/condos per square mile
Median price asked for vacant for-sale houses and condos in 2022 in this county: $157,149.
Median contract rent in 2022: $911 (lower quartile is $744, upper quartile is $1,147)
Median rent asked for vacant for-rent units in 2022: $884
Median gross rent in Pittsfield, NH in 2022: $1,038
Housing units in Pittsfield with a mortgage: 278 (5 second mortgage, 0 home equity loan, 6 both second mortgage and home equity loan)
Houses without a mortgage: 0
Median household income for houses/condos with a mortgage: $97,651
Median monthly housing costs: $1,090
Compare current foreclosures near Pittsfield, NH:
| Photo | Address | Area | Beds / Baths | Price | Details |
|---|---|---|---|---|---|

|
#1
Fairview Road Aka 42 Fairview Drive
Pittsfield, NH Array
|
2,078 sq. feet
|
2 baths 3 beds |
show details | |

|
#2
Dowboro Rd
Pittsfield, NH 03263
|
- sq. feet
|
- baths - beds |
show details | |

|
#3
Fairview Dr
Pittsfield, NH 03263
|
- sq. feet
|
- baths - beds |
show details | |

|
#4
Hilltop Dr
Pittsfield, NH 03263
|
- sq. feet
|
- baths - beds |
show details | |

|
#5
Tilton Hill Rd
Pittsfield, NH 03263
|
- sq. feet
|
- baths - beds |
show details | |

|
#6
Fisherville Rd Unit 21
Concord, NH 03303
|
990 sq. feet
|
1 baths 2 beds |
show details | |

|
#7
Portsmouth St
Concord, NH 03301
|
1,184 sq. feet
|
2 baths 3 beds |
show details | |

|
#8
Old Turnpike Rd
Nottingham, NH 03290
|
4,738 sq. feet
|
3 baths 3 beds |
show details | |

|
#9
Tasker Hill Rd
Strafford, NH 03884
|
2,630 sq. feet
|
3 baths 3 beds |
show details | |

|
#10
Mcdaniel Shore Dr
Barrington, NH 03825
|
2,681 sq. feet
|
1 baths 3 beds |
show details |
| Photo | Address | Area | Beds / Baths | Price | Details |
|---|---|---|---|---|---|

|
#11
Charles St
Farmington, NH 03835
|
1,066 sq. feet
|
1 baths 3 beds |
show details | |

|
#12
Frank C Gilman Hwy
Alton, NH 03809
|
1,712 sq. feet
|
1 baths 3 beds |
show details | |

|
#13
1st Crown Point Rd
Strafford, NH 03884
|
1,738 sq. feet
|
1 baths 3 beds |
show details | |

|
#14
Academy Rd
Suncook, NH 03275
|
1,428 sq. feet
|
1 baths 3 beds |
show details | |

|
#15
Roller Coaster Rd
Strafford, NH 03884
|
2,530 sq. feet
|
3 baths 6 beds |
show details | |

|
#16
N State St
Concord, NH 03301
|
6,861 sq. feet
|
7 baths 5 beds |
show details | |

|
#17
1st Nh Tpke
Northwood, NH 03261
|
3,778 sq. feet
|
2 baths 6 beds |
show details | |

|
#18
Richmond Dr
Concord, NH 03303
|
1,776 sq. feet
|
2 baths 3 beds |
show details | |

|
#19
Meaderboro Rd
Rochester, NH 03867
|
- sq. feet
|
2 baths 3 beds |
show details | |

|
#20
S Fruit St
Concord, NH 03301
|
1,768 sq. feet
|
2 baths 4 beds |
show details |
| Photo | Address | Area | Beds / Baths | Price | Details |
|---|---|---|---|---|---|

|
#21
Adams St
Laconia, NH 03246
|
1,956 sq. feet
|
1 baths 3 beds |
show details | |

|
#22
Province St
Laconia, NH 03246
|
818 sq. feet
|
1 baths 2 beds |
show details | |

|
#23
Denmark Dr
Northwood, NH 03261
|
1,809 sq. feet
|
2 baths 3 beds |
show details | |

|
#24
Abbott Rd
Concord, NH 03303
|
1,386 sq. feet
|
1 baths 2 beds |
show details | |

|
#25
Pinnacle St
Hooksett, NH 03106
|
2,238 sq. feet
|
2 baths 3 beds |
show details | |

|
#26
Thurston Pond Rd
Deerfield, NH 03037
|
- sq. feet
|
2 baths 3 beds |
show details | |

|
#27
Union Ave
Laconia, NH 03246
|
6,055 sq. feet
|
2 baths - beds |
show details | |

|
#28
Berry River Rd
Barrington, NH 03825
|
- sq. feet
|
- baths - beds |
show details | |

|
#29
Alice Dr Apt 108
Concord, NH 03303
|
- sq. feet
|
- baths - beds |
show details | |

|
#30
Clark St
Belmont, NH 03220
|
960 sq. feet
|
- baths - beds |
show details |
| Photo | Address | Area | Beds / Baths | Price | Details |
|---|---|---|---|---|---|

|
#31
Juniper Ln
Bow, NH 03304
|
- sq. feet
|
- baths - beds |
show details | |

|
#32
Cabernet Dr Unit 2
Concord, NH 03303
|
- sq. feet
|
- baths - beds |
show details | |

|
#33
School St
Suncook, NH 03275
|
- sq. feet
|
- baths - beds |
show details | |

|
#34
Landing Ln # 131
Laconia, NH 03246
|
- sq. feet
|
- baths - beds |
show details | |

|
#35
Wethersfield Dr
Tilton, NH 03276
|
- sq. feet
|
- baths - beds |
show details | |

|
#36
Marilyn Dr
Suncook, NH 03275
|
- sq. feet
|
- baths - beds |
show details | |

|
#37
Prospect St Apt 2
Tilton, NH 03276
|
- sq. feet
|
- baths - beds |
show details | |

|
#38
Canal St # 415
Suncook, NH 03275
|
- sq. feet
|
- baths - beds |
show details | |

|
#39
Horne Rd
Belmont, NH 03220
|
1,491 sq. feet
|
- baths - beds |
show details | |

|
#40
France Rd
Barrington, NH 03825
|
- sq. feet
|
- baths - beds |
show details |
| Photo | Address | Area | Beds / Baths | Price | Details |
|---|---|---|---|---|---|

|
#41
Corn Hill Rd
Concord, NH 03303
|
- sq. feet
|
- baths - beds |
show details | |

|
#42
Mcdaniel Shore Dr
Barrington, NH 03825
|
- sq. feet
|
- baths - beds |
show details | |

|
#43
Sand Hill Rd
Gilford, NH 03249
|
- sq. feet
|
- baths - beds |
show details | |

|
#44
Durkee St # B
Laconia, NH 03246
|
- sq. feet
|
- baths - beds |
show details | |

|
#45
Union Rd
Belmont, NH 03220
|
1,104 sq. feet
|
- baths - beds |
show details | |

|
#46
Bay Hill Rd # 1
Tilton, NH 03276
|
- sq. feet
|
- baths - beds |
show details | |

|
#47
Ferry St # 1
Suncook, NH 03275
|
- sq. feet
|
- baths - beds |
show details | |

|
#48
Academy St Apt 3
Laconia, NH 03246
|
- sq. feet
|
- baths - beds |
show details | |

|
#49
Karen Dr
Belmont, NH 03220
|
1,920 sq. feet
|
- baths - beds |
show details | |

|
Check over 1 million property listings on Foreclosure.com!
|
browse all offers | |||

Latest news about housing in Pittsfield, NH collected exclusively by city-data.com from local newspapers, TV, and radio stations

 | Searching for area with unique homes. (24 replies) |
| Pittsfield NH (7 replies) |
| Why is household median income so high in New Hampshire? (31 replies) |
| Can you recommend a place in NH for a 30 year old single man? (42 replies) |
| Thinking of moving to New Hampshire from WA (40 replies) |
| Love everything about this state but... (130 replies) |
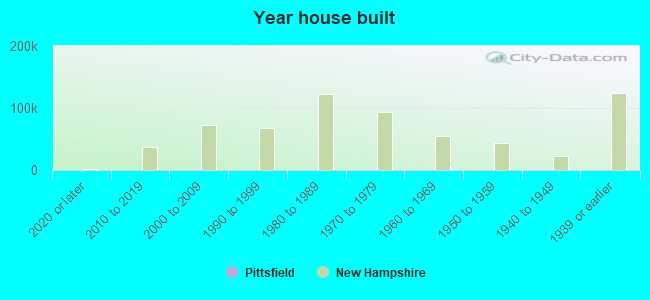
Median year apartment built: 1944
Household type by relationship:
Households: 1,808- Male householders: 404 (153 living alone), Female householders: 532 (274 living alone)
372 spouses (372 opposite-sex spouses), 96 unmarried partners, (96 opposite-sex unmarried partners), 257 children (217 natural, 22 adopted, 17 stepchildren), 41 grandchildren, 0 brothers or sisters, 48 parents, 0 foster children, 27 other relatives, 28 non-relatives
Size of family households: 286 2-persons, 53 3-persons, 46 4-persons, 35 5-persons, 9 7-or-more-persons.
Size of nonfamily households: 471 1-person, 83 2-persons.
58 married couples with children.
60 single-parent households (0 men, 60 women).
98.9% of residents of Pittsfield speak English at home.
1.7% of residents speak other Indo-European language at home (100% speak English very well).
Foreign born population: 26 (1.4%)
(65.4% of them are naturalized citizens)
| Here: | 6.2 |
| State: | 6.4 |
| Here: | 3.4 |
| State: | 4.0 |
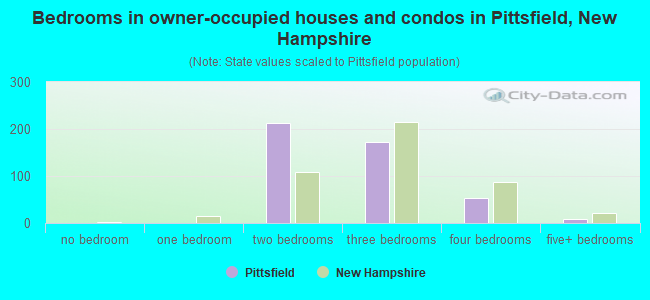
- Bedrooms in owner-occupied houses and condos in Pittsfield, New Hampshire
- 0no bedroom
- 01 bedroom
- 2132 bedrooms
- 1723 bedrooms
- 544 bedrooms
- 85+ bedrooms
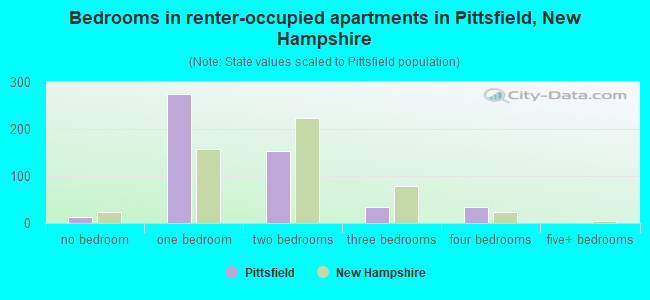
- Bedrooms in renter-occupied apartments in Pittsfield, New Hampshire
- 12no bedroom
- 2741 bedroom
- 1532 bedrooms
- 353 bedrooms
- 354 bedrooms
- 05+ bedrooms
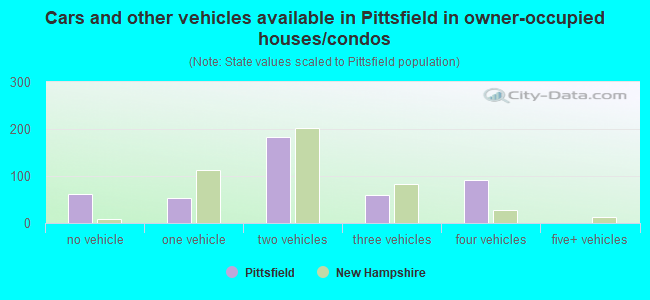
- Cars and other vehicles available in Pittsfield in owner-occupied houses/condos
- 61no vehicle
- 531 vehicle
- 1822 vehicles
- 593 vehicles
- 924 vehicles
- 05+ vehicles
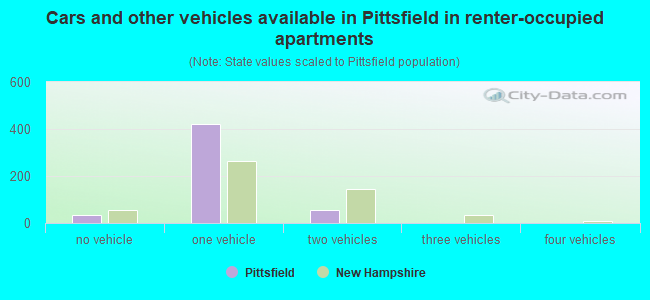
- Cars and other vehicles available in Pittsfield in renter-occupied apartments
- 34no vehicle
- 4221 vehicle
- 542 vehicles
- 03 vehicles
- 04 vehicles
- 05+ vehicles
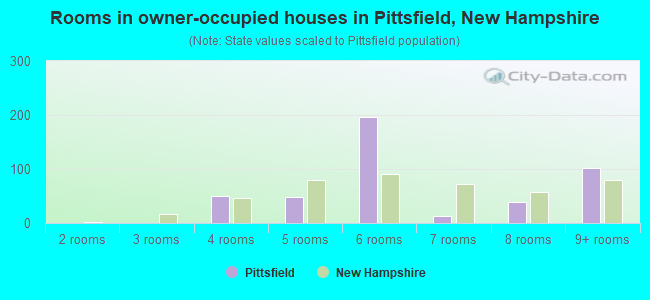
- Rooms in owner-occupied houses in Pittsfield, New Hampshire
- 01 room
- 02 rooms
- 03 rooms
- 504 rooms
- 495 rooms
- 1966 rooms
- 137 rooms
- 388 rooms
- 1029+ rooms
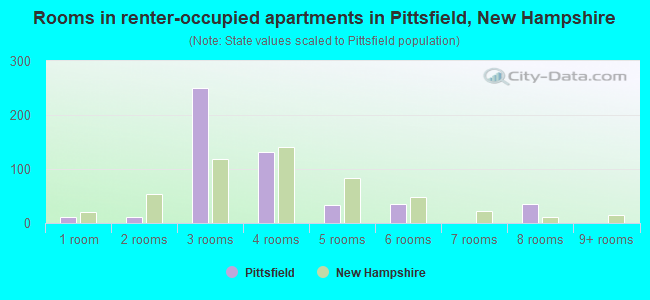
- Rooms in renter-occupied apartments in Pittsfield, New Hampshire
- 121 room
- 122 rooms
- 2503 rooms
- 1324 rooms
- 335 rooms
- 356 rooms
- 07 rooms
- 358 rooms
- 09+ rooms
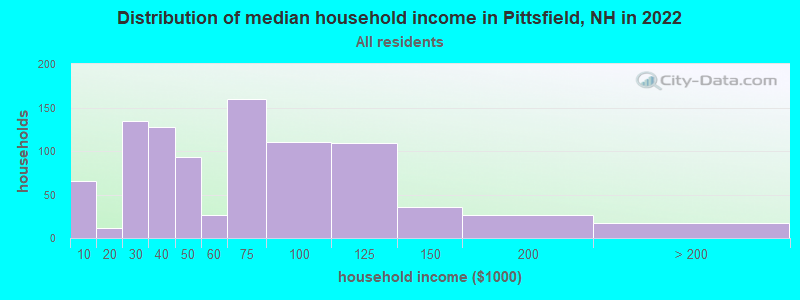
Pittsfield, NH household income distribution

- 66Less than $10,000
- 12$10,000 to $19,999
- 135$20,000 to $29,999
- 128$30,000 to $39,999
- 93$40,000 to $49,999
- 27$50,000 to $59,999
- 160$60,000 to $74,999
- 110$75,000 to $99,999
- 109$100,000 to $124,999
- 36$125,000 to $149,999
- 27$150,000 to $199,999
- 17$200,000 or more
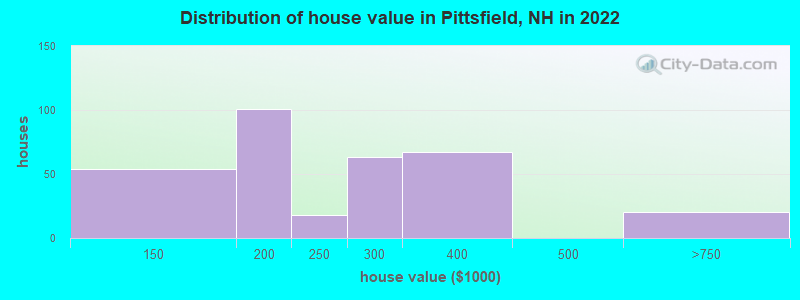
Home value of owner - occupied houses in 2022 in Pittsfield, NH
-
- 28$100,000 to $124,999
- 25$125,000 to $149,999
- 59$150,000 to $174,999
- 42$175,000 to $199,999
- 17$200,000 to $249,999
- 63$250,000 to $299,999
- 67$300,000 to $399,999
- 19$500,000 to $749,999
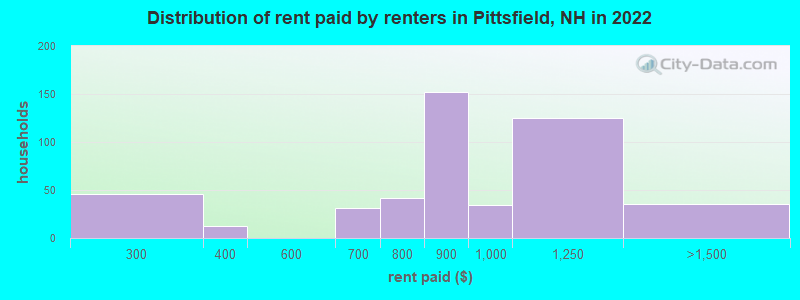
Rent paid by renters in 2022 in Pittsfield, NH
-
- 45$200 to $249
- 11$300 to $349
- 19$600 to $649
- 11$650 to $699
- 42$750 to $799
- 152$800 to $899
- 34$900 to $999
- 124$1,000 to $1,249
- 34$1,250 to $1,499
Percentage of workers working in this county: 69.5%
Number of people working at home: 28 (3.0% of all workers)
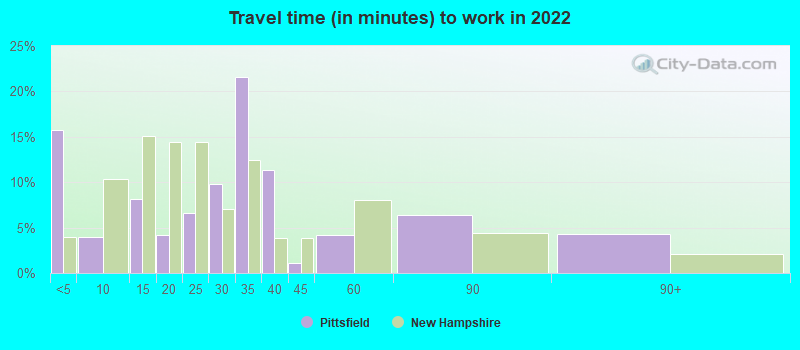
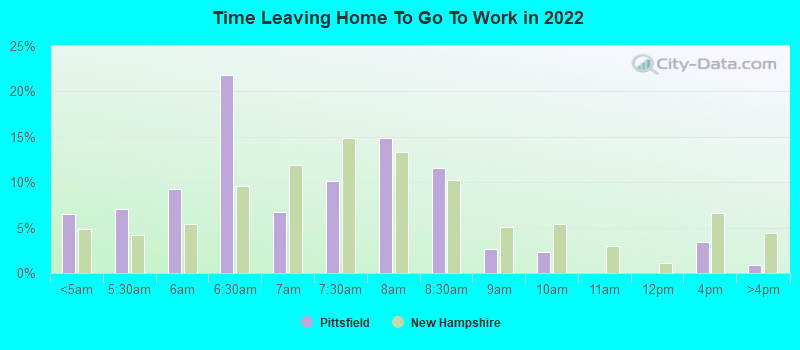
Travel time to work (commute)
- Less than 5 minutes: 126
- 5 to 9 minutes: 221
- 10 to 14 minutes: 26
- 15 to 19 minutes: 71
- 20 to 24 minutes: 59
- 25 to 29 minutes: 39
- 30 to 34 minutes: 76
- 35 to 39 minutes: 18
- 40 to 44 minutes: 63
- 45 to 59 minutes: 88
- 60 to 89 minutes: 72
- 90 or more minutes: 20
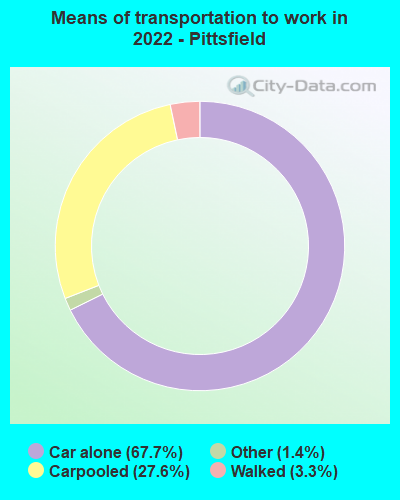
Means of transportation to work:
- Drove a car alone: 428 (55.7%)
- Carpooled: 169 (22.0%)
- Taxi: 10 (1.3%)
- Walked: 18 (2.3%)
- Worked at home: 184 (23.9%)
- Unemployment by race in 2022
- Unemployment rate for White non-Hispanic residents
- 4.9%Males
- 4.1%Females
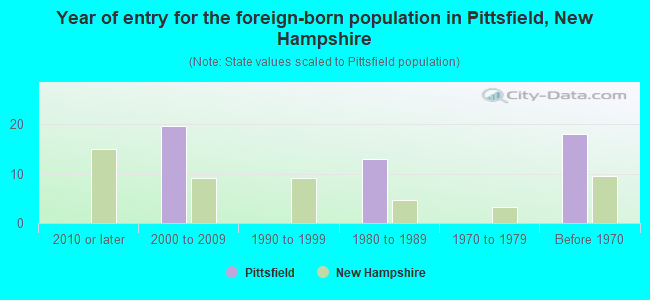
- Year of entry for the foreign-born population in Pittsfield, New Hampshire
- 02010 or later
- 202000 to 2009
- 01990 to 1999
- 131980 to 1989
- 01970 to 1979
- 18Before 1970
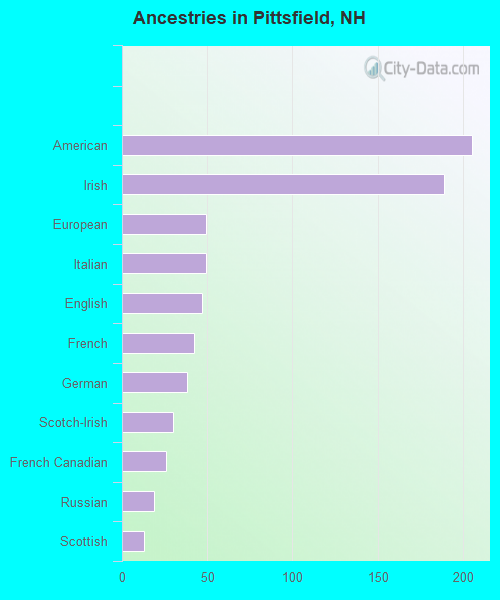
First ancestries reported:
- American: 205 (28.1%)
- Irish: 189 (25.9%)
- European: 49 (6.7%)
- Italian: 49 (6.7%)
- English: 47 (6.4%)
- French: 42 (5.8%)
- German: 38 (5.2%)
- Scotch-Irish: 30 (4.1%)
- French Canadian: 26 (3.6%)
- Russian: 19 (2.6%)
- Scottish: 13 (1.8%)
Most common places of birth for foreign-born residents (%):
| Pittsfield: | 58.3% (21) |
| New Hampshire: | 1.6% (1,351) |
| Pittsfield: | 33.3% (12) |
| New Hampshire: | 0.8% (708) |
Place of birth for U.S.-born residents:
- This state: 964
- Other state: 833
- Northeast: 688
- Midwest: 48
- South: 94
- West: 0
92.4% of Pittsfield residents lived in the same house 1 years ago.
Out of people who lived in different houses, 35.5% lived in this county.
Out of people who lived in different counties, 100.0% lived in New Hampshire.
| Pittsfield: | 92.4% |
| State average: | 89.8% |
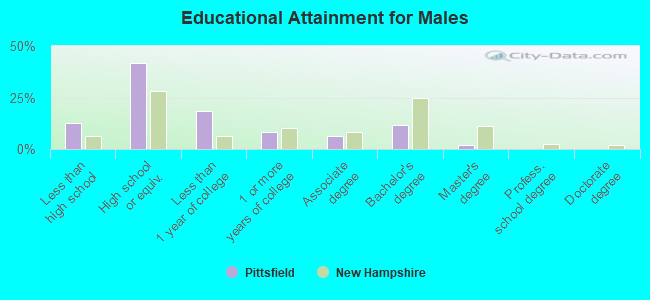
Education attainment for males 25 years and older:
- No schooling: 0
- Nursery to 4th grade: 0
- 5th and 6th grade: 0
- 7th and 8th grade: 0
- 9th grade: 48
- 10th grade: 16
- 11th grade: 32
- 12th grade, no diploma: 0
- High school graduate (or equivalency): 315
- Less than 1 year of college: 139
- Some college more than 1 year, no degree: 61
- Associate degree: 46
- Bachelor's degree: 87
- Master's degree: 14
- Professional school degree: 0
- Doctorate degree: 0
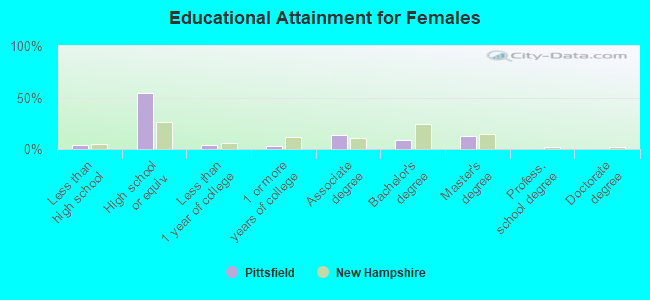
Education attainment for females 25 years and older:
- No schooling: 0
- Nursery to 4th grade: 0
- 5th and 6th grade: 0
- 7th and 8th grade: 0
- 9th grade: 16
- 10th grade: 0
- 11th grade: 0
- 12th grade, no diploma: 12
- High school graduate (or equivalency): 405
- Less than 1 year of college: 26
- Some college more than 1 year, no degree: 24
- Associate degree: 102
- Bachelor's degree: 67
- Master's degree: 93
- Professional school degree: 0
- Doctorate degree: 0
Housing units in structures:
- One, detached: 455
- One, attached: 11
- Two: 78
- 3 or 4: 228
- 5 to 9: 72
- 10 to 19: 12
- 20 to 49: 71
- 50 or more: 89
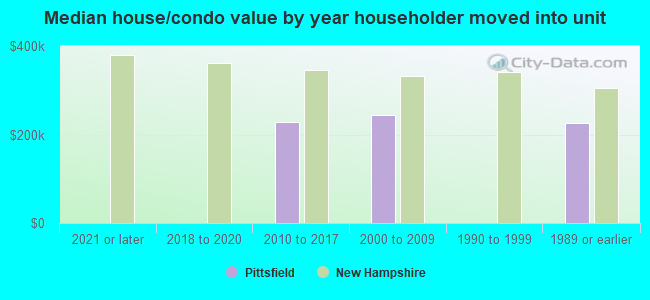
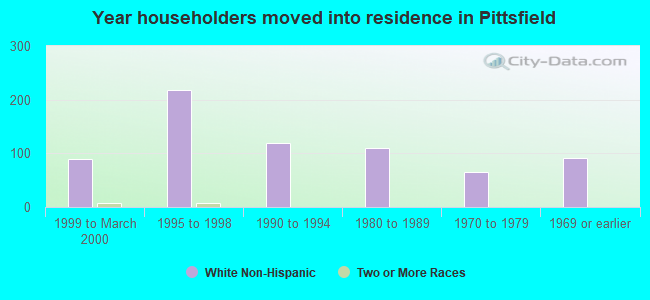
House/condo owner moved in on average 13 years ago
Renter moved in on average 6 years ago
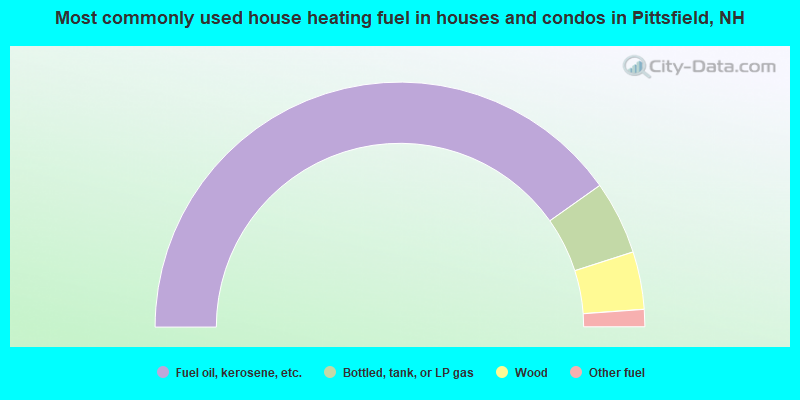
- 80.3%Fuel oil, kerosene, etc.
- 9.7%Bottled, tank, or LP gas
- 7.6%Wood
- 2.3%Other fuel
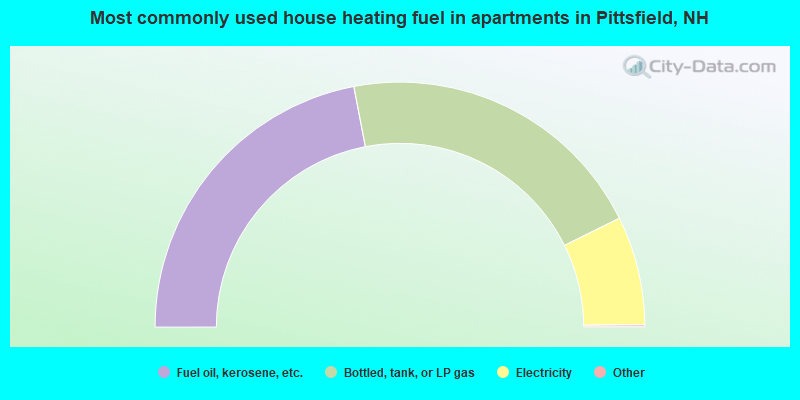
- 44.1%Fuel oil, kerosene, etc.
- 41.5%Bottled, tank, or LP gas
- 14.4%Electricity
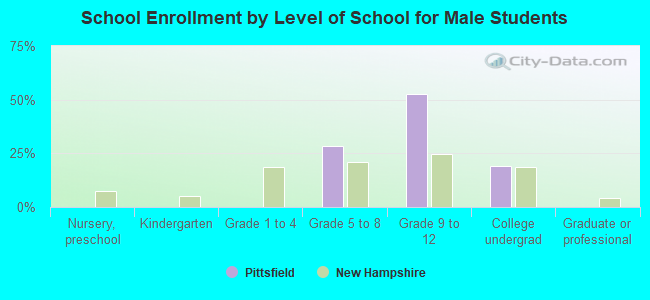
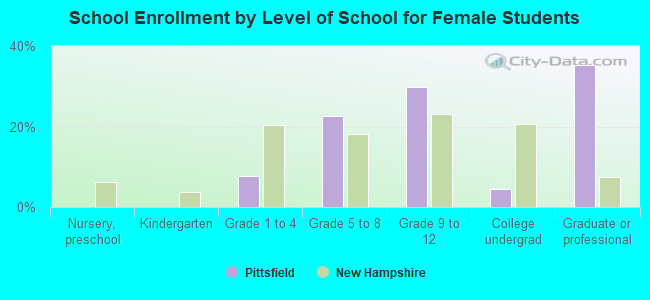
Private vs. public school enrollment:
| Here: | 68.2% |
| New Hampshire: | 11.4% |
| Here: | 14.4% |
| New Hampshire: | 14.0% |
| Here: | 100.0% |
| New Hampshire: | 38.0% |