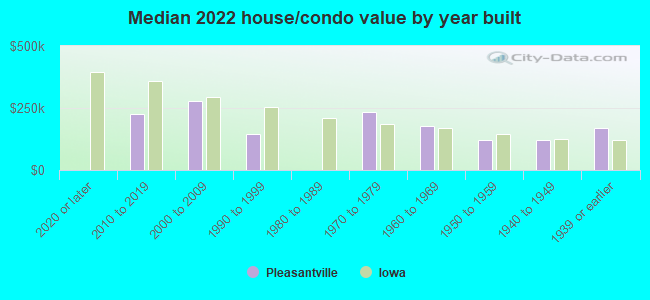
Pleasantville, IA (Iowa) Houses and Residents
| Pleasantville: | $172,847 |
| Iowa: | $194,600 |
Mean price in 2022:
Detached houses: $184,645
Here: $184,645 State: $245,224 Townhouses or other attached units: $425,093
Here: $425,093 State: $238,767 Mobile homes: $17,567
Here: $17,567 State: $51,271
Total population: 1,687 (Urban population: 0, Rural population: 1,508 (all nonfarm))
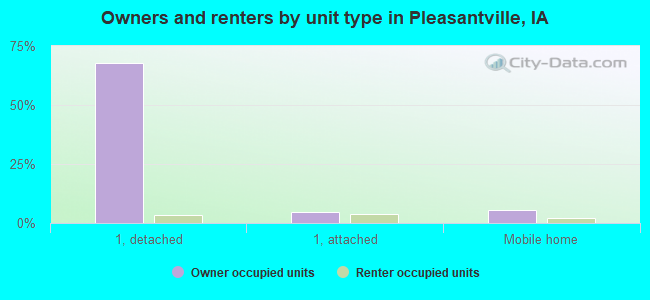
Houses: 799 (761 occupied: 602 owner occupied, 171 renter occupied)
| % of renters here: | 22% |
| State: | 28% |
Housing density: 687 houses/condos per square mile
Median price asked for vacant for-sale houses and condos in 2022 in this county: $186,367.
Median contract rent in 2022: $602 (lower quartile is $525, upper quartile is $711)
Median rent asked for vacant for-rent units in 2022: $2,728
Median gross rent in Pleasantville, IA in 2022: $733
Housing units in Pleasantville with a mortgage: 440 (74 second mortgage, 0 home equity loan, 65 both second mortgage and home equity loan)
Houses without a mortgage: 5
Median household income for houses/condos with a mortgage: $89,747
Median household income for apartments without a mortgage: $38,702
Median monthly housing costs: $1,016
Compare current foreclosures near Pleasantville, IA:
| Photo | Address | Area | Beds / Baths | Price | Details |
|---|---|---|---|---|---|

|
#1
W Clark St
Pleasantville, IA 50225
|
936 sq. feet
|
1 baths 2 beds |
show details | |

|
#2
Lily Ln
Pleasantville, IA 50225
|
- sq. feet
|
- baths - beds |
show details | |

|
#3
W Collins St
Pleasantville, IA 50225
|
- sq. feet
|
- baths - beds |
show details | |

|
#4
E Washington St
Knoxville, IA 50138
|
1,172 sq. feet
|
1 baths 2 beds |
$76,000
|
show details |

|
#5
W Salem Ave
Indianola, IA 50125
|
- sq. feet
|
1 baths 3 beds |
$147,000
|
show details |

|
#6
N 6th St
Indianola, IA 50125
|
1,410 sq. feet
|
2 baths 4 beds |
show details | |

|
#7
N D St
Indianola, IA 50125
|
1,424 sq. feet
|
2 baths 3 beds |
show details | |

|
#8
S F St
Indianola, IA 50125
|
888 sq. feet
|
1 baths 3 beds |
show details | |

|
#9
E Elm St
Milo, IA 50166
|
1,008 sq. feet
|
2 baths 3 beds |
show details | |

|
#10
N Park St
Prairie City, IA 50228
|
1,316 sq. feet
|
1 baths 4 beds |
show details |
| Photo | Address | Area | Beds / Baths | Price | Details |
|---|---|---|---|---|---|

|
#11
N Roche St
Knoxville, IA 50138
|
810 sq. feet
|
2 baths 4 beds |
show details | |

|
#12
Marion St
Prairie City, IA 50228
|
1,145 sq. feet
|
1 baths 2 beds |
show details | |

|
#13
SE Powers Dr
Runnells, IA 50237
|
2,767 sq. feet
|
3 baths 3 beds |
show details | |

|
#14
150th Ave
Carlisle, IA 50047
|
2,687 sq. feet
|
1 baths 3 beds |
show details | |

|
#15
E Kentucky Ave
Indianola, IA 50125
|
1,178 sq. feet
|
3 baths 3 beds |
show details | |

|
#16
Jalea St
Hartford, IA 50118
|
1,005 sq. feet
|
1 baths 3 beds |
show details | |

|
#17
N D St
Indianola, IA 50125
|
997 sq. feet
|
2 baths 2 beds |
show details | |

|
#18
W Robinson St
Knoxville, IA 50138
|
672 sq. feet
|
1 baths 2 beds |
show details | |

|
#19
W 17th Ave
Indianola, IA 50125
|
1,249 sq. feet
|
3 baths 3 beds |
show details | |

|
#20
Crestview Dr
Carlisle, IA 50047
|
1,440 sq. feet
|
2 baths 3 beds |
show details |
| Photo | Address | Area | Beds / Baths | Price | Details |
|---|---|---|---|---|---|

|
#21
S 4th St
Carlisle, IA 50047
|
1,159 sq. feet
|
2 baths 3 beds |
show details | |

|
#22
Center St
Knoxville, IA 50138
|
1,239 sq. feet
|
1 baths 3 beds |
show details | |

|
#23
S 4th St
Indianola, IA 50125
|
1,800 sq. feet
|
3 baths 3 beds |
show details | |

|
#24
S 1st St
Milo, IA 50166
|
858 sq. feet
|
2 baths 3 beds |
show details | |

|
#25
E Robinson St
Knoxville, IA 50138
|
960 sq. feet
|
1 baths - beds |
show details | |

|
#26
W 16th St Unit 106
Pella, IA 50219
|
- sq. feet
|
- baths - beds |
show details | |

|
#27
Washington St
Pella, IA 50219
|
- sq. feet
|
- baths - beds |
show details | |

|
#28
Vintage Ln, Unit 15
Pella, IA 50219
|
- sq. feet
|
- baths - beds |
show details | |

|
#29
W 1st Ave
Indianola, IA 50125
|
- sq. feet
|
- baths - beds |
show details | |

|
#30
Bellflower Dr
Carlisle, IA 50047
|
- sq. feet
|
- baths - beds |
show details |
| Photo | Address | Area | Beds / Baths | Price | Details |
|---|---|---|---|---|---|

|
#31
195th Pl
Harvey, IA 50119
|
- sq. feet
|
- baths - beds |
show details | |

|
#32
N 6th St # 8
Indianola, IA 50125
|
- sq. feet
|
- baths - beds |
show details | |

|
#33
N 9th St
Indianola, IA 50125
|
- sq. feet
|
- baths - beds |
show details | |

|
#34
W Steenhoek St Unit A
Prairie City, IA 50228
|
- sq. feet
|
- baths - beds |
show details | |

|
#35
N 14th St Apt 1
Indianola, IA 50125
|
- sq. feet
|
- baths - beds |
show details | |

|
#36
John Clinton Dr, Trlr 31
Carlisle, IA 50047
|
- sq. feet
|
- baths - beds |
show details | |

|
#37
E North St
Monroe, IA 50170
|
- sq. feet
|
- baths - beds |
show details | |

|
#38
College St
Ackworth, IA 50001
|
- sq. feet
|
- baths - beds |
show details | |

|
#39
Beverly Dr
Knoxville, IA 50138
|
- sq. feet
|
- baths - beds |
show details | |

|
#40
Vine St
Runnells, IA 50237
|
- sq. feet
|
- baths - beds |
show details |
| Photo | Address | Area | Beds / Baths | Price | Details |
|---|---|---|---|---|---|

|
#41
S Park Lane Dr
Knoxville, IA 50138
|
42,331 sq. feet
|
- baths - beds |
show details | |

|
#42
W 4th Ave Apt 109
Indianola, IA 50125
|
- sq. feet
|
- baths - beds |
show details | |

|
Check over 1 million property listings on Foreclosure.com!
|
browse all offers | |||

Latest news about housing in Pleasantville, IA collected exclusively by city-data.com from local newspapers, TV, and radio stations

 | Rental HOUSES south of Des Moines (2 replies) |
| Looking for a place to rent / buy near University of Iowa Hospital (5 replies) |
| SouthEastern Des Moines (11 replies) |
Median year apartment built: 1977
Household type by relationship:
Households: 1,846- Male householders: 298 (109 living alone), Female householders: 454 (99 living alone)
396 spouses (396 opposite-sex spouses), 21 unmarried partners, (21 opposite-sex unmarried partners), 573 children (527 natural, 4 adopted, 41 stepchildren), 28 grandchildren, 3 brothers or sisters, 2 parents, 2 foster children, 5 other relatives, 19 non-relatives
- In group quarters: 44
Size of family households: 183 2-persons, 130 3-persons, 129 4-persons, 48 5-persons, 22 6-persons, 2 7-or-more-persons.
Size of nonfamily households: 217 1-person, 34 2-persons.
377 married couples with children.
102 single-parent households (0 men, 102 women).
99.2% of residents of Pleasantville speak English at home.
0.1% of residents speak Spanish at home (100% speak English very well).
0.1% of residents speak Asian or Pacific Island language at home (100% speak English very well).
Foreign born population: 12 (0.7%)
(66.7% of them are naturalized citizens)
| Here: | 6.5 |
| State: | 6.8 |
| Here: | 3.9 |
| State: | 4.2 |
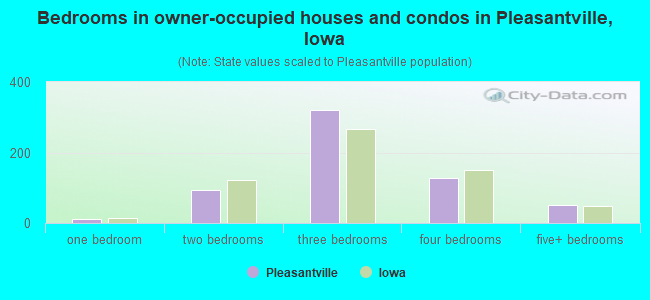
- Bedrooms in owner-occupied houses and condos in Pleasantville, Iowa
- 0no bedroom
- 121 bedroom
- 932 bedrooms
- 3213 bedrooms
- 1274 bedrooms
- 505+ bedrooms
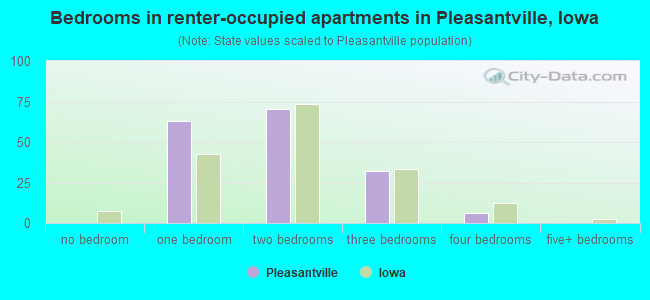
- Bedrooms in renter-occupied apartments in Pleasantville, Iowa
- 0no bedroom
- 631 bedroom
- 702 bedrooms
- 323 bedrooms
- 64 bedrooms
- 05+ bedrooms
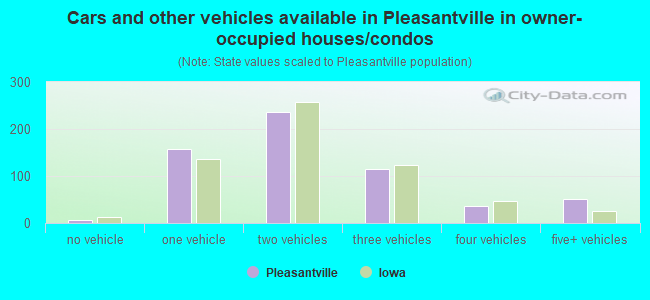
- Cars and other vehicles available in Pleasantville in owner-occupied houses/condos
- 6no vehicle
- 1581 vehicle
- 2362 vehicles
- 1153 vehicles
- 364 vehicles
- 525+ vehicles
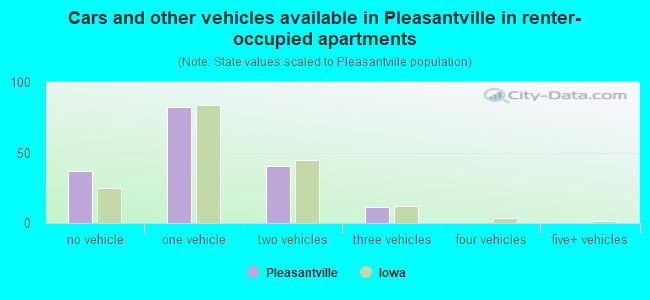
- Cars and other vehicles available in Pleasantville in renter-occupied apartments
- 37no vehicle
- 831 vehicle
- 402 vehicles
- 113 vehicles
- 04 vehicles
- 05+ vehicles
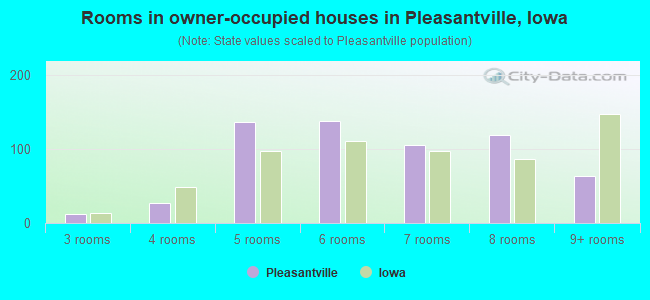
- Rooms in owner-occupied houses in Pleasantville, Iowa
- 01 room
- 02 rooms
- 123 rooms
- 274 rooms
- 1375 rooms
- 1386 rooms
- 1067 rooms
- 1198 rooms
- 639+ rooms
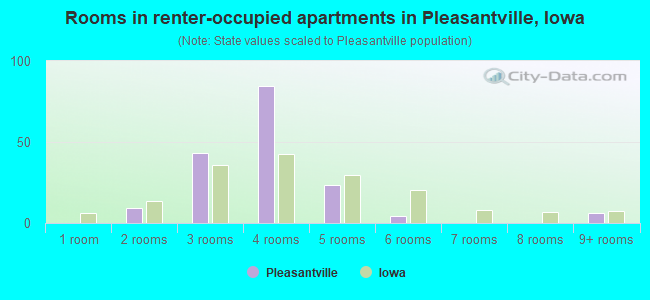
- Rooms in renter-occupied apartments in Pleasantville, Iowa
- 01 room
- 92 rooms
- 433 rooms
- 854 rooms
- 245 rooms
- 46 rooms
- 07 rooms
- 08 rooms
- 69+ rooms
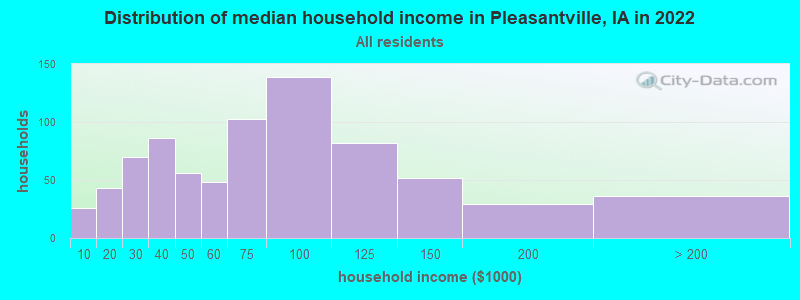
Pleasantville, IA household income distribution

- 26Less than $10,000
- 43$10,000 to $19,999
- 70$20,000 to $29,999
- 86$30,000 to $39,999
- 56$40,000 to $49,999
- 48$50,000 to $59,999
- 103$60,000 to $74,999
- 139$75,000 to $99,999
- 82$100,000 to $124,999
- 52$125,000 to $149,999
- 29$150,000 to $199,999
- 36$200,000 or more
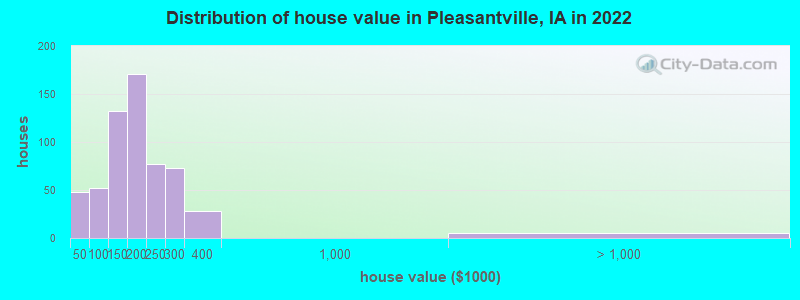
Home value of owner - occupied houses in 2022 in Pleasantville, IA
-
- 9Less than $10,000
- 12$15,000 to $19,999
- 2$20,000 to $24,999
- 18$25,000 to $29,999
- 4$30,000 to $34,999
- 5$50,000 to $59,999
- 13$60,000 to $69,999
- 14$70,000 to $79,999
- 2$80,000 to $89,999
- 15$90,000 to $99,999
- 95$100,000 to $124,999
- 36$125,000 to $149,999
- 107$150,000 to $174,999
- 63$175,000 to $199,999
- 76$200,000 to $249,999
- 73$250,000 to $299,999
- 28$300,000 to $399,999
- 5$2,000,000 or more
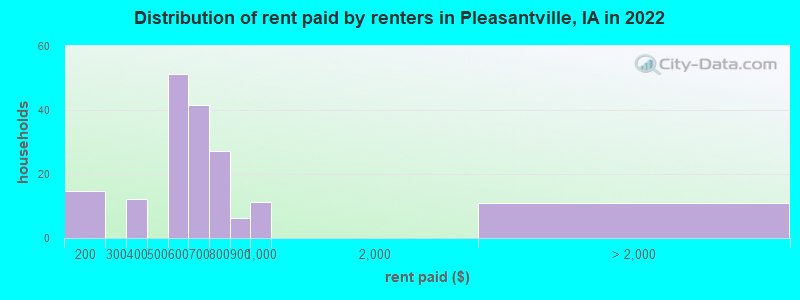
Rent paid by renters in 2022 in Pleasantville, IA
-
- 14$100 to $149
- 8$300 to $349
- 4$350 to $399
- 34$500 to $549
- 16$550 to $599
- 26$600 to $649
- 14$650 to $699
- 17$700 to $749
- 9$750 to $799
- 6$800 to $899
- 11$900 to $999
- 10No cash rent
Percentage of workers working in this county: 57.2%
Number of people working at home: 119 (13.3% of all workers)
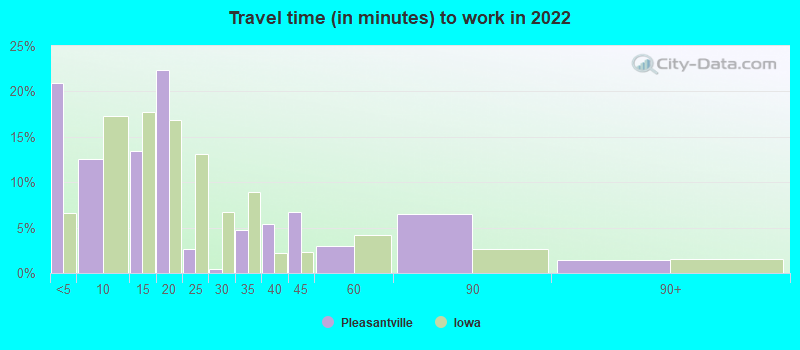
Travel time to work (commute)
- Less than 5 minutes: 132
- 5 to 9 minutes: 77
- 10 to 14 minutes: 32
- 15 to 19 minutes: 86
- 20 to 24 minutes: 51
- 25 to 29 minutes: 46
- 30 to 34 minutes: 80
- 35 to 39 minutes: 42
- 40 to 44 minutes: 54
- 45 to 59 minutes: 149
- 60 to 89 minutes: 10
- 90 or more minutes: 11
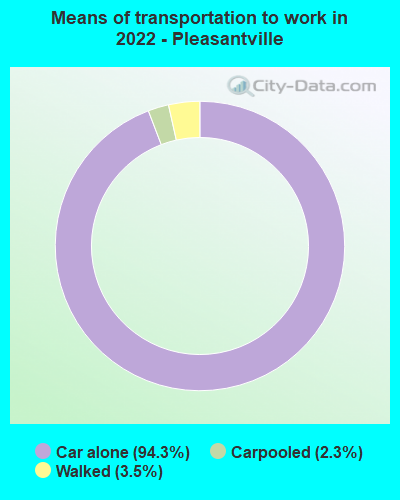
Means of transportation to work:
- Drove a car alone: 619 (80.0%)
- Carpooled: 15 (1.9%)
- Walked: 22 (2.8%)
- Worked at home: 119 (15.4%)
- Unemployment by race in 2022
- Unemployment rate for White non-Hispanic residents
- 3.1%Males
- 0.6%Females
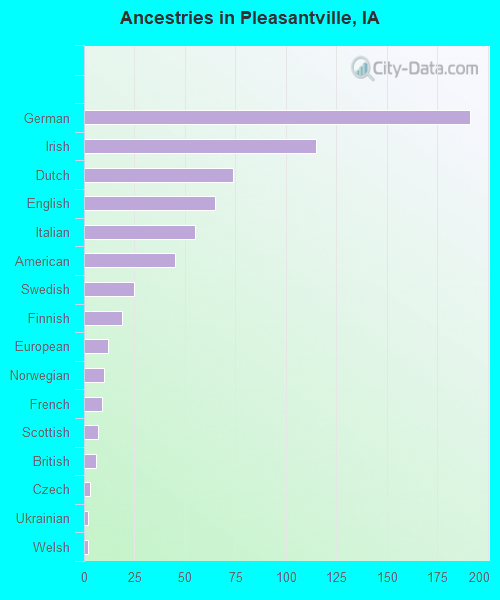
First ancestries reported:
- German: 191 (24.8%)
- Irish: 115 (14.9%)
- Dutch: 74 (9.6%)
- English: 65 (8.4%)
- Italian: 55 (7.1%)
- American: 45 (5.8%)
- Swedish: 25 (3.2%)
- Finnish: 19 (2.5%)
- European: 12 (1.6%)
- Norwegian: 10 (1.3%)
- French: 9 (1.2%)
- Scottish: 7 (0.9%)
- British: 6 (0.8%)
- Czech: 3 (0.4%)
- Ukrainian: 2 (0.3%)
- Welsh: 2 (0.3%)
- Northern European: 1 (0.1%)
Most common places of birth for foreign-born residents (%):
| Pleasantville: | 41.7% (5) |
| Iowa: | 0.1% (201) |
| Pleasantville: | 25.0% (3) |
| Iowa: | 0.5% (827) |
| Pleasantville: | 8.3% (1) |
| Iowa: | 2.6% (4,675) |
Place of birth for U.S.-born residents:
- This state: 1,570
- Other state: 254
- Northeast: 32
- Midwest: 112
- South: 33
- West: 77
83.9% of Pleasantville residents lived in the same house 1 years ago.
Out of people who lived in different houses, 19.4% lived in this county.
Out of people who lived in different counties, 66.8% lived in Iowa.
| Pleasantville: | 83.9% |
| State average: | 87.2% |
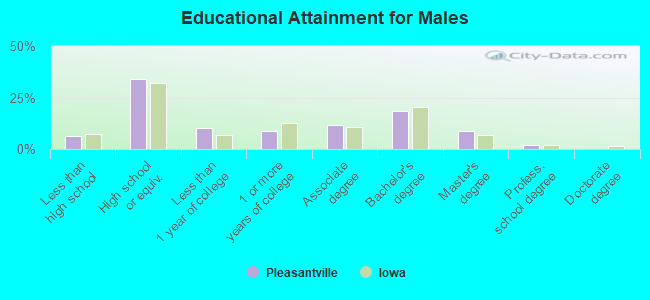
Education attainment for males 25 years and older:
- No schooling: 3
- Nursery to 4th grade: 0
- 5th and 6th grade: 0
- 7th and 8th grade: 8
- 9th grade: 4
- 10th grade: 2
- 11th grade: 9
- 12th grade, no diploma: 11
- High school graduate (or equivalency): 202
- Less than 1 year of college: 62
- Some college more than 1 year, no degree: 51
- Associate degree: 71
- Bachelor's degree: 111
- Master's degree: 52
- Professional school degree: 12
- Doctorate degree: 0
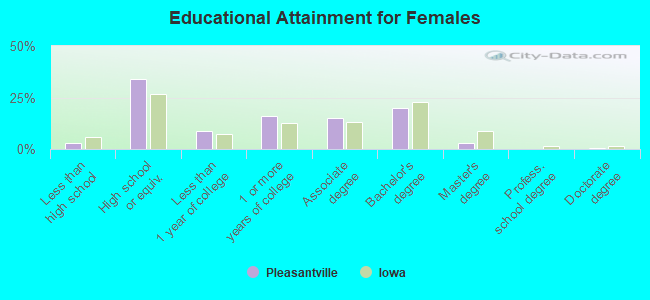
Education attainment for females 25 years and older:
- No schooling: 0
- Nursery to 4th grade: 0
- 5th and 6th grade: 0
- 7th and 8th grade: 6
- 9th grade: 0
- 10th grade: 4
- 11th grade: 2
- 12th grade, no diploma: 4
- High school graduate (or equivalency): 203
- Less than 1 year of college: 52
- Some college more than 1 year, no degree: 95
- Associate degree: 89
- Bachelor's degree: 119
- Master's degree: 16
- Professional school degree: 0
- Doctorate degree: 4
Housing units in structures:
- One, detached: 567
- One, attached: 60
- 3 or 4: 16
- 5 to 9: 61
- 10 to 19: 28
- Mobile homes: 64
Median worth of mobile homes: $29,995
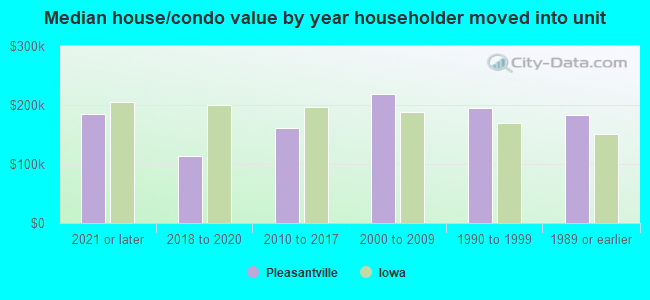
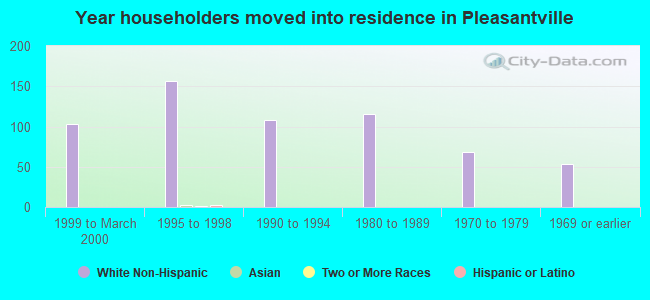
House/condo owner moved in on average 7 years ago
Renter moved in on average 3 years ago
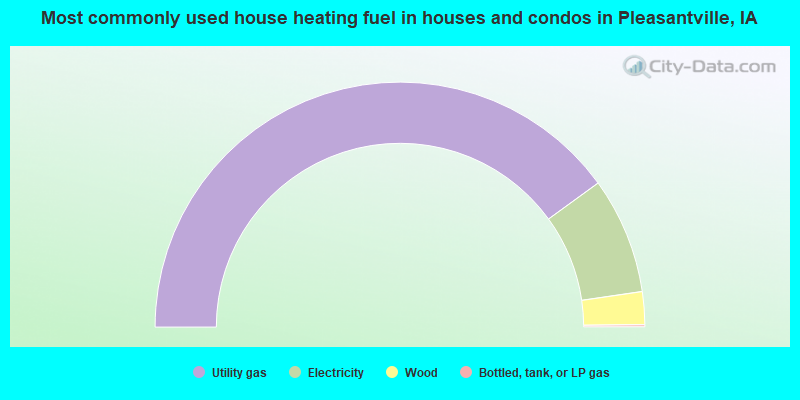
- 80.0%Utility gas
- 15.4%Electricity
- 4.3%Wood
- 0.3%Bottled, tank, or LP gas
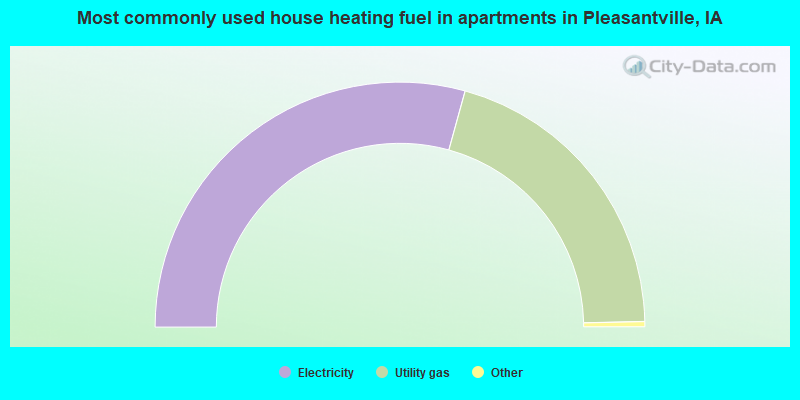
- 59.0%Electricity
- 41.0%Utility gas
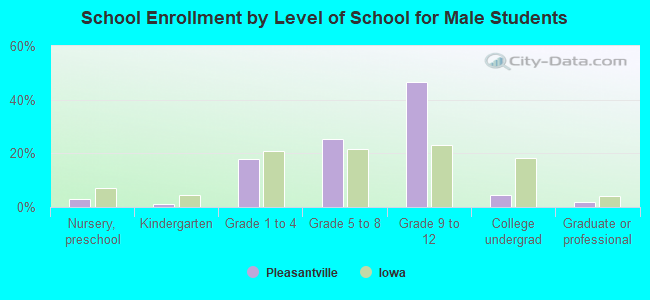
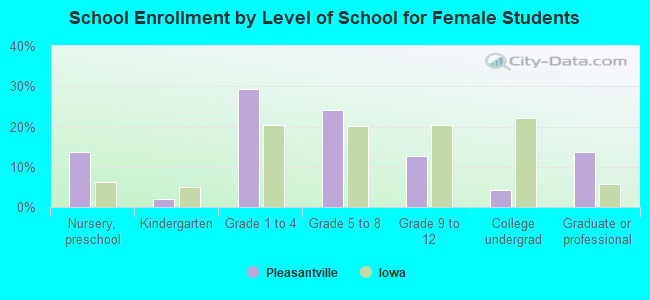
Private vs. public school enrollment:
| Here: | 3.3% |
| Iowa: | 10.6% |
| Here: | 3.8% |
| Iowa: | 7.9% |
| Here: | 0.0% |
| Iowa: | 23.9% |