Point Marion, PA (Pennsylvania) Houses and Residents
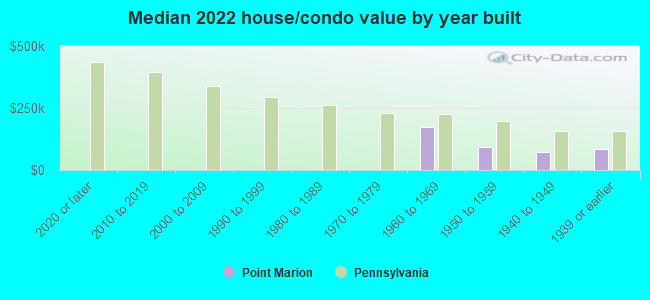
| Point Marion: | $96,435 |
| Pennsylvania: | $245,500 |
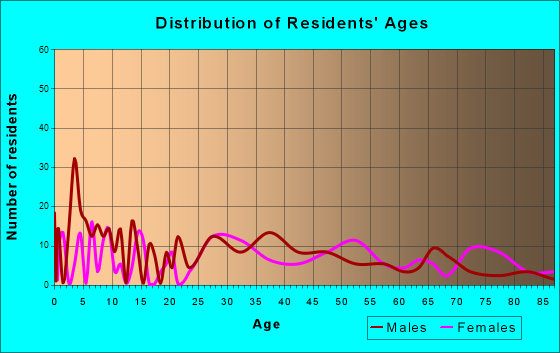
Total population: 1,140 (Urban population: 0, Rural population: 1,331 (all nonfarm))
Houses: 516 (457 occupied: 278 owner occupied, 183 renter occupied)
| % of renters here: | 40% |
| State: | 31% |
Housing density: 1,216 houses/condos per square mile
Median price asked for vacant for-sale houses and condos in 2022: $186,109.
Median contract rent in 2022: $709 (lower quartile is $544, upper quartile is $730)
Median rent asked for vacant for-rent units in 2022: $609
Median gross rent in Point Marion, PA in 2022: $907
Housing units in Point Marion with a mortgage: 121 (21 second mortgage, 3 home equity loan, 13 both second mortgage and home equity loan)
Houses without a mortgage: 8
Median household income for houses/condos with a mortgage: $65,187
Median household income for apartments without a mortgage: $43,684
Median monthly housing costs: $814
Compare current foreclosures near Point Marion, PA:
| Photo | Address | Area | Beds / Baths | Price | Details |
|---|---|---|---|---|---|

|
#1
Morgantown Rd
Point Marion, PA 15474
|
1,220 sq. feet
|
2 baths 4 beds |
show details | |

|
#2
New Geneva Rd
Point Marion, PA 15474
|
1,566 sq. feet
|
1 baths 3 beds |
show details | |

|
#3
Cupelli St
Point Marion, PA 15474
|
945 sq. feet
|
1 baths 1 beds |
show details | |

|
#4
Litman St
Point Marion, PA 15474
|
- sq. feet
|
- baths - beds |
show details | |

|
#5
Casey Drive
New Salem, PA 15468
|
- sq. feet
|
1 baths 1 beds |
$244,900
|
show details |

|
#6
Stevenson St
Ronco, PA 15476
|
- sq. feet
|
2 baths 4 beds |
$16,500
|
show details |

|
#7
Circle St
Brownsville, PA 15417
|
1,450 sq. feet
|
2 baths 3 beds |
show details | |

|
#8
Goshen Rd
Morgantown, WV 26508
|
1,920 sq. feet
|
1 baths 3 beds |
show details | |

|
#9
Marcus Dr
Morgantown, WV 26501
|
1,120 sq. feet
|
1 baths 2 beds |
show details | |

|
#10
Hazel St
Fairchance, PA 15436
|
1,069 sq. feet
|
1 baths 2 beds |
show details |
| Photo | Address | Area | Beds / Baths | Price | Details |
|---|---|---|---|---|---|

|
#11
Old Mcclellandtown Rd
Mc Clellandtown, PA 15458
|
- sq. feet
|
1 baths 3 beds |
show details | |

|
#12
Walnut Hill Rd
Uniontown, PA 15401
|
1,014 sq. feet
|
1 baths 2 beds |
show details | |

|
#13
Indian Rock Rd
Reedsville, WV 26547
|
1,512 sq. feet
|
2 baths 3 beds |
show details | |

|
#14
1st St
Uniontown, PA 15401
|
1,850 sq. feet
|
2 baths 4 beds |
show details | |

|
#15
Grant St
New Salem, PA 15468
|
1,488 sq. feet
|
1 baths 3 beds |
show details | |

|
#16
Wall St
Republic, PA 15475
|
868 sq. feet
|
1 baths 2 beds |
show details | |

|
#17
Grant Ave
New Salem, PA 15468
|
1,178 sq. feet
|
1 baths 2 beds |
show details | |

|
#18
E Main St
New Salem, PA 15468
|
1,628 sq. feet
|
1 baths 2 beds |
show details | |

|
#19
Morgantown Rd
Smithfield, PA 15478
|
1,550 sq. feet
|
1 baths 3 beds |
show details | |

|
#20
Main St
Uniontown, PA 15401
|
1,137 sq. feet
|
1 baths 3 beds |
show details |
| Photo | Address | Area | Beds / Baths | Price | Details |
|---|---|---|---|---|---|

|
#21
Pine Knob Rd
Hopwood, PA 15445
|
1,565 sq. feet
|
1 baths 3 beds |
show details | |

|
#22
3rd Street
Isabella, PA 15447
|
854 sq. feet
|
1 baths 2 beds |
show details | |

|
#23
Collins Ave
Uniontown, PA 15401
|
1,449 sq. feet
|
1 baths 4 beds |
show details | |

|
#24
Kennedy Street
Republic, PA 15475
|
2,072 sq. feet
|
1 baths 2 beds |
show details | |

|
#25
A-B Richmond St
Morgantown, WV 26501
|
1,433 sq. feet
|
2 baths 7 beds |
show details | |

|
#26
Single St
Carmichaels, PA 15320
|
1,178 sq. feet
|
1 baths 3 beds |
show details | |

|
#27
Canyon Rd
Morgantown, WV 26508
|
- sq. feet
|
1 baths 3 beds |
show details | |

|
#28
Pine Knob Rd
Hopwood, PA 15445
|
1,565 sq. feet
|
1 baths 3 beds |
show details | |

|
#29
Brytes Way
Morgantown, WV 26508
|
1,188 sq. feet
|
2 baths 3 beds |
show details | |

|
#30
Montview St
Uniontown, PA 15401
|
1,284 sq. feet
|
2 baths 3 beds |
show details |
| Photo | Address | Area | Beds / Baths | Price | Details |
|---|---|---|---|---|---|

|
#31
Gans Rd
Lake Lynn, PA 15451
|
1,900 sq. feet
|
1 baths 3 beds |
show details | |

|
#32
Woodlawn Ave
Uniontown, PA 15401
|
996 sq. feet
|
1 baths 2 beds |
show details | |

|
#33
Hazel St
Fairchance, PA 15436
|
1,440 sq. feet
|
2 baths 3 beds |
show details | |

|
#34
Beth Dr
Fairchance, PA 15436
|
1,200 sq. feet
|
2 baths 3 beds |
show details | |

|
#35
Wagner St
Uniontown, PA 15401
|
1,360 sq. feet
|
2 baths 3 beds |
show details | |

|
#36
Long St
Mc Clellandtown, PA 15458
|
952 sq. feet
|
1 baths 2 beds |
show details | |

|
#37
National Pike
Uniontown, PA 15401
|
1,550 sq. feet
|
3 baths 4 beds |
show details | |

|
#38
Old Furnace Rd
Hopwood, PA 15445
|
- sq. feet
|
1 baths 2 beds |
show details | |

|
#39
Old Mcclellandtown Rd
Mc Clellandtown, PA 15458
|
3,480 sq. feet
|
1 baths 3 beds |
show details | |

|
#40
Connellsville St
Uniontown, PA 15401
|
1,753 sq. feet
|
2 baths 4 beds |
show details |
| Photo | Address | Area | Beds / Baths | Price | Details |
|---|---|---|---|---|---|

|
#41
Oakland Ave
Uniontown, PA 15401
|
2,764 sq. feet
|
2 baths 4 beds |
show details | |

|
#42
Industry Ln
Uniontown, PA 15401
|
5,840 sq. feet
|
1 baths 3 beds |
show details | |

|
#43
Messmore Rd
Mc Clellandtown, PA 15458
|
1,179 sq. feet
|
1 baths 2 beds |
show details | |

|
#44
Wilmac St
Uniontown, PA 15401
|
- sq. feet
|
1 baths 2 beds |
show details | |

|
#45
Summers School Rd
Morgantown, WV 26508
|
1,620 sq. feet
|
1 baths 3 beds |
show details | |

|
#46
Hopwood Coolspring Rd
Hopwood, PA 15445
|
2,024 sq. feet
|
1 baths 4 beds |
show details | |

|
#47
Lafayette St
Uniontown, PA 15401
|
1,270 sq. feet
|
2 baths 2 beds |
show details | |

|
#48
Coolspring St
Uniontown, PA 15401
|
1,320 sq. feet
|
- baths 3 beds |
show details | |

|
#49
Warm Hollow Rd
Morgantown, WV 26508
|
1,740 sq. feet
|
1 baths 3 beds |
show details | |

|
Check over 1 million property listings on Foreclosure.com!
|
browse all offers | |||


 | How is Confluence for Retirement Living? (15 replies) |
| Laurel Highlands Visit Help (6 replies) |
| Pittsburgh Was AMAZING! (Photos!) (63 replies) |
| New Job in Morgantown, WV-Want to Live in PA (4 replies) |
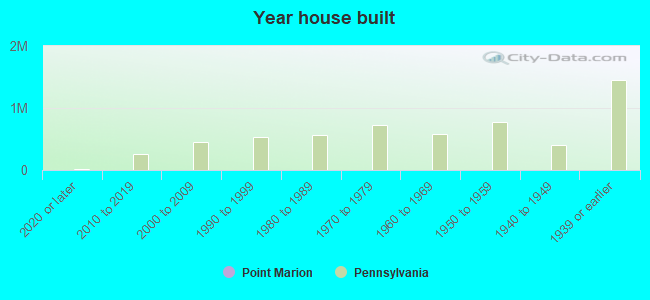
Median year apartment built: 1948
Household type by relationship:
Households: 1,249- Male householders: 199 (49 living alone), Female householders: 246 (81 living alone)
251 spouses (247 opposite-sex spouses), 64 unmarried partners, (55 opposite-sex unmarried partners), 364 children (328 natural, 24 adopted, 11 stepchildren), 21 grandchildren, 13 brothers or sisters, 22 parents, 0 foster children, 10 other relatives, 21 non-relatives
- In group quarters: 32
Size of family households: 100 2-persons, 69 3-persons, 35 4-persons, 58 5-persons, 7 7-or-more-persons.
Size of nonfamily households: 146 1-person, 37 2-persons, 6 3-persons.
244 married couples with children.
46 single-parent households (27 men, 19 women).
97.5% of residents of Point Marion speak English at home.
1.2% of residents speak Spanish at home (100% speak English very well).
0.3% of residents speak other Indo-European language at home (100% speak English very well).
| Here: | 6.7 |
| State: | 6.8 |
| Here: | 5.9 |
| State: | 4.3 |
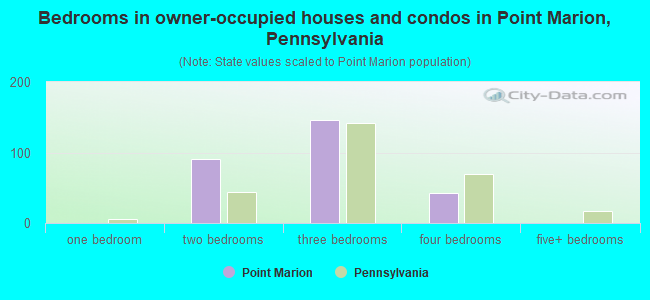
- Bedrooms in owner-occupied houses and condos in Point Marion, Pennsylvania
- 0no bedroom
- 01 bedroom
- 912 bedrooms
- 1463 bedrooms
- 424 bedrooms
- 05+ bedrooms
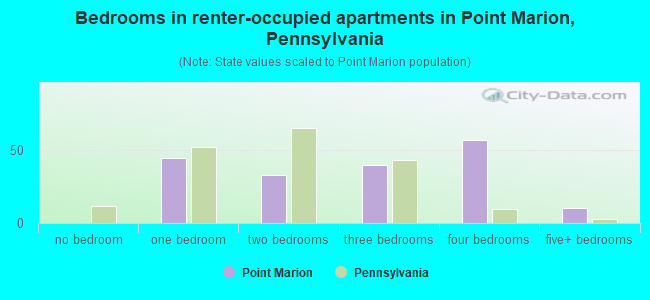
- Bedrooms in renter-occupied apartments in Point Marion, Pennsylvania
- 0no bedroom
- 451 bedroom
- 322 bedrooms
- 403 bedrooms
- 574 bedrooms
- 105+ bedrooms
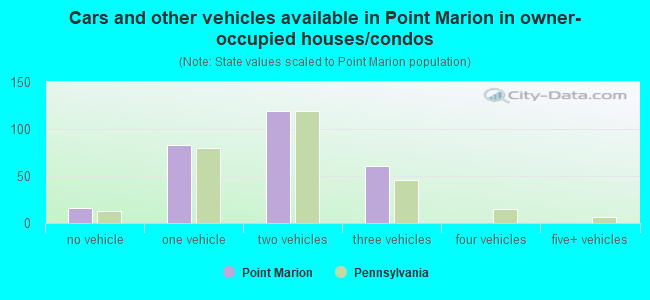
- Cars and other vehicles available in Point Marion in owner-occupied houses/condos
- 16no vehicle
- 831 vehicle
- 1192 vehicles
- 613 vehicles
- 04 vehicles
- 05+ vehicles
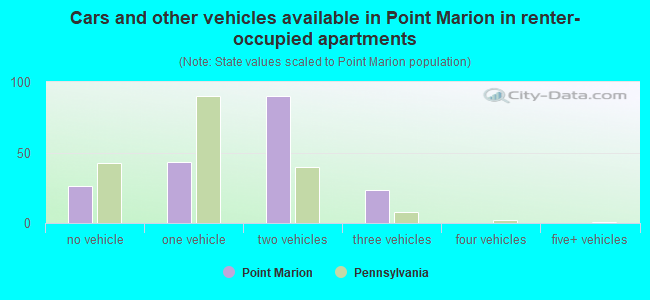
- Cars and other vehicles available in Point Marion in renter-occupied apartments
- 26no vehicle
- 441 vehicle
- 902 vehicles
- 233 vehicles
- 04 vehicles
- 05+ vehicles
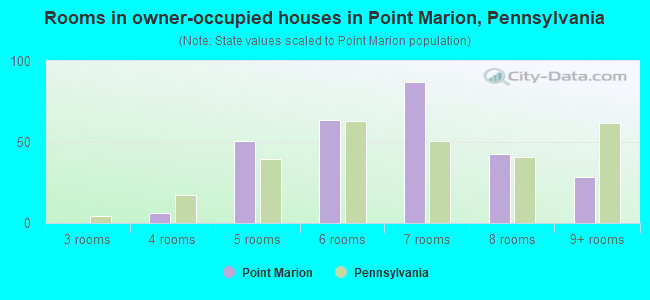
- Rooms in owner-occupied houses in Point Marion, Pennsylvania
- 01 room
- 02 rooms
- 03 rooms
- 64 rooms
- 515 rooms
- 646 rooms
- 877 rooms
- 438 rooms
- 289+ rooms
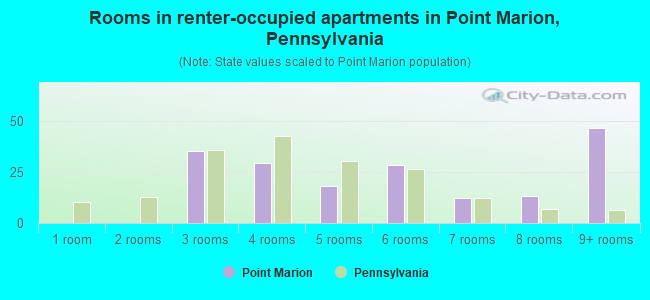
- Rooms in renter-occupied apartments in Point Marion, Pennsylvania
- 01 room
- 02 rooms
- 353 rooms
- 294 rooms
- 185 rooms
- 286 rooms
- 127 rooms
- 138 rooms
- 479+ rooms
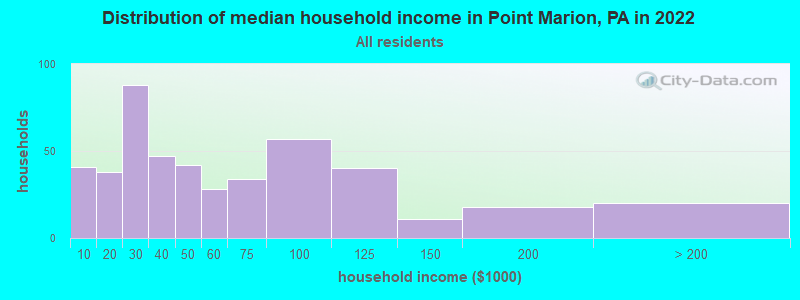
Point Marion, PA household income distribution

- 41Less than $10,000
- 38$10,000 to $19,999
- 88$20,000 to $29,999
- 47$30,000 to $39,999
- 42$40,000 to $49,999
- 28$50,000 to $59,999
- 34$60,000 to $74,999
- 57$75,000 to $99,999
- 40$100,000 to $124,999
- 11$125,000 to $149,999
- 18$150,000 to $199,999
- 20$200,000 or more
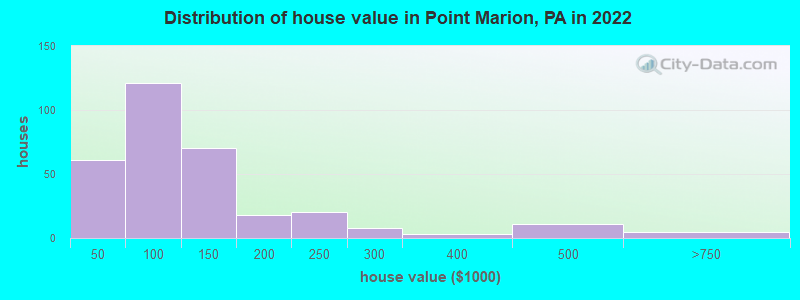
Home value of owner - occupied houses in 2022 in Point Marion, PA
-
- 3Less than $10,000
- 6$20,000 to $24,999
- 19$30,000 to $34,999
- 31$40,000 to $49,999
- 17$50,000 to $59,999
- 7$60,000 to $69,999
- 32$70,000 to $79,999
- 27$80,000 to $89,999
- 5$90,000 to $99,999
- 39$100,000 to $124,999
- 30$125,000 to $149,999
- 7$150,000 to $174,999
- 10$175,000 to $199,999
- 19$200,000 to $249,999
- 7$250,000 to $299,999
- 2$300,000 to $399,999
- 10$400,000 to $499,999
- 4$500,000 to $749,999
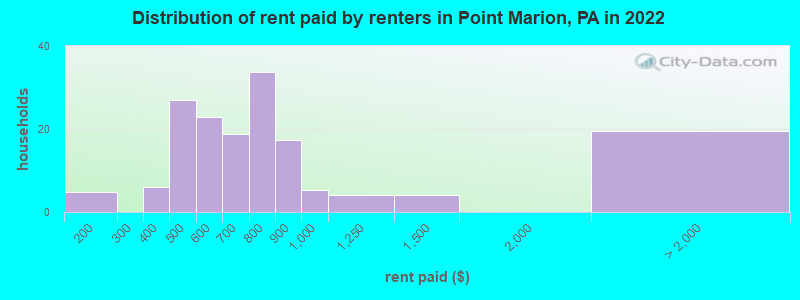
Rent paid by renters in 2022 in Point Marion, PA
-
- 4$100 to $149
- 6$300 to $349
- 4$400 to $449
- 22$450 to $499
- 2$500 to $549
- 20$550 to $599
- 18$600 to $649
- 2$700 to $749
- 31$750 to $799
- 17$800 to $899
- 5$900 to $999
- 4$1,000 to $1,249
- 4$1,250 to $1,499
- 19No cash rent
Percentage of workers working in this county: 36.5%
Number of people working at home: 41 (6.7% of all workers)
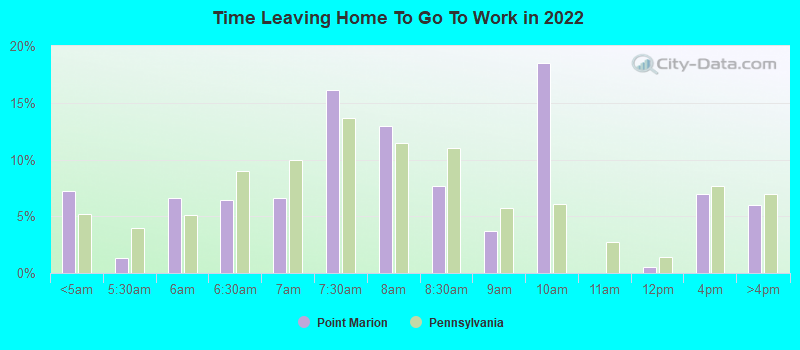
Travel time to work (commute)
- Less than 5 minutes: 0
- 5 to 9 minutes: 12
- 10 to 14 minutes: 44
- 15 to 19 minutes: 59
- 20 to 24 minutes: 80
- 25 to 29 minutes: 49
- 30 to 34 minutes: 168
- 35 to 39 minutes: 20
- 40 to 44 minutes: 21
- 45 to 59 minutes: 18
- 60 to 89 minutes: 12
- 90 or more minutes: 35
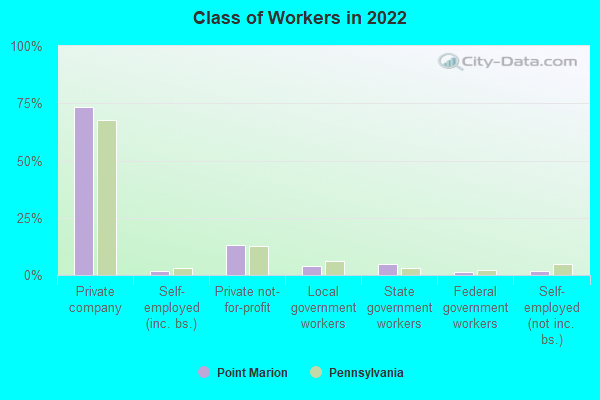
Means of transportation to work:
- Drove a car alone: 419 (85.2%)
- Carpooled: 51 (10.4%)
- Taxi: 8 (1.6%)
- Walked: 8 (1.6%)
- Worked at home: 6 (1.2%)
- Unemployment by race in 2022
- Unemployment rate for White non-Hispanic residents
- 10.2%Males
- 1.1%Females
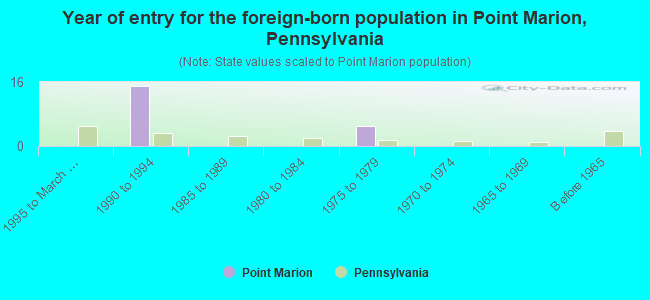
- Year of entry for the foreign-born population in Point Marion, Pennsylvania
- 01995 to March 2000
- 151990 to 1994
- 01985 to 1989
- 01980 to 1984
- 51975 to 1979
- 01970 to 1974
- 01965 to 1969
- 0Before 1965
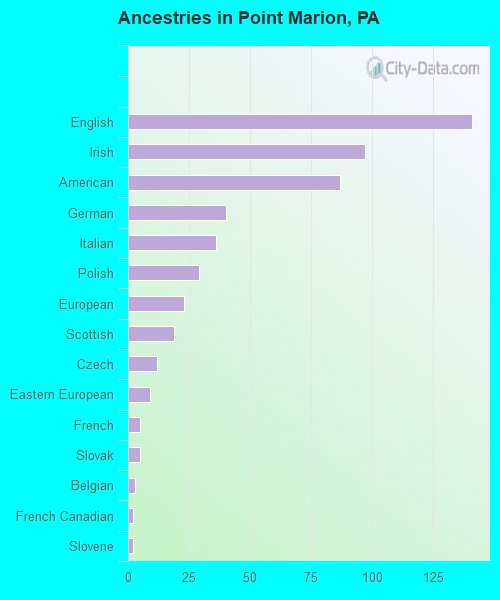
First ancestries reported:
- English: 141 (25.9%)
- Irish: 97 (17.8%)
- American: 87 (16.0%)
- German: 40 (7.4%)
- Italian: 36 (6.6%)
- Polish: 29 (5.3%)
- European: 23 (4.2%)
- Scottish: 19 (3.5%)
- Czech: 12 (2.2%)
- Eastern European: 9 (1.7%)
- French: 5 (0.9%)
- Slovak: 5 (0.9%)
- Belgian: 3 (0.6%)
- French Canadian: 2 (0.4%)
- Slovene: 2 (0.4%)
- Hungarian: 1 (0.2%)
Most common places of birth for foreign-born residents (%):
| Point Marion: | 75.0% (15) |
| Pennsylvania: | 5.2% (26,656) |
| Point Marion: | 25.0% (5) |
| Pennsylvania: | 3.0% (15,200) |
Place of birth for U.S.-born residents:
- This state: 550
- Other state: 803
- Northeast: 56
- Midwest: 116
- South: 535
- West: 57
88.4% of Point Marion residents lived in the same house 1 years ago.
Out of people who lived in different houses, 24.1% lived in this county.
Out of people who lived in different counties, 22.2% lived in Pennsylvania.
| Point Marion: | 88.4% |
| State average: | 89.3% |
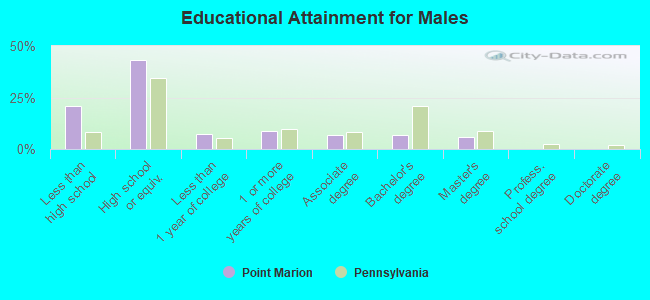
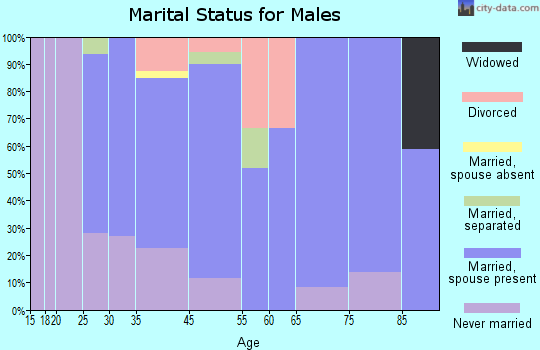
Education attainment for males 25 years and older:
- No schooling: 3
- Nursery to 4th grade: 0
- 5th and 6th grade: 0
- 7th and 8th grade: 10
- 9th grade: 15
- 10th grade: 2
- 11th grade: 47
- 12th grade, no diploma: 8
- High school graduate (or equivalency): 174
- Less than 1 year of college: 30
- Some college more than 1 year, no degree: 35
- Associate degree: 28
- Bachelor's degree: 28
- Master's degree: 23
- Professional school degree: 0
- Doctorate degree: 0
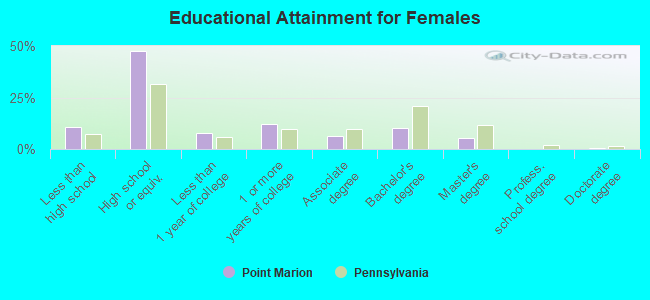
Education attainment for females 25 years and older:
- No schooling: 2
- Nursery to 4th grade: 0
- 5th and 6th grade: 1
- 7th and 8th grade: 2
- 9th grade: 1
- 10th grade: 12
- 11th grade: 11
- 12th grade, no diploma: 15
- High school graduate (or equivalency): 199
- Less than 1 year of college: 32
- Some college more than 1 year, no degree: 50
- Associate degree: 26
- Bachelor's degree: 42
- Master's degree: 22
- Professional school degree: 0
- Doctorate degree: 3
Housing units in structures:
- One, detached: 427
- One, attached: 24
- Two: 6
- 3 or 4: 27
- 5 to 9: 18
- 10 to 19: 14
Housing units lacking complete kitchen facilities in 2022: 3.1%
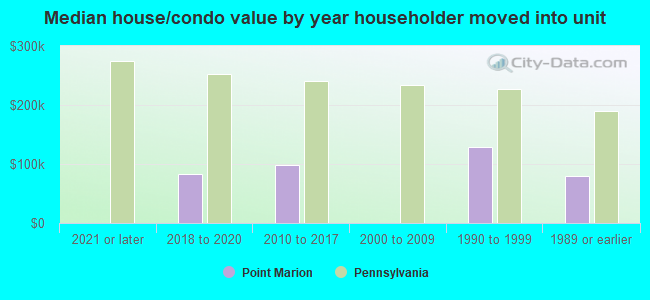
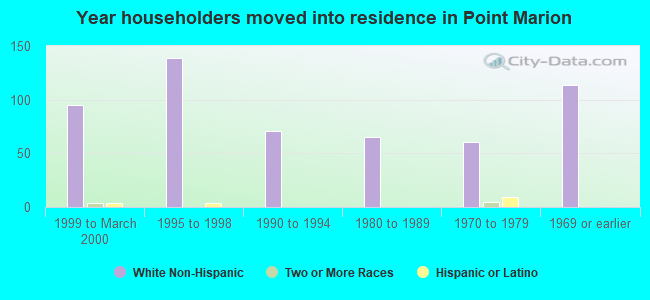
House/condo owner moved in on average 16 years ago
Renter moved in on average 4 years ago
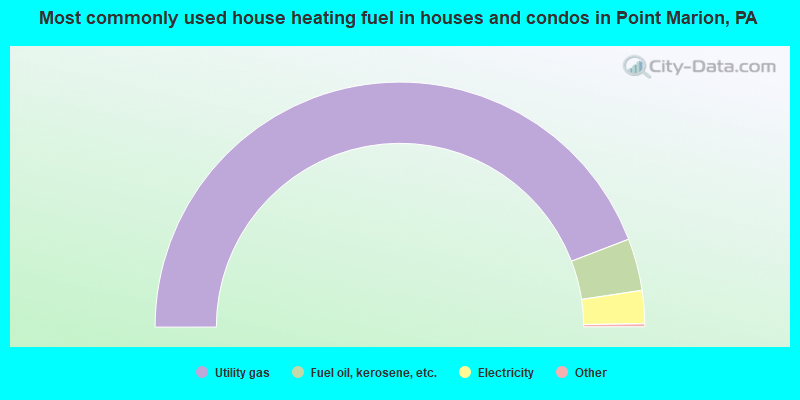
- 88.7%Utility gas
- 6.9%Fuel oil, kerosene, etc.
- 4.4%Electricity
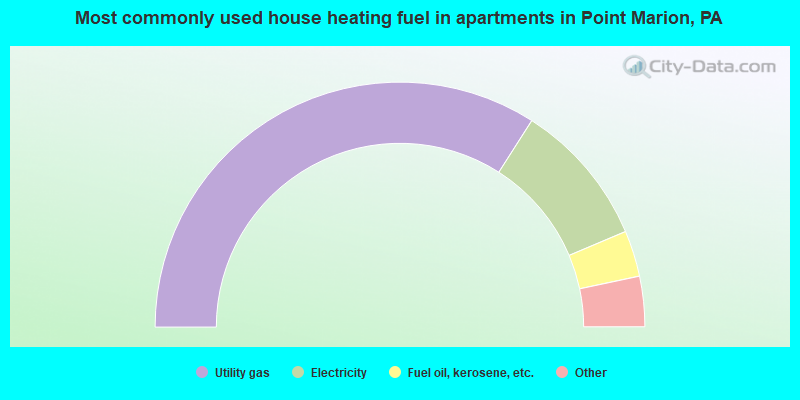
- 68.5%Utility gas
- 19.3%Electricity
- 6.1%Fuel oil, kerosene, etc.
- 2.2%Bottled, tank, or LP gas
- 2.2%Wood
- 1.7%Coal or coke
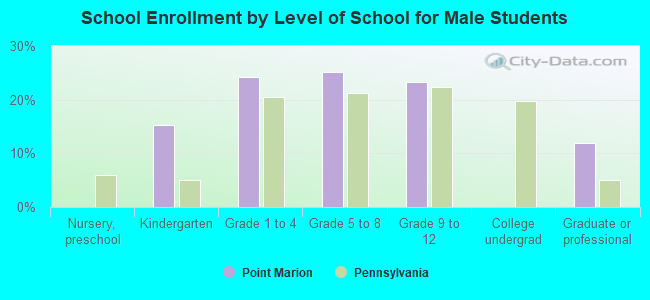
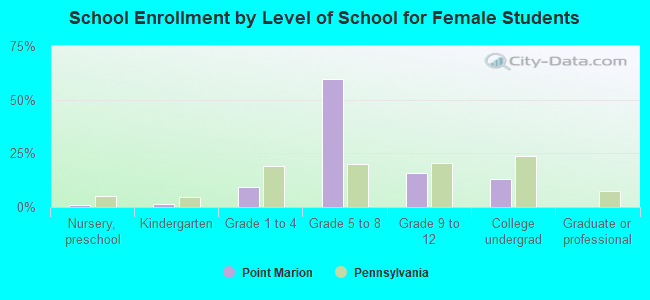
Private vs. public school enrollment:
| Here: | 9.9% |
| Pennsylvania: | 15.7% |
| Here: | 1.8% |
| Pennsylvania: | 13.4% |
| Here: | 0.0% |
| Pennsylvania: | 39.8% |