Potosi, TX (Texas) Houses and Residents
| Potosi: | $289,288 |
| Texas: | $275,400 |
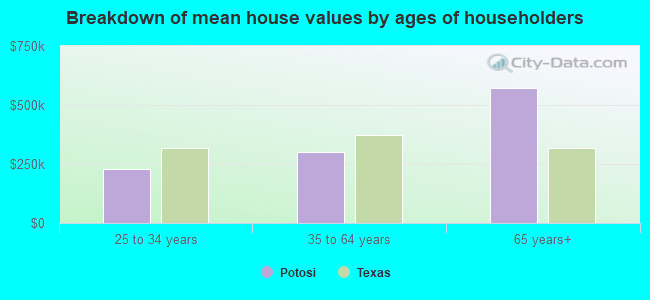
Mean price in 2022:
Detached houses: $410,702
Here: $410,702 State: $369,058 Mobile homes: $101,420
Here: $101,420 State: $124,413
Total population: 2,991 (Urban population: 0, Rural population: 1,652 (58 farm, 1,594 nonfarm))
Houses: 1,694 (1,517 occupied: 1,344 owner occupied, 142 renter occupied)
| % of renters here: | 10% |
| State: | 38% |
Housing density: 92 houses/condos per square mile
Median price asked for vacant for-sale houses and condos in 2022 in this county: $257,624.
Median contract rent in 2022: $1,339 (lower quartile is $1,230, upper quartile is $1,516)
Median gross rent in Potosi, TX in 2022: $1,583
Housing units in Potosi with a mortgage: 904 (16 second mortgage, 0 home equity loan, 0 both second mortgage and home equity loan)
Houses without a mortgage: 0
Median household income for houses/condos with a mortgage: $119,215
Median household income for apartments without a mortgage: $48,195
Median monthly housing costs: $1,664
Compare current foreclosures near Potosi, TX:
| Photo | Address | Area | Beds / Baths | Price | Details |
|---|---|---|---|---|---|

|
#1
Tanglewood Rd
Abilene, TX 79605
|
2,415 sq. feet
|
3 baths 3 beds |
$384,900
|
show details |

|
#2
Horseshoe Cir
Abilene, TX 79602
|
2,055 sq. feet
|
2 baths 4 beds |
show details | |

|
#3
County Road 252
Clyde, TX 79510
|
1,470 sq. feet
|
3 baths 3 beds |
show details | |

|
#4
Texas Ave
Abilene, TX 79605
|
1,580 sq. feet
|
2 baths 3 beds |
show details | |

|
#5
S Willis St
Abilene, TX 79605
|
1,898 sq. feet
|
1 baths 3 beds |
show details | |

|
#6
Minter Ln
Abilene, TX 79603
|
1,859 sq. feet
|
2 baths 3 beds |
show details | |

|
#7
Gas House Rd
Clyde, TX 79510
|
1,284 sq. feet
|
2 baths 3 beds |
show details | |

|
#8
Highland Ave
Abilene, TX 79605
|
1,444 sq. feet
|
1 baths 3 beds |
show details | |

|
#9
S Saddle Lakes Dr
Abilene, TX 79602
|
2,759 sq. feet
|
2 baths 4 beds |
show details | |

|
#10
Woodlake Dr
Abilene, TX 79606
|
2,519 sq. feet
|
3 baths 4 beds |
show details |
| Photo | Address | Area | Beds / Baths | Price | Details |
|---|---|---|---|---|---|

|
#11
Lexington Ave
Abilene, TX 79605
|
1,200 sq. feet
|
1 baths 2 beds |
show details | |

|
#12
Aztec Dr
Abilene, TX 79605
|
1,008 sq. feet
|
1 baths 2 beds |
show details | |

|
#13
Bluebird Ln
Abilene, TX 79602
|
2,005 sq. feet
|
2 baths 2 beds |
show details | |

|
#14
Vogel St
Abilene, TX 79603
|
1,328 sq. feet
|
2 baths 3 beds |
show details | |

|
#15
Green St
Abilene, TX 79603
|
1,342 sq. feet
|
1 baths 3 beds |
show details | |

|
#16
Sayles Blvd
Abilene, TX 79605
|
4,492 sq. feet
|
4 baths 4 beds |
show details | |

|
#17
Lisa Ln
Abilene, TX 79601
|
2,191 sq. feet
|
2 baths 3 beds |
show details | |

|
#18
Hickory St
Abilene, TX 79601
|
1,440 sq. feet
|
- baths 3 beds |
show details | |

|
#19
Chestnut St
Abilene, TX 79602
|
1,565 sq. feet
|
1 baths 2 beds |
show details | |

|
#20
Countryside Cir
Abilene, TX 79606
|
1,924 sq. feet
|
2 baths 3 beds |
show details |
| Photo | Address | Area | Beds / Baths | Price | Details |
|---|---|---|---|---|---|

|
#21
Old Anson Rd
Abilene, TX 79603
|
992 sq. feet
|
2 baths 2 beds |
show details | |

|
#22
Hoylake Dr
Abilene, TX 79606
|
1,939 sq. feet
|
2 baths 3 beds |
show details | |

|
#23
Tamarisk Cir
Abilene, TX 79606
|
2,189 sq. feet
|
3 baths 3 beds |
show details | |

|
#24
Lollipop Trl
Abilene, TX 79602
|
1,490 sq. feet
|
2 baths 3 beds |
show details | |

|
#25
Russell Ave
Abilene, TX 79605
|
1,082 sq. feet
|
1 baths - beds |
show details | |

|
#26
Kings Ct
Abilene, TX 79605
|
2,490 sq. feet
|
2 baths - beds |
show details | |

|
#27
Oaklawn Dr
Abilene, TX 79606
|
1,491 sq. feet
|
2 baths - beds |
show details | |

|
#28
Sayles Blvd
Abilene, TX 79605
|
2,808 sq. feet
|
1 baths - beds |
show details | |

|
#29
S 5th St
Abilene, TX 79602
|
1,627 sq. feet
|
1 baths - beds |
show details | |

|
#30
Marsalis Dr
Abilene, TX 79603
|
1,509 sq. feet
|
- baths 2 beds |
show details |
| Photo | Address | Area | Beds / Baths | Price | Details |
|---|---|---|---|---|---|

|
#31
Fm 382
Ovalo, TX 79541
|
1,424 sq. feet
|
1 baths - beds |
show details | |

|
#32
Pennington Rd
Abilene, TX 79602
|
1,624 sq. feet
|
1 baths - beds |
show details | |

|
#33
Sammons St
Abilene, TX 79605
|
1,371 sq. feet
|
1 baths - beds |
show details | |

|
#34
Indian Creek Dr
Tye, TX 79563
|
1,470 sq. feet
|
1 baths - beds |
show details | |

|
#35
Swenson St
Abilene, TX 79603
|
2,640 sq. feet
|
1 baths - beds |
show details | |

|
#36
Mary Lou Ln
Abilene, TX 79606
|
2,011 sq. feet
|
2 baths - beds |
show details | |

|
#37
Rosewood Dr
Abilene, TX 79603
|
2,041 sq. feet
|
2 baths - beds |
show details | |

|
#38
Burger St
Abilene, TX 79603
|
1,629 sq. feet
|
1 baths - beds |
show details | |

|
#39
Riverside Blvd
Abilene, TX 79605
|
2,136 sq. feet
|
2 baths - beds |
show details | |

|
#40
S La Salle Dr
Abilene, TX 79605
|
1,427 sq. feet
|
1 baths - beds |
show details |
| Photo | Address | Area | Beds / Baths | Price | Details |
|---|---|---|---|---|---|

|
#41
S La Salle Dr
Abilene, TX 79605
|
1,324 sq. feet
|
1 baths - beds |
show details | |

|
#42
Westview Dr
Abilene, TX 79603
|
1,538 sq. feet
|
2 baths - beds |
show details | |

|
#43
Westview Dr
Abilene, TX 79603
|
1,272 sq. feet
|
2 baths - beds |
show details | |

|
#44
Westwood Dr
Abilene, TX 79603
|
1,898 sq. feet
|
2 baths - beds |
show details | |

|
#45
S Jefferson Dr
Abilene, TX 79605
|
1,234 sq. feet
|
- baths 3 beds |
show details | |

|
#46
Rountree Dr
Abilene, TX 79601
|
1,053 sq. feet
|
1 baths - beds |
show details | |

|
#47
Todd Trl
Abilene, TX 79602
|
1,100 sq. feet
|
2 baths - beds |
show details | |

|
#48
Burger St
Abilene, TX 79603
|
1,412 sq. feet
|
1 baths - beds |
show details | |

|
#49
Covey Ln
Abilene, TX 79605
|
1,196 sq. feet
|
2 baths - beds |
show details | |

|
Check over 1 million property listings on Foreclosure.com!
|
browse all offers | |||

Latest news about housing in Potosi, TX collected exclusively by city-data.com from local newspapers, TV, and radio stations

 | Abilene, Tx: Worst city in Texas hands down!! (62 replies) |
| Abilene & Surrounds: House Rental Norms? (5 replies) |
| California Style Mexican Food in Houston (155 replies) |
| 10 Texas restaurants that you must eat at at least once. (96 replies) |
| How do you like your tacos? (47 replies) |
| Anybody drives to Monterrey, Mexico (24 replies) |

Median year apartment built: 1985
Household type by relationship:
Households: 4,776- Male householders: 817 (124 living alone), Female householders: 691 (61 living alone)
1,218 spouses (1,196 opposite-sex spouses), 207 unmarried partners, (207 opposite-sex unmarried partners), 1,633 children (1,491 natural, 9 adopted, 131 stepchildren), 33 grandchildren, 38 brothers or sisters, 108 parents, 0 foster children, 16 other relatives, 12 non-relatives
Size of family households: 352 2-persons, 457 3-persons, 135 4-persons, 212 5-persons, 14 6-persons, 12 7-or-more-persons.
Size of nonfamily households: 182 1-person, 105 2-persons.
1,214 married couples with children.
99 single-parent households (0 men, 99 women).
85.6% of residents of Potosi speak English at home.
5.2% of residents speak Spanish at home (100% speak English very well).
0.5% of residents speak other Indo-European language at home (100% speak English very well).
8.5% of residents speak Asian or Pacific Island language at home (70% speak English very well, 30% speak English not well).
0.3% of residents speak other language at home (100% speak English very well).
Foreign born population: 688 (14.4%)
(57.7% of them are naturalized citizens)
| Here: | 6.3 |
| State: | 6.3 |
| Here: | 6.1 |
| State: | 4.0 |
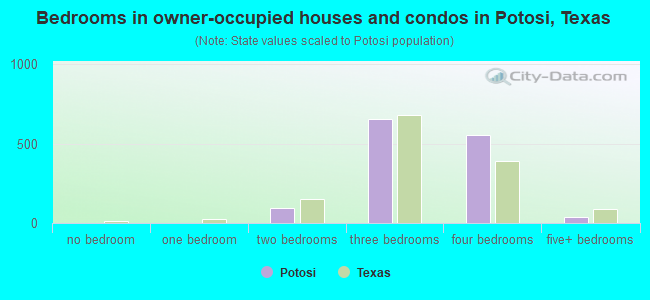
- Bedrooms in owner-occupied houses and condos in Potosi, Texas
- 0no bedroom
- 01 bedroom
- 972 bedrooms
- 6553 bedrooms
- 5564 bedrooms
- 365+ bedrooms
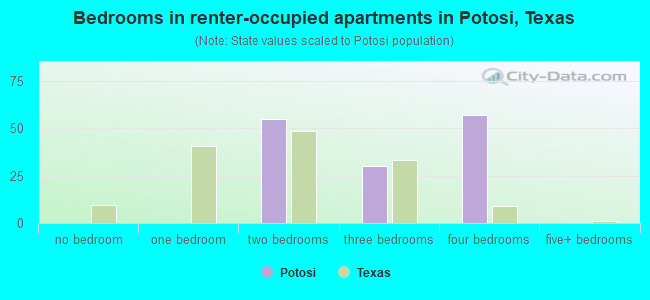
- Bedrooms in renter-occupied apartments in Potosi, Texas
- 0no bedroom
- 01 bedroom
- 552 bedrooms
- 303 bedrooms
- 574 bedrooms
- 05+ bedrooms
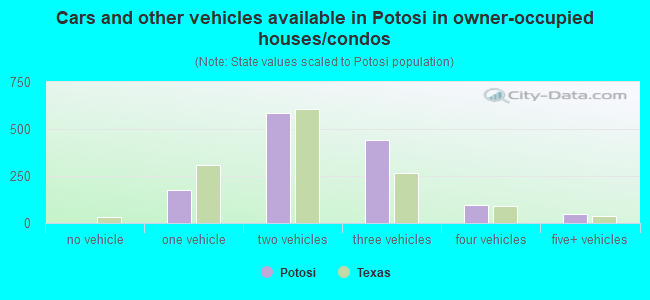
- Cars and other vehicles available in Potosi in owner-occupied houses/condos
- 0no vehicle
- 1741 vehicle
- 5832 vehicles
- 4403 vehicles
- 974 vehicles
- 505+ vehicles
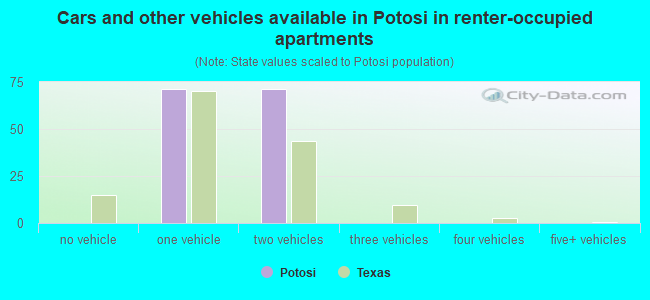
- Cars and other vehicles available in Potosi in renter-occupied apartments
- 0no vehicle
- 711 vehicle
- 712 vehicles
- 03 vehicles
- 04 vehicles
- 05+ vehicles
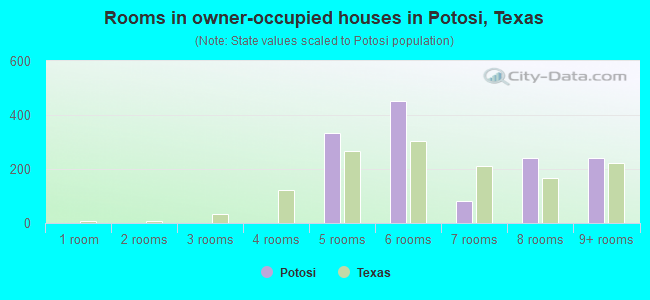
- Rooms in owner-occupied houses in Potosi, Texas
- 01 room
- 02 rooms
- 03 rooms
- 04 rooms
- 3325 rooms
- 4506 rooms
- 817 rooms
- 2418 rooms
- 2409+ rooms
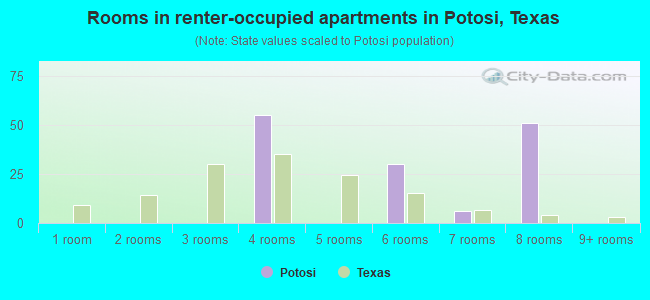
- Rooms in renter-occupied apartments in Potosi, Texas
- 01 room
- 02 rooms
- 03 rooms
- 554 rooms
- 05 rooms
- 306 rooms
- 67 rooms
- 518 rooms
- 09+ rooms
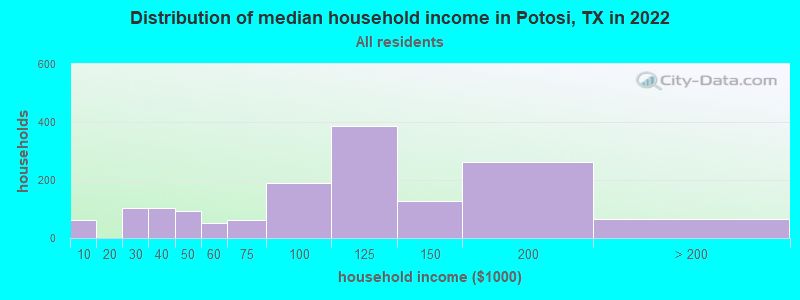
Potosi, TX household income distribution

- 62Less than $10,000
- 102$20,000 to $29,999
- 105$30,000 to $39,999
- 92$40,000 to $49,999
- 51$50,000 to $59,999
- 62$60,000 to $74,999
- 189$75,000 to $99,999
- 385$100,000 to $124,999
- 127$125,000 to $149,999
- 263$150,000 to $199,999
- 64$200,000 or more
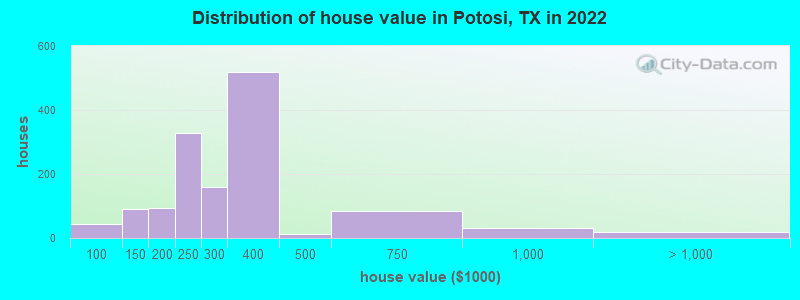
Home value of owner - occupied houses in 2022 in Potosi, TX
-
- 18$50,000 to $59,999
- 13$80,000 to $89,999
- 13$90,000 to $99,999
- 30$100,000 to $124,999
- 60$125,000 to $149,999
- 36$150,000 to $174,999
- 57$175,000 to $199,999
- 328$200,000 to $249,999
- 158$250,000 to $299,999
- 518$300,000 to $399,999
- 11$400,000 to $499,999
- 83$500,000 to $749,999
- 29$750,000 to $999,999
- 10$1,000,000 to $1,499,999
- 8$2,000,000 or more
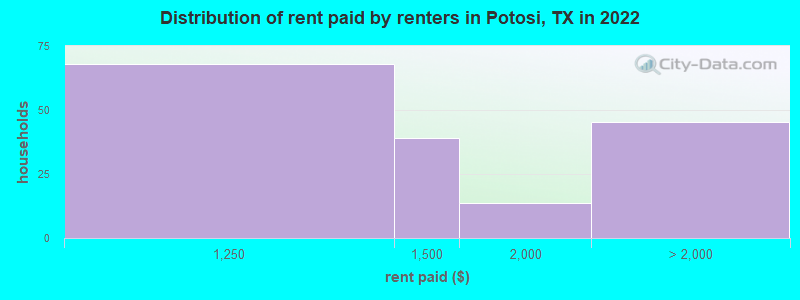
Rent paid by renters in 2022 in Potosi, TX
-
- 67$1,000 to $1,249
- 39$1,250 to $1,499
- 13$1,500 to $1,999
- 6$3,000 to $3,499
- 39No cash rent
Percentage of workers working in this county: 88.9%
Number of people working at home: 94 (3.9% of all workers)
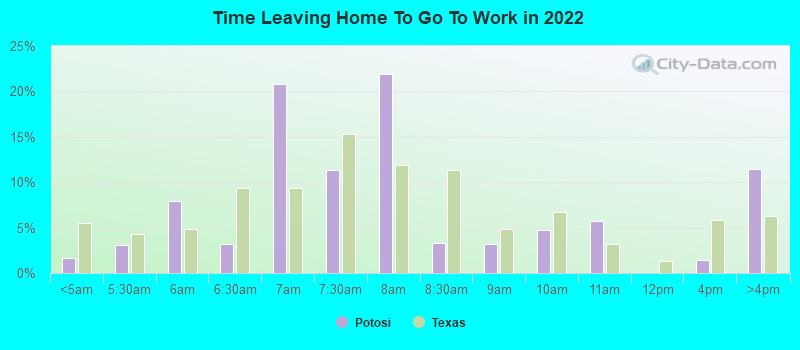
Travel time to work (commute)
- Less than 5 minutes: 9
- 5 to 9 minutes: 91
- 10 to 14 minutes: 96
- 15 to 19 minutes: 638
- 20 to 24 minutes: 943
- 25 to 29 minutes: 242
- 30 to 34 minutes: 298
- 35 to 39 minutes: 0
- 40 to 44 minutes: 0
- 45 to 59 minutes: 51
- 60 to 89 minutes: 27
- 90 or more minutes: 6
Means of transportation to work:
- Drove a car alone: 716 (87.4%)
- Carpooled: 81 (9.9%)
- Motorcycle: 9 (1.1%)
- Worked at home: 13 (1.6%)
- Unemployment by race in 2022
- Unemployment rate for White non-Hispanic residents
- 7.7%Females
- Unemployment rate for Asian residents
- 17.0%Females
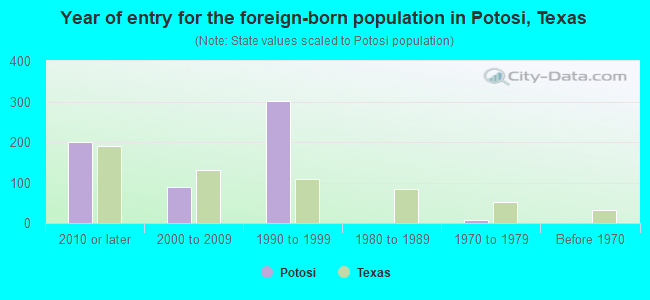
- Year of entry for the foreign-born population in Potosi, Texas
- 2012010 or later
- 882000 to 2009
- 3001990 to 1999
- 01980 to 1989
- 81970 to 1979
- 0Before 1970
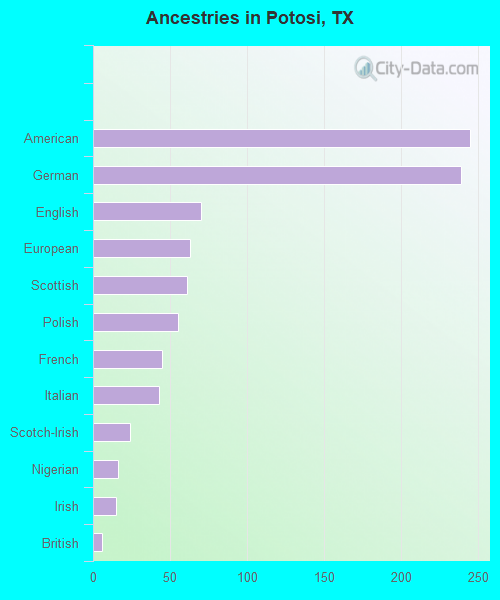
First ancestries reported:
- American: 245 (11.1%)
- German: 239 (10.9%)
- English: 70 (3.2%)
- European: 63 (2.9%)
- Scottish: 61 (2.8%)
- Polish: 55 (2.5%)
- French: 45 (2.0%)
- Italian: 43 (2.0%)
- Scotch-Irish: 24 (1.1%)
- Nigerian: 16 (0.7%)
- Irish: 15 (0.7%)
- British: 6 (0.3%)
Most common places of birth for foreign-born residents (%):
| Potosi: | 25.9% (159) |
| Texas: | 1.2% (60,172) |
| Potosi: | 20.0% (123) |
| Texas: | 3.7% (184,770) |
| Potosi: | 17.9% (110) |
| Texas: | 1.2% (61,555) |
| Potosi: | 12.8% (79) |
| Texas: | 0.2% (9,997) |
| Potosi: | 8.8% (54) |
| Texas: | 48.4% (2,411,723) |
| Potosi: | 3.3% (20) |
| Texas: | 0.8% (37,989) |
| Potosi: | 3.1% (19) |
| Texas: | 0.4% (21,746) |
| Potosi: | 2.8% (17) |
| Texas: | 2.1% (103,148) |
| Potosi: | 2.3% (14) |
| Texas: | 1.9% (96,110) |
| Potosi: | 1.8% (11) |
| Texas: | 0.4% (20,885) |
| Potosi: | 1.6% (10) |
| Texas: | 1.1% (55,371) |
Place of birth for U.S.-born residents:
- This state: 2,842
- Other state: 1,200
- Northeast: 40
- Midwest: 252
- South: 461
- West: 454
87.5% of Potosi residents lived in the same house 1 years ago.
Out of people who lived in different houses, 21.9% lived in this county.
Out of people who lived in different counties, 59.4% lived in Texas.
| Potosi: | 87.5% |
| State average: | 85.7% |
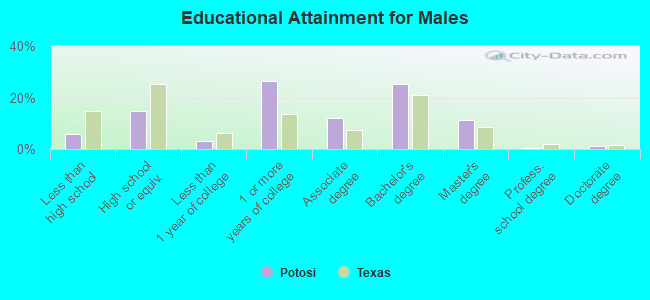
Education attainment for males 25 years and older:
- No schooling: 0
- Nursery to 4th grade: 0
- 5th and 6th grade: 0
- 7th and 8th grade: 0
- 9th grade: 0
- 10th grade: 61
- 11th grade: 0
- 12th grade, no diploma: 22
- High school graduate (or equivalency): 212
- Less than 1 year of college: 44
- Some college more than 1 year, no degree: 379
- Associate degree: 173
- Bachelor's degree: 366
- Master's degree: 163
- Professional school degree: 6
- Doctorate degree: 17
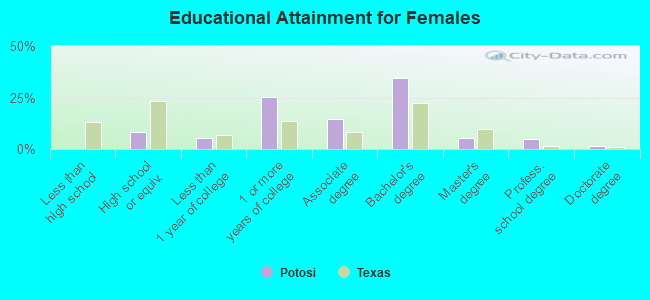
Education attainment for females 25 years and older:
- No schooling: 0
- Nursery to 4th grade: 0
- 5th and 6th grade: 0
- 7th and 8th grade: 0
- 9th grade: 0
- 10th grade: 0
- 11th grade: 0
- 12th grade, no diploma: 0
- High school graduate (or equivalency): 135
- Less than 1 year of college: 89
- Some college more than 1 year, no degree: 417
- Associate degree: 239
- Bachelor's degree: 569
- Master's degree: 89
- Professional school degree: 81
- Doctorate degree: 24


Housing units in structures:
- One, detached: 1,474
- One, attached: 26
- Mobile homes: 194
Housing units lacking complete kitchen facilities in 2022: 2.8%
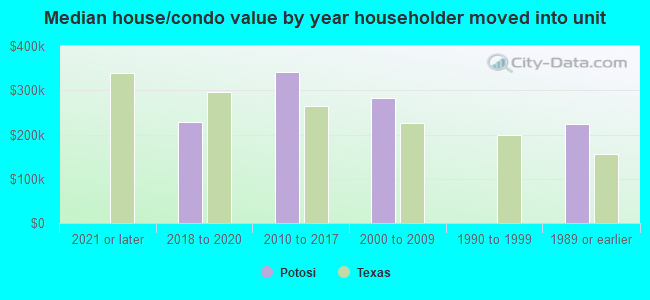
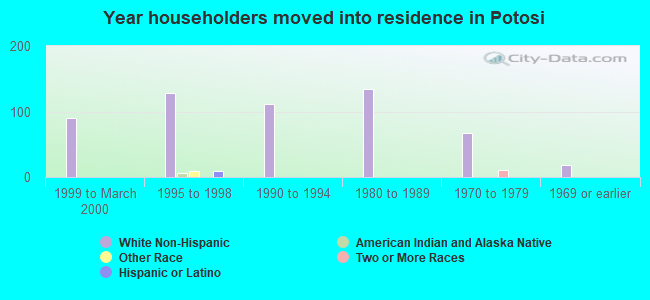
House/condo owner moved in on average 6 years ago
Renter moved in on average 0 years ago
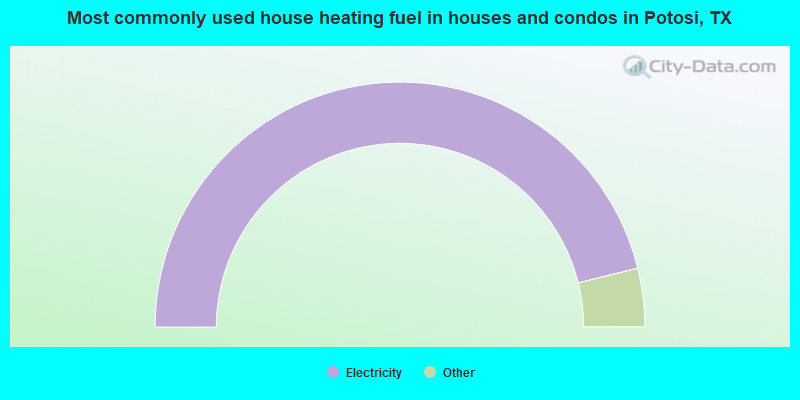
- 92.3%Electricity
- 3.4%Bottled, tank, or LP gas
- 3.3%Wood
- 0.9%Utility gas
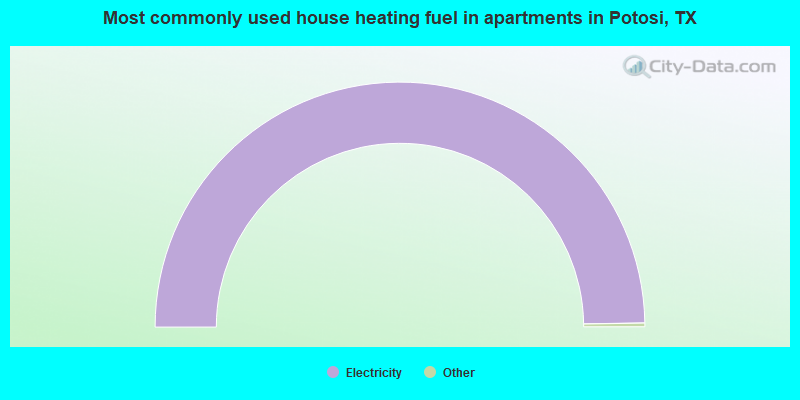
- 100.0%Electricity
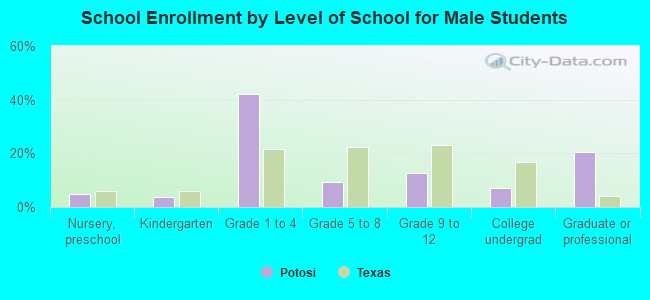
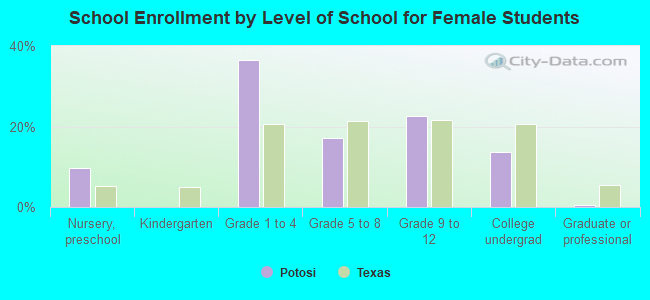
Private vs. public school enrollment:
| Here: | 22.9% |
| Texas: | 8.8% |
| Here: | 0.0% |
| Texas: | 8.0% |
| Here: | 0.0% |
| Texas: | 16.2% |