Powder Springs, GA (Georgia) Houses and Residents
| Powder Springs: | $278,140 |
| Georgia: | $297,400 |
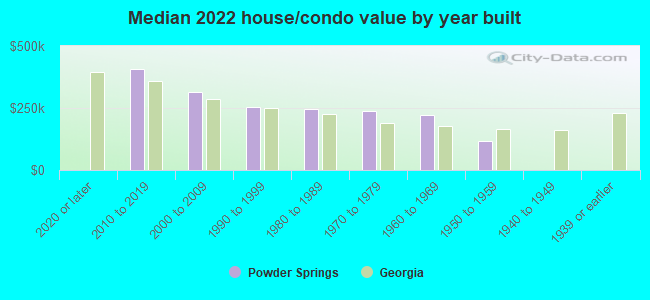
Mean price in 2022:
Detached houses: $243,919
Here: $243,919 State: $376,364 Townhouses or other attached units: $249,511
Here: $249,511 State: $341,709 In 3-to-4-unit structures: $66,366
Here: $66,366 State: $250,092
Total population: 14,590 (Urban population: 12,928, Rural population: 52 (all nonfarm))
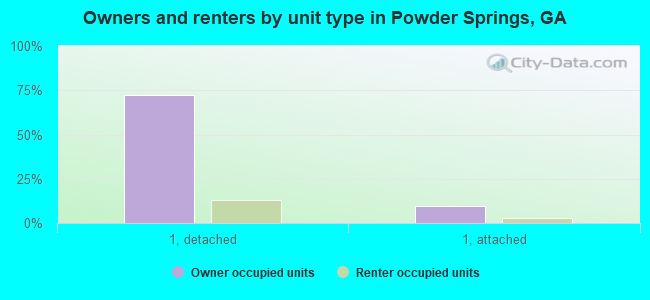
Houses: 6,307 (6,187 occupied: 4,912 owner occupied, 1,317 renter occupied)
| % of renters here: | 21% |
| State: | 34% |
Housing density: 995 houses/condos per square mile
Median price asked for vacant for-sale houses and condos in 2022: $192,220.
Median contract rent in 2022: $1,486 (lower quartile is $1,059, upper quartile is $1,709)
Median rent asked for vacant for-rent units in 2022: $1,900
Median gross rent in Powder Springs, GA in 2022: $1,788
Housing units in Powder Springs with a mortgage: 3,857 (193 second mortgage, 15 home equity loan, 146 both second mortgage and home equity loan)
Houses without a mortgage: 31
Median household income for houses/condos with a mortgage: $108,211
Median household income for apartments without a mortgage: $72,921
Median monthly housing costs: $1,446
Compare current foreclosures in Powder Springs, GA:
| Photo | Address | Area | Beds / Baths | Price | Details |
|---|---|---|---|---|---|

|
#1
Brown Rd
Powder Springs, GA 30127
|
3,469 sq. feet
|
2 baths 3 beds |
show details | |

|
#2
Goldenwood Ct
Powder Springs, GA 30127
|
2,958 sq. feet
|
3 baths 5 beds |
show details | |

|
#3
Split Wood Way
Powder Springs, GA 30127
|
2,248 sq. feet
|
3 baths 3 beds |
show details | |

|
#4
Defoors Farm Trl
Powder Springs, GA 30127
|
2,458 sq. feet
|
3 baths 4 beds |
show details | |

|
#5
Boone Hall Dr
Powder Springs, GA 30127
|
- sq. feet
|
3 baths 4 beds |
show details | |

|
#6
Homewood Ln
Powder Springs, GA 30127
|
2,234 sq. feet
|
2 baths 3 beds |
show details | |

|
#7
New Horizon St
Powder Springs, GA 30127
|
948 sq. feet
|
2 baths 2 beds |
show details | |

|
#8
Sweetsprings Dr SW
Powder Springs, GA 30127
|
1,989 sq. feet
|
3 baths 3 beds |
show details | |

|
#9
Sweetwater Pass
Powder Springs, GA 30127
|
1,608 sq. feet
|
2 baths 3 beds |
show details | |

|
#10
Angie Ct
Powder Springs, GA 30127
|
2,158 sq. feet
|
2 baths 3 beds |
show details |
| Photo | Address | Area | Beds / Baths | Price | Details |
|---|---|---|---|---|---|

|
#11
Brownsville Rd
Powder Springs, GA 30127
|
1,396 sq. feet
|
2 baths 3 beds |
show details | |

|
#12
Central Park Ln
Powder Springs, GA 30127
|
2,776 sq. feet
|
2 baths 3 beds |
show details | |

|
#13
Arrow Wind Dr
Powder Springs, GA 30127
|
2,410 sq. feet
|
2 baths 4 beds |
show details | |

|
#14
Mistymorn Pl
Powder Springs, GA 30127
|
2,029 sq. feet
|
5 baths 4 beds |
show details | |

|
#15
Defoors Farm Trl
Powder Springs, GA 30127
|
3,958 sq. feet
|
3 baths 3 beds |
show details | |

|
#16
Sharon Dr
Powder Springs, GA 30127
|
1,110 sq. feet
|
1 baths 3 beds |
show details | |

|
#17
Bramlett Way
Powder Springs, GA 30127
|
1,569 sq. feet
|
2 baths 3 beds |
show details | |

|
#18
Woodbridge Dr
Powder Springs, GA 30127
|
1,586 sq. feet
|
2 baths 3 beds |
show details | |

|
#19
Breckenridge Ct
Powder Springs, GA 30127
|
1,398 sq. feet
|
2 baths 3 beds |
show details | |

|
#20
Grandiflora Pl
Powder Springs, GA 30127
|
2,082 sq. feet
|
2 baths 4 beds |
show details |
| Photo | Address | Area | Beds / Baths | Price | Details |
|---|---|---|---|---|---|

|
#21
Grandview Cir
Powder Springs, GA 30127
|
1,568 sq. feet
|
2 baths 3 beds |
show details | |

|
#22
New Macland Rd
Powder Springs, GA 30127
|
1,362 sq. feet
|
2 baths 4 beds |
show details | |

|
#23
Flowers Rdg
Powder Springs, GA 30127
|
1,574 sq. feet
|
3 baths 5 beds |
show details | |

|
#24
Marvin Park
Powder Springs, GA 30127
|
1,564 sq. feet
|
2 baths 3 beds |
show details | |

|
#25
Whitfield Way
Powder Springs, GA 30127
|
1,596 sq. feet
|
2 baths 3 beds |
show details | |

|
#26
Arrow Wind Dr
Powder Springs, GA 30127
|
2,747 sq. feet
|
4 baths 4 beds |
show details | |

|
#27
Hiram Lithia Springs Rd
Powder Springs, GA 30127
|
1,541 sq. feet
|
1 baths 3 beds |
show details | |

|
#28
Windbrooke Ct
Powder Springs, GA 30127
|
2,309 sq. feet
|
2 baths 4 beds |
show details | |

|
#29
Graceland Ct
Powder Springs, GA 30127
|
2,397 sq. feet
|
2 baths 3 beds |
show details | |

|
#30
Captain Mathes Dr
Powder Springs, GA 30127
|
2,543 sq. feet
|
3 baths 3 beds |
show details |
| Photo | Address | Area | Beds / Baths | Price | Details |
|---|---|---|---|---|---|

|
#31
Arapaho Dr
Powder Springs, GA 30127
|
2,709 sq. feet
|
2 baths 4 beds |
show details | |

|
#32
Lakeland Ct
Powder Springs, GA 30127
|
3,076 sq. feet
|
3 baths 3 beds |
show details | |

|
#33
Hiram Lithia Springs Rd
Powder Springs, GA 30127
|
1,036 sq. feet
|
2 baths 3 beds |
show details | |

|
#34
Willow Oak Trl
Powder Springs, GA 30127
|
3,996 sq. feet
|
2 baths 4 beds |
show details | |

|
#35
Starboard Dr
Powder Springs, GA 30127
|
1,676 sq. feet
|
2 baths 3 beds |
show details | |

|
#36
Bramlett Way
Powder Springs, GA 30127
|
2,055 sq. feet
|
2 baths 3 beds |
show details | |

|
#37
Meadows Lake Dr
Powder Springs, GA 30127
|
2,589 sq. feet
|
2 baths 4 beds |
show details | |

|
#38
Stallion Ct
Powder Springs, GA 30127
|
1,232 sq. feet
|
2 baths 3 beds |
show details | |

|
#39
Wager Ct
Powder Springs, GA 30127
|
1,513 sq. feet
|
2 baths 3 beds |
show details | |

|
#40
Linkside Dr
Powder Springs, GA 30127
|
2,174 sq. feet
|
2 baths 3 beds |
show details |
| Photo | Address | Area | Beds / Baths | Price | Details |
|---|---|---|---|---|---|

|
#41
Five Oaks Ct
Powder Springs, GA 30127
|
1,934 sq. feet
|
3 baths 3 beds |
show details | |

|
#42
Saint Claire Pl
Powder Springs, GA 30127
|
1,487 sq. feet
|
2 baths 3 beds |
show details | |

|
#43
Old Lost Mountain Rd
Powder Springs, GA 30127
|
1,550 sq. feet
|
1 baths 4 beds |
show details | |

|
#44
Caldera Xing
Powder Springs, GA 30127
|
2,321 sq. feet
|
3 baths 3 beds |
show details | |

|
#45
Long St
Powder Springs, GA 30127
|
782 sq. feet
|
2 baths 3 beds |
show details | |

|
#46
Country Cove Way
Powder Springs, GA 30127
|
1,704 sq. feet
|
2 baths 3 beds |
show details | |

|
#47
Alder Ln
Powder Springs, GA 30127
|
1,406 sq. feet
|
2 baths 3 beds |
show details | |

|
#48
Valley View St
Powder Springs, GA 30127
|
1,940 sq. feet
|
2 baths 4 beds |
show details | |

|
#49
Mistymorn Ln
Powder Springs, GA 30127
|
2,300 sq. feet
|
3 baths 4 beds |
show details | |

|
Check over 1 million property listings on Foreclosure.com!
|
browse all offers | |||


Median year apartment built: 1991
Household type by relationship:
Households: 17,065- Male householders: 2,531 (536 living alone), Female householders: 3,599 (942 living alone)
2,928 spouses (2,879 opposite-sex spouses), 258 unmarried partners, (215 opposite-sex unmarried partners), 5,568 children (5,185 natural, 65 adopted, 317 stepchildren), 383 grandchildren, 230 brothers or sisters, 493 parents, 0 foster children, 482 other relatives, 339 non-relatives
- In group quarters: 249
Size of family households: 1,696 2-persons, 1,302 3-persons, 875 4-persons, 391 5-persons, 179 6-persons, 120 7-or-more-persons.
Size of nonfamily households: 1,468 1-person, 97 2-persons, 140 3-persons.
2,435 married couples with children.
926 single-parent households (35 men, 891 women).
80.2% of residents of Powder Springs speak English at home.
12.0% of residents speak Spanish at home (67% speak English very well, 21% speak English well, 9% speak English not well, 3% don't speak English at all).
3.6% of residents speak other Indo-European language at home (84% speak English very well, 16% speak English well).
0.4% of residents speak Asian or Pacific Island language at home (28% speak English very well, 58% speak English well, 14% speak English not well).
3.8% of residents speak other language at home (91% speak English very well, 8% speak English well).
Foreign born population: 2,316 (13.6%)
(48.6% of them are naturalized citizens)
| Here: | 6.6 |
| State: | 6.8 |
| Here: | 5.9 |
| State: | 4.6 |
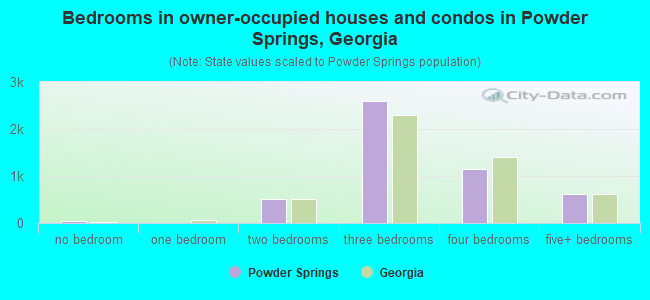
- Bedrooms in owner-occupied houses and condos in Powder Springs, Georgia
- 46no bedroom
- 01 bedroom
- 5202 bedrooms
- 2,5873 bedrooms
- 1,1514 bedrooms
- 6075+ bedrooms
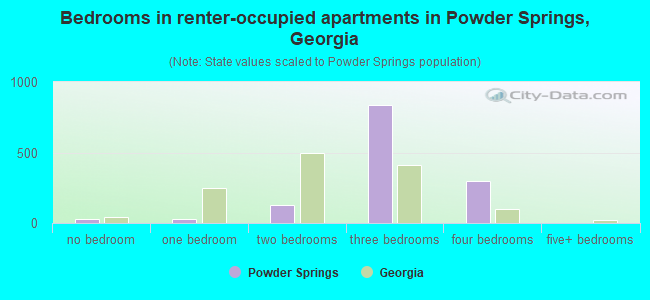
- Bedrooms in renter-occupied apartments in Powder Springs, Georgia
- 25no bedroom
- 251 bedroom
- 1302 bedrooms
- 8393 bedrooms
- 2994 bedrooms
- 05+ bedrooms
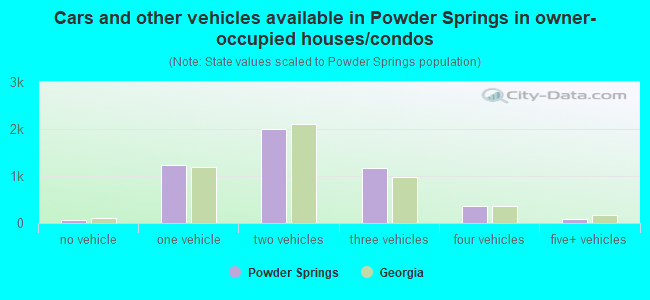
- Cars and other vehicles available in Powder Springs in owner-occupied houses/condos
- 71no vehicle
- 1,2291 vehicle
- 1,9992 vehicles
- 1,1653 vehicles
- 3634 vehicles
- 865+ vehicles
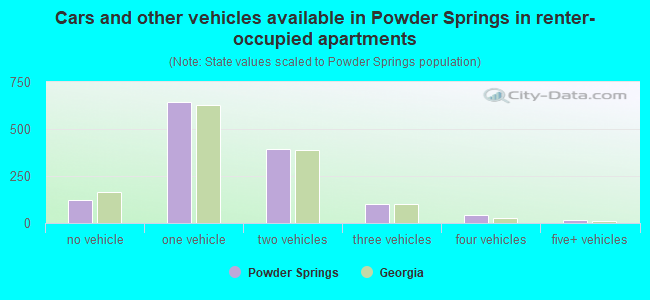
- Cars and other vehicles available in Powder Springs in renter-occupied apartments
- 124no vehicle
- 6441 vehicle
- 3922 vehicles
- 1003 vehicles
- 414 vehicles
- 155+ vehicles
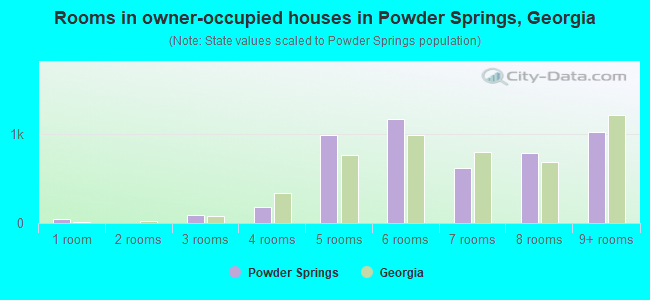
- Rooms in owner-occupied houses in Powder Springs, Georgia
- 421 room
- 42 rooms
- 923 rooms
- 1784 rooms
- 9915 rooms
- 1,1726 rooms
- 6177 rooms
- 7868 rooms
- 1,0309+ rooms
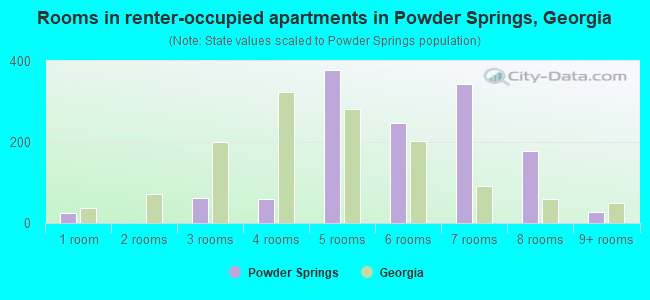
- Rooms in renter-occupied apartments in Powder Springs, Georgia
- 251 room
- 02 rooms
- 613 rooms
- 604 rooms
- 3775 rooms
- 2476 rooms
- 3427 rooms
- 1788 rooms
- 279+ rooms
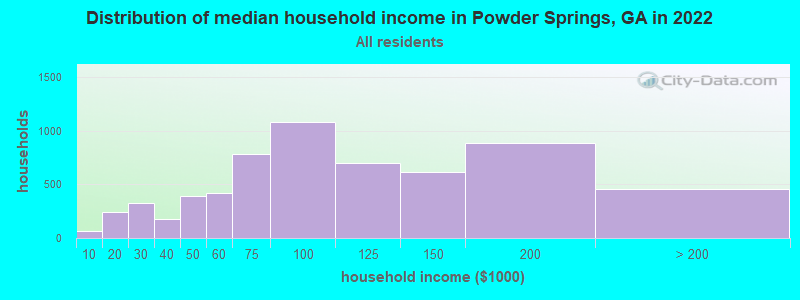
Powder Springs, GA household income distribution

- 67Less than $10,000
- 244$10,000 to $19,999
- 329$20,000 to $29,999
- 180$30,000 to $39,999
- 389$40,000 to $49,999
- 419$50,000 to $59,999
- 782$60,000 to $74,999
- 1,080$75,000 to $99,999
- 702$100,000 to $124,999
- 617$125,000 to $149,999
- 886$150,000 to $199,999
- 452$200,000 or more
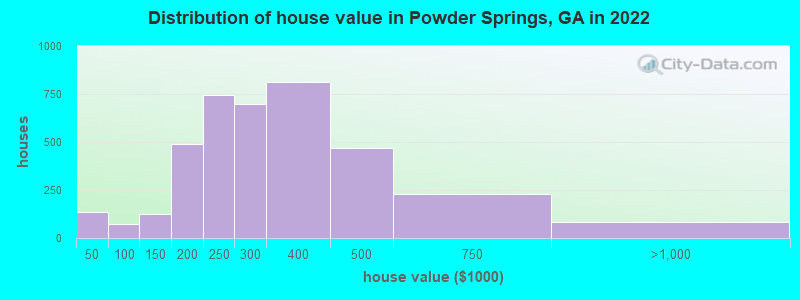
Home value of owner - occupied houses in 2022 in Powder Springs, GA
-
- 84Less than $10,000
- 17$10,000 to $14,999
- 11$15,000 to $19,999
- 15$20,000 to $24,999
- 8$40,000 to $49,999
- 14$80,000 to $89,999
- 50$90,000 to $99,999
- 33$100,000 to $124,999
- 92$125,000 to $149,999
- 259$150,000 to $174,999
- 229$175,000 to $199,999
- 747$200,000 to $249,999
- 697$250,000 to $299,999
- 812$300,000 to $399,999
- 470$400,000 to $499,999
- 231$500,000 to $749,999
- 84$750,000 to $999,999
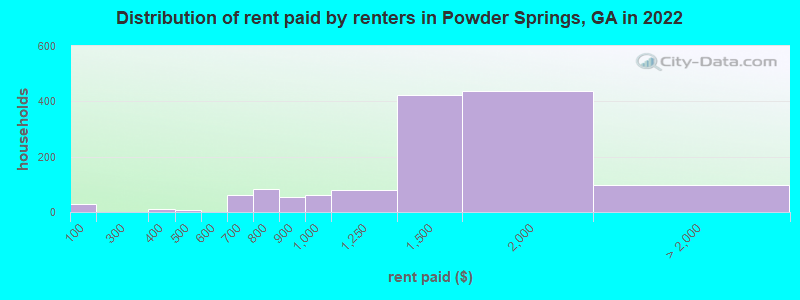
Rent paid by renters in 2022 in Powder Springs, GA
-
- 28Less than $100
- 12$300 to $349
- 8$450 to $499
- 33$600 to $649
- 25$650 to $699
- 83$700 to $749
- 56$800 to $899
- 62$900 to $999
- 77$1,000 to $1,249
- 422$1,250 to $1,499
- 437$1,500 to $1,999
- 64$2,000 to $2,499
- 7$3,000 to $3,499
- 26No cash rent
Percentage of workers working in this county: 61.9%
Number of people working at home: 1,749 (19.0% of all workers)
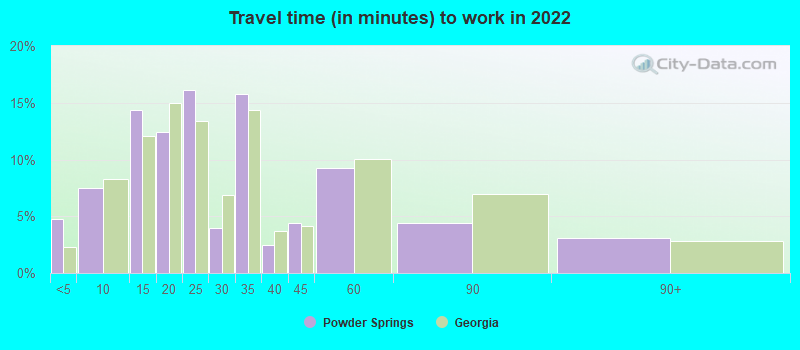
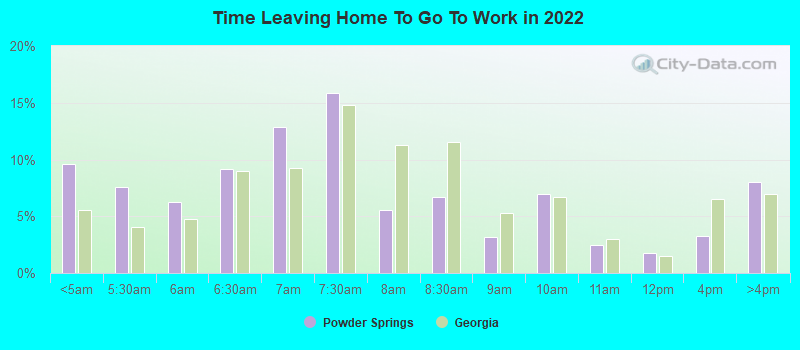
Travel time to work (commute)
- Less than 5 minutes: 118
- 5 to 9 minutes: 339
- 10 to 14 minutes: 388
- 15 to 19 minutes: 487
- 20 to 24 minutes: 605
- 25 to 29 minutes: 556
- 30 to 34 minutes: 1,377
- 35 to 39 minutes: 429
- 40 to 44 minutes: 378
- 45 to 59 minutes: 1,291
- 60 to 89 minutes: 876
- 90 or more minutes: 319
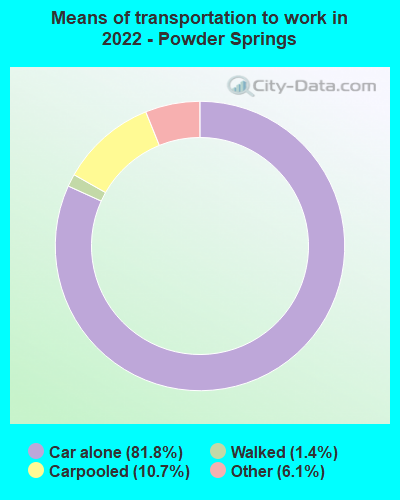
Means of transportation to work:
- Drove a car alone: 3,495 (57.7%)
- Carpooled: 545 (9.0%)
- Taxi: 317 (5.2%)
- Walked: 72 (1.2%)
- Worked at home: 1,749 (28.9%)
- Unemployment by race in 2022
- Unemployment rate for White non-Hispanic residents
- 7.9%Males
- 0.5%Females
- Unemployment rate for Black residents
- 5.0%Males
- 1.7%Females
- Unemployment rate for other race residents
- 2.0%Females
- Unemployment rate for two or more race residents
- 3.3%Females
- Unemployment rate for Hispanic or Latino residents
- 4.3%Females
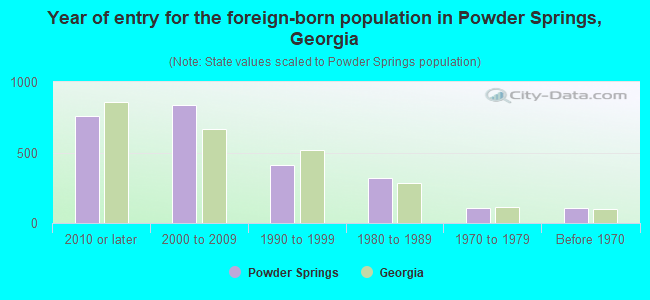
- Year of entry for the foreign-born population in Powder Springs, Georgia
- 7602010 or later
- 8342000 to 2009
- 4141990 to 1999
- 3201980 to 1989
- 1071970 to 1979
- 103Before 1970
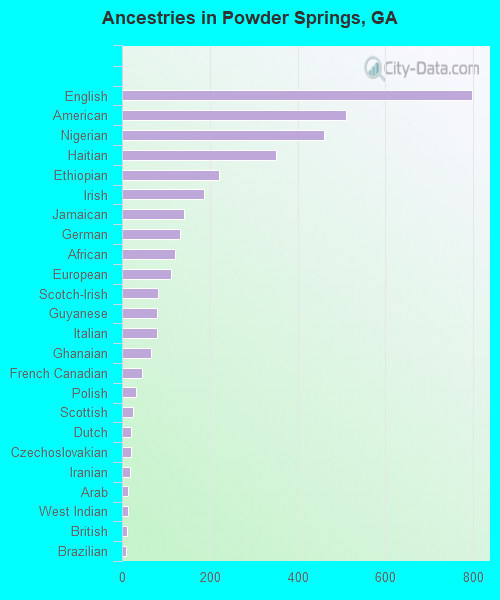
First ancestries reported:
- English: 796 (8.0%)
- American: 511 (5.1%)
- Nigerian: 459 (4.6%)
- Haitian: 350 (3.5%)
- Ethiopian: 222 (2.2%)
- Irish: 186 (1.9%)
- Jamaican: 142 (1.4%)
- German: 133 (1.3%)
- African: 121 (1.2%)
- European: 111 (1.1%)
- Scotch-Irish: 82 (0.8%)
- Guyanese: 80 (0.8%)
- Italian: 80 (0.8%)
- Ghanaian: 67 (0.7%)
- French Canadian: 46 (0.5%)
- Polish: 31 (0.3%)
- Scottish: 26 (0.3%)
- Dutch: 21 (0.2%)
- Czechoslovakian: 20 (0.2%)
- Iranian: 18 (0.2%)
- Arab: 14 (0.1%)
- West Indian: 13 (0.1%)
- British: 11 (0.1%)
- Brazilian: 10 (0.1%)
- French: 6 (0.06%)
- Slavic: 5 (0.05%)
Most common places of birth for foreign-born residents (%):
| Powder Springs: | 14.1% (319) |
| Georgia: | 20.0% (223,400) |
| Powder Springs: | 11.0% (250) |
| Georgia: | 3.6% (39,974) |
| Powder Springs: | 10.3% (234) |
| Georgia: | 2.5% (27,846) |
| Powder Springs: | 10.1% (229) |
| Georgia: | 1.6% (17,476) |
| Powder Springs: | 7.8% (177) |
| Georgia: | 2.5% (27,794) |
| Powder Springs: | 7.0% (158) |
| Georgia: | 1.6% (17,643) |
| Powder Springs: | 6.5% (147) |
| Georgia: | 0.8% (8,613) |
| Powder Springs: | 6.1% (139) |
| Georgia: | 4.6% (51,270) |
| Powder Springs: | 5.4% (123) |
| Georgia: | 1.7% (19,012) |
| Powder Springs: | 4.5% (101) |
| Georgia: | 1.6% (17,851) |
| Powder Springs: | 4.4% (99) |
| Georgia: | 1.1% (11,847) |
| Powder Springs: | 3.0% (67) |
| Georgia: | 0.9% (10,397) |
| Powder Springs: | 2.9% (65) |
| Georgia: | 1.7% (18,651) |
| Powder Springs: | 2.7% (62) |
| Georgia: | 1.0% (11,747) |
| Powder Springs: | 2.3% (53) |
| Georgia: | 2.1% (23,813) |
| Powder Springs: | 1.8% (40) |
| Georgia: | 0.8% (9,101) |
Place of birth for U.S.-born residents:
- This state: 6,574
- Other state: 7,954
- Northeast: 2,140
- Midwest: 1,617
- South: 3,628
- West: 523
90.1% of Powder Springs residents lived in the same house 1 years ago.
Out of people who lived in different houses, 29.2% lived in this county.
Out of people who lived in different counties, 40.0% lived in Georgia.
| Powder Springs: | 90.1% |
| State average: | 86.6% |
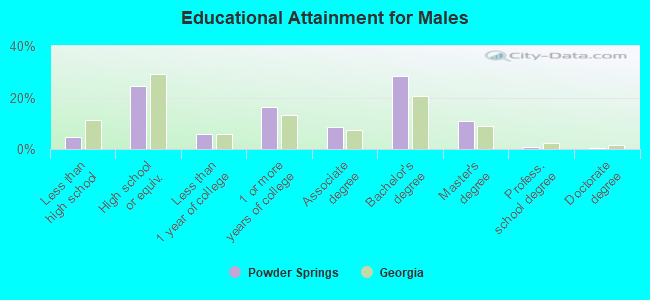
Education attainment for males 25 years and older:
- No schooling: 23
- Nursery to 4th grade: 0
- 5th and 6th grade: 0
- 7th and 8th grade: 29
- 9th grade: 7
- 10th grade: 22
- 11th grade: 34
- 12th grade, no diploma: 108
- High school graduate (or equivalency): 1,213
- Less than 1 year of college: 291
- Some college more than 1 year, no degree: 809
- Associate degree: 425
- Bachelor's degree: 1,421
- Master's degree: 552
- Professional school degree: 32
- Doctorate degree: 24
Education attainment for females 25 years and older:
- No schooling: 135
- Nursery to 4th grade: 12
- 5th and 6th grade: 57
- 7th and 8th grade: 29
- 9th grade: 43
- 10th grade: 14
- 11th grade: 92
- 12th grade, no diploma: 45
- High school graduate (or equivalency): 1,507
- Less than 1 year of college: 309
- Some college more than 1 year, no degree: 917
- Associate degree: 506
- Bachelor's degree: 1,752
- Master's degree: 810
- Professional school degree: 165
- Doctorate degree: 42


Housing units in structures:
- One, detached: 5,758
- One, attached: 356
- Two: 20
- 3 or 4: 59
- 5 to 9: 24
- 20 to 49: 24
- 50 or more: 52
- Mobile homes: 11
Housing units lacking complete kitchen facilities in 2022: 1.5%
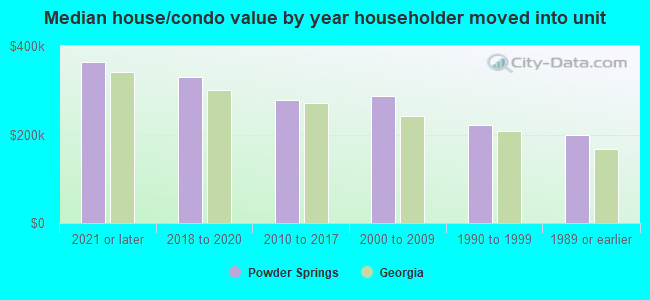
House/condo owner moved in on average 12 years ago
Renter moved in on average 5 years ago
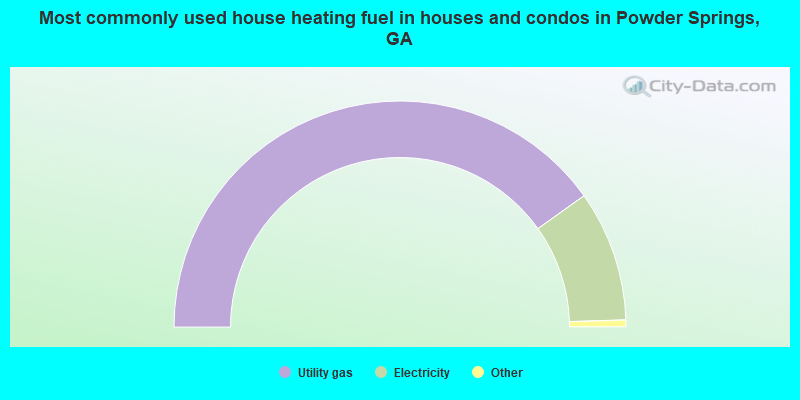
- 80.3%Utility gas
- 18.7%Electricity
- 0.5%Bottled, tank, or LP gas
- 0.3%Other fuel
- 0.2%No fuel used
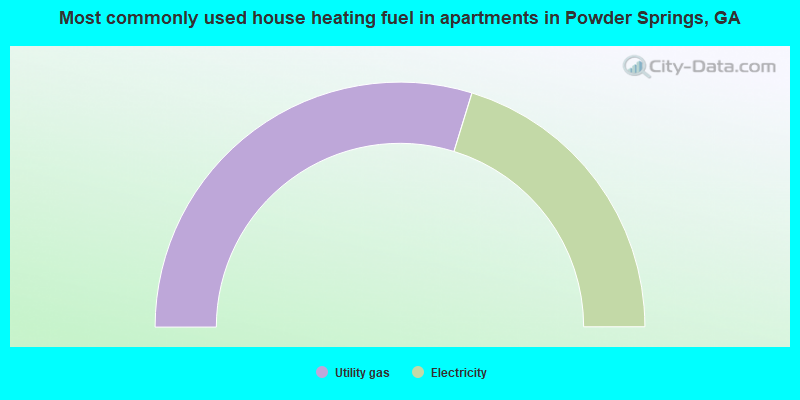
- 59.5%Utility gas
- 40.5%Electricity
Private vs. public school enrollment:
| Here: | 7.3% |
| Georgia: | 12.1% |
| Here: | 3.1% |
| Georgia: | 10.8% |
| Here: | 7.7% |
| Georgia: | 17.1% |