Powell Valley, TN (Tennessee) Houses and Residents
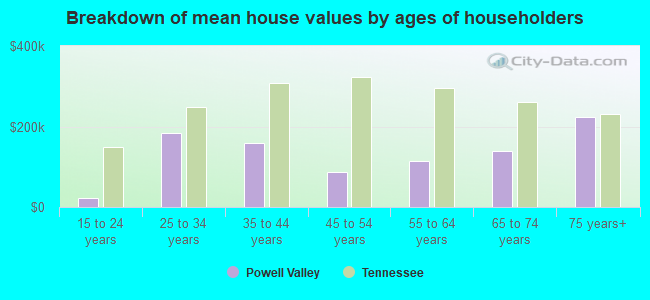
| Powell Valley: | $183,231 |
| Tennessee: | $284,800 |
Total population: 6,811 (Urban population: 360 (all inside urban clusters), Rural population: 6,255 (165 farm, 6,090 nonfarm))
Houses: 2,796 (2,481 occupied: 2,053 owner occupied, 428 renter occupied)
| % of renters here: | 17% |
| State: | 33% |
Housing density: 32 houses/condos per square mile
Median price asked for vacant for-sale houses and condos in 2022 in this county: $141,299.
Median contract rent in 2022: $580 (lower quartile is $406, upper quartile is $701)
Median rent asked for vacant for-rent units in 2022: $505
Median gross rent in Powell Valley, TN in 2022: $760
Housing units in Powell Valley with a mortgage: 569 (27 second mortgage, 18 home equity loan, 0 both second mortgage and home equity loan)
Houses without a mortgage: 647


Household type by relationship:
Households: 30,956- In family households: 26,468 (6,518 male householders, 2,445 female householders)
6,857 spouses, 8,219 children (7,452 natural, 204 adopted, 563 stepchildren), 985 grandchildren, 209 brothers or sisters, 210 parents, foster children, 296 other relatives, 555 non-relatives
- In nonfamily households: 4,488 (1,812 male householders (1,532 living alone)), 2,078 female householders (1,860 living alone)), 598 nonrelatives
- In group quarters: 1,257 (476 institutionalized population)
4,916 married couples with children.
1,402 single-parent households (322 men, 1,080 women).
97.0% of residents of Powell Valley speak English at home.
0.8% of residents speak Spanish at home (71% speak English very well, 29% speak English not well).
0.4% of residents speak other Indo-European language at home (56% speak English very well, 20% speak English well, 24% speak English not well).
1.2% of residents speak Asian or Pacific Island language at home (33% speak English very well, 67% speak English not well).
0.6% of residents speak other language at home (85% speak English very well, 15% speak English well).
Foreign born population: 306 (4.0%)
(38.2% of them are naturalized citizens)
| Here: | 6.3 |
| State: | 6.5 |
| Here: | 4.9 |
| State: | 4.4 |
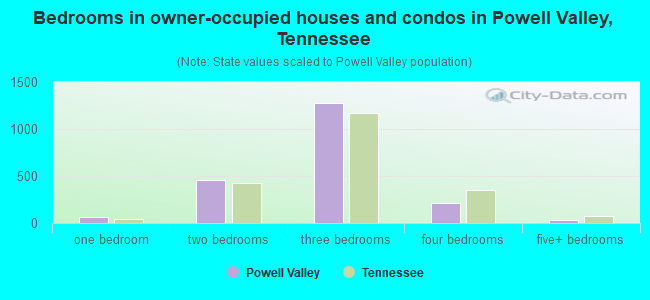
- Bedrooms in owner-occupied houses and condos in Powell Valley, Tennessee
- 0no bedroom
- 671 bedroom
- 4612 bedrooms
- 1,2753 bedrooms
- 2154 bedrooms
- 355+ bedrooms
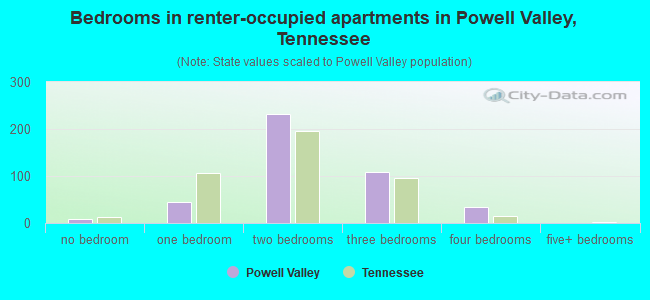
- Bedrooms in renter-occupied apartments in Powell Valley, Tennessee
- 8no bedroom
- 451 bedroom
- 2322 bedrooms
- 1083 bedrooms
- 354 bedrooms
- 05+ bedrooms
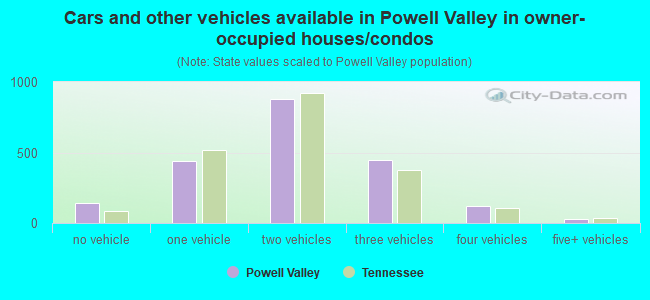
- Cars and other vehicles available in Powell Valley in owner-occupied houses/condos
- 145no vehicle
- 4371 vehicle
- 8762 vehicles
- 4463 vehicles
- 1194 vehicles
- 305+ vehicles
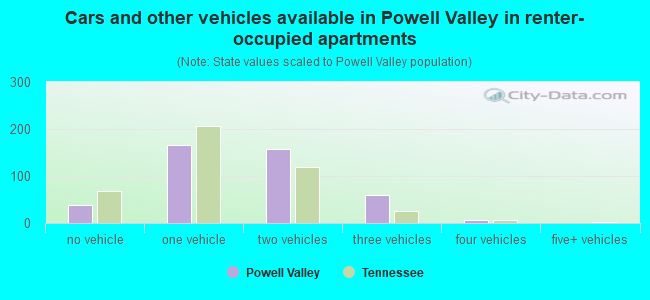
- Cars and other vehicles available in Powell Valley in renter-occupied apartments
- 38no vehicle
- 1661 vehicle
- 1582 vehicles
- 593 vehicles
- 74 vehicles
- 05+ vehicles
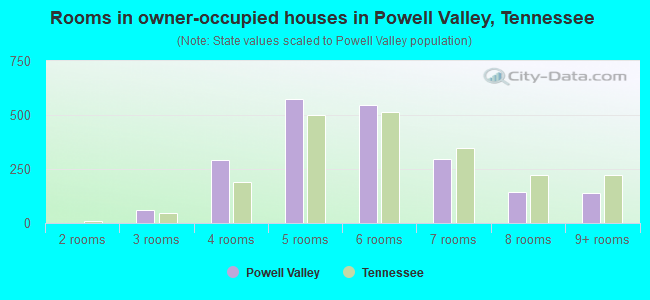
- Rooms in owner-occupied houses in Powell Valley, Tennessee
- 01 room
- 02 rooms
- 603 rooms
- 2914 rooms
- 5765 rooms
- 5476 rooms
- 2967 rooms
- 1448 rooms
- 1399+ rooms
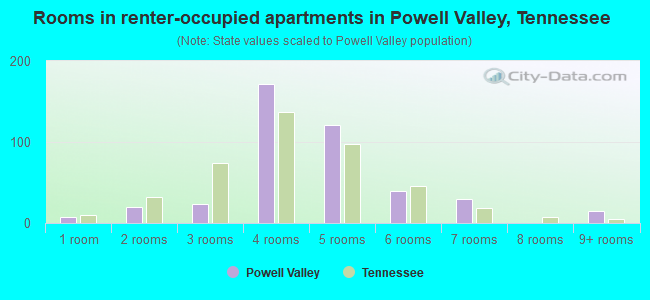
- Rooms in renter-occupied apartments in Powell Valley, Tennessee
- 81 room
- 202 rooms
- 243 rooms
- 1714 rooms
- 1215 rooms
- 396 rooms
- 307 rooms
- 08 rooms
- 159+ rooms
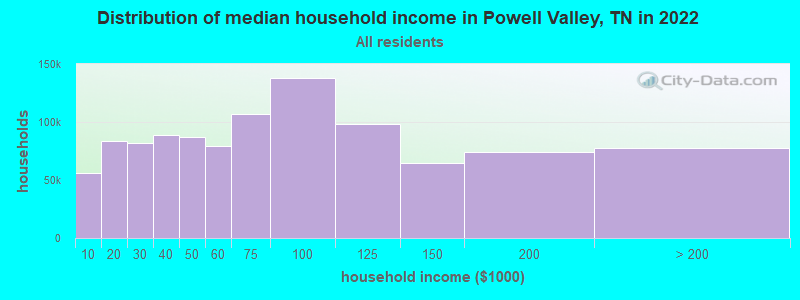
Powell Valley, TN household income distribution

- 37,858Less than $10,000
- 63,186$10,000 to $19,999
- 60,006$20,000 to $29,999
- 61,498$30,000 to $39,999
- 59,489$40,000 to $49,999
- 55,034$50,000 to $59,999
- 74,996$60,000 to $74,999
- 95,615$75,000 to $99,999
- 71,378$100,000 to $124,999
- 42,697$125,000 to $149,999
- 46,948$150,000 to $199,999
- 40,103$200,000 or more
Percentage of workers working in this county: 42.4%
Number of people working at home: 259 (9.9% of all workers)
Travel time to work (commute)
- Less than 5 minutes: 64
- 5 to 9 minutes: 162
- 10 to 14 minutes: 240
- 15 to 19 minutes: 285
- 20 to 24 minutes: 249
- 25 to 29 minutes: 132
- 30 to 34 minutes: 458
- 35 to 39 minutes: 98
- 40 to 44 minutes: 22
- 45 to 59 minutes: 155
- 60 to 89 minutes: 263
- 90 or more minutes: 163
Means of transportation to work:
- Drove a car alone: 1,838 (78.9%)
- Carpooled: 400 (17.2%)
- Bus or trolley bus: 6 (0.3%)
- Walked: 30 (1.3%)
- Other means: 17 (0.7%)
- Worked at home: 38 (1.6%)
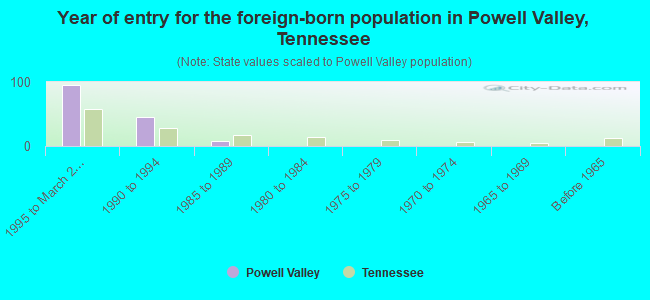
- Year of entry for the foreign-born population in Powell Valley, Tennessee
- 951995 to March 2000
- 461990 to 1994
- 81985 to 1989
- 01980 to 1984
- 01975 to 1979
- 01970 to 1974
- 01965 to 1969
- 0Before 1965
Most common places of birth for foreign-born residents (%):
| Powell Valley: | 50.3% (75) |
| Tennessee: | 2.3% (3,660) |
| Powell Valley: | 30.9% (46) |
| Tennessee: | 3.6% (5,726) |
| Powell Valley: | 8.1% (12) |
| Tennessee: | 3.8% (6,106) |
| Powell Valley: | 5.4% (8) |
| Tennessee: | 0.3% (402) |
| Powell Valley: | 5.4% (8) |
| Tennessee: | 4.4% (6,981) |
Place of birth for U.S.-born residents:
- This state: 2,912
- Other state: 3,541
- Northeast: 74
- Midwest: 668
- South: 2,748
- West: 51
65% of Powell Valley residents lived in the same house 5 years ago.
Out of people who lived in different houses, 54% lived in this county.
Out of people who lived in different counties, 27% lived in Tennessee.
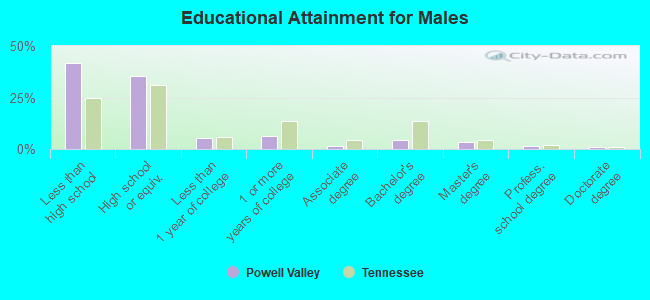
Education attainment for males 25 years and older:
- No schooling: 34
- Nursery to 4th grade: 87
- 5th and 6th grade: 102
- 7th and 8th grade: 187
- 9th grade: 163
- 10th grade: 101
- 11th grade: 121
- 12th grade, no diploma: 106
- High school graduate (or equivalency): 759
- Less than 1 year of college: 114
- Some college more than 1 year, no degree: 131
- Associate degree: 29
- Bachelor's degree: 97
- Master's degree: 69
- Professional school degree: 33
- Doctorate degree: 16
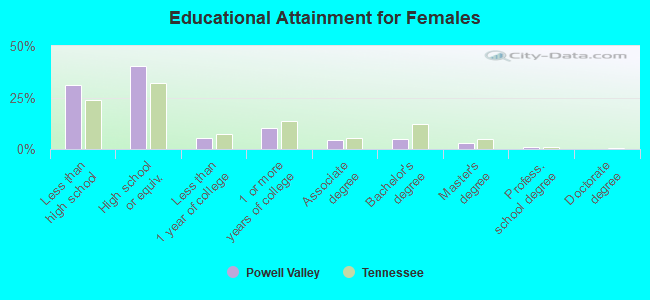
Education attainment for females 25 years and older:
- No schooling: 32
- Nursery to 4th grade: 62
- 5th and 6th grade: 72
- 7th and 8th grade: 209
- 9th grade: 64
- 10th grade: 123
- 11th grade: 69
- 12th grade, no diploma: 68
- High school graduate (or equivalency): 907
- Less than 1 year of college: 122
- Some college more than 1 year, no degree: 232
- Associate degree: 100
- Bachelor's degree: 110
- Master's degree: 69
- Professional school degree: 17
- Doctorate degree: 0


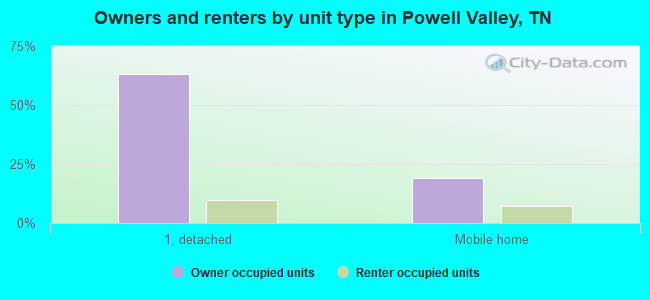
Housing units in structures:
- One, detached: 1,960
- One, attached: 12
- Two: 8
- 3 or 4: 5
- 5 to 9: 8
- Mobile homes: 803
Median worth of mobile homes: $62,984
Housing units lacking complete kitchen facilities: 4.1%
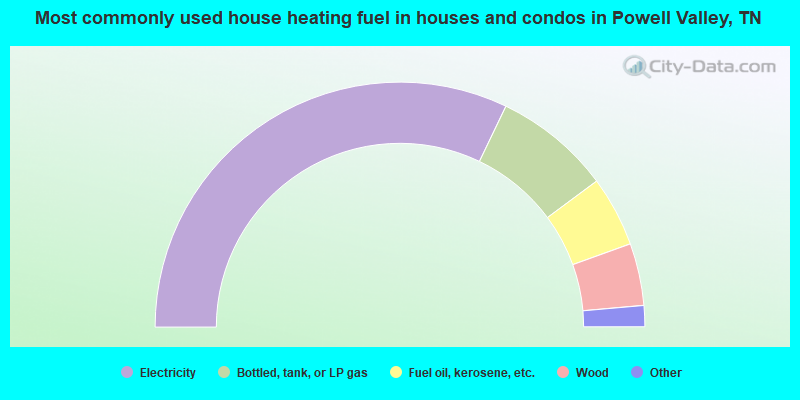
- 64.2%Electricity
- 15.4%Bottled, tank, or LP gas
- 9.3%Fuel oil, kerosene, etc.
- 8.2%Wood
- 2.2%Coal or coke
- 0.3%Utility gas
- 0.2%No fuel used
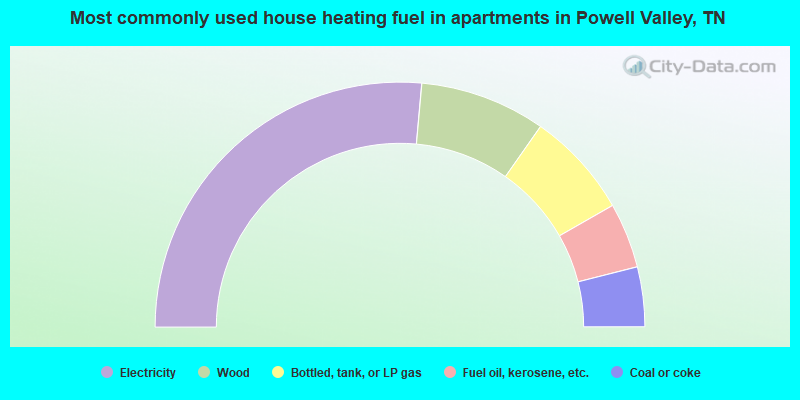
- 52.8%Electricity
- 16.6%Wood
- 14.0%Bottled, tank, or LP gas
- 8.6%Fuel oil, kerosene, etc.
- 7.9%Coal or coke
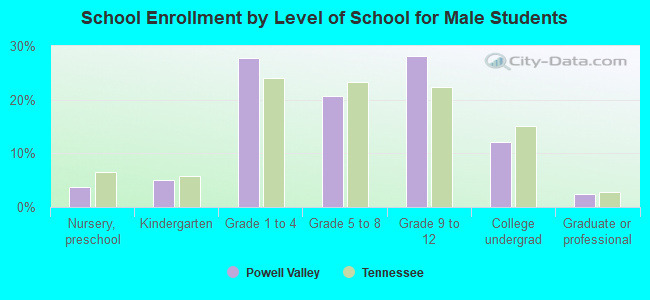
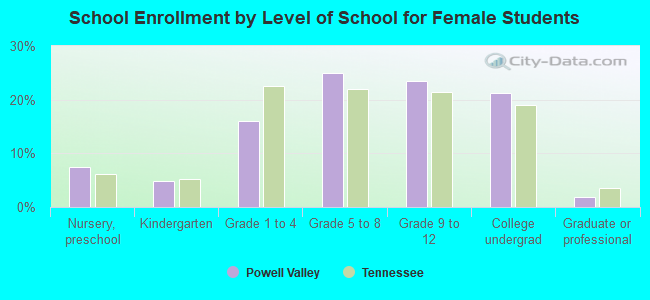
Private vs. public school enrollment:
| Here: | 5.7% |
| Tennessee: | 9.5% |
| Here: | 18.7% |
| Tennessee: | 10.4% |
| Here: | 53.9% |
| Tennessee: | 22.8% |