Queen City, TX (Texas) Houses and Residents
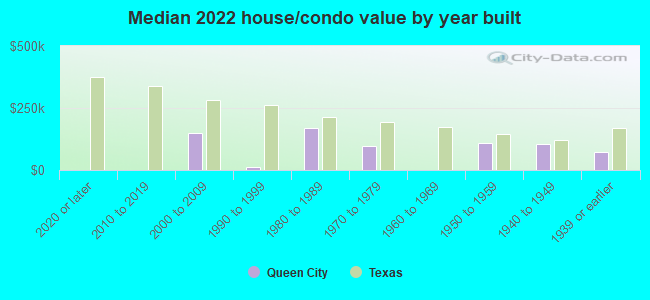
| Queen City: | $111,780 |
| Texas: | $275,400 |
Total population: 1,471 (Urban population: 1,130 (all inside urban clusters), Rural population: 487 (all nonfarm))
Houses: 702 (582 occupied: 348 owner occupied, 242 renter occupied)
| % of renters here: | 41% |
| State: | 38% |
Housing density: 196 houses/condos per square mile
Median price asked for vacant for-sale houses and condos in 2022 in this county: $107,687.
Median contract rent in 2022: $578 (lower quartile is $465, upper quartile is $815)
Median rent asked for vacant for-rent units in 2022: $602
Median gross rent in Queen City, TX in 2022: $767
Housing units in Queen City with a mortgage: 123 (5 second mortgage, 0 home equity loan, 6 both second mortgage and home equity loan)
Houses without a mortgage: 0
Median household income for houses/condos with a mortgage: $84,283
Median household income for apartments without a mortgage: $33,896
Median monthly housing costs: $678
Compare current foreclosures near Queen City, TX:
| Photo | Address | Area | Beds / Baths | Price | Details |
|---|---|---|---|---|---|

|
#1
Co Rd 3784
Queen City, TX 75572
|
884 sq. feet
|
1 baths 2 beds |
show details | |

|
#2
Fm 2327
Queen City, TX 75572
|
- sq. feet
|
- baths - beds |
show details | |

|
#3
County Road 3656
Queen City, TX 75572
|
- sq. feet
|
- baths - beds |
show details | |

|
#4
Fm 2327
Queen City, TX 75572
|
- sq. feet
|
- baths - beds |
show details | |

|
#5
Mc 28
Texarkana, AR 71854
|
2,432 sq. feet
|
3 baths 3 beds |
$255,800
|
show details |

|
#6
Robinson
Rodessa, LA 71069
|
- sq. feet
|
- baths - beds |
$5,875
|
show details |

|
#7
Hosston Rd
Rodessa, LA 71069
|
- sq. feet
|
- baths - beds |
$5,875
|
show details |

|
#8
Journey St
Rodessa, LA 71069
|
- sq. feet
|
- baths - beds |
$5,800
|
show details |

|
#9
Bois D Arc St
Rodessa, LA 71069
|
- sq. feet
|
- baths - beds |
$5,875
|
show details |

|
#10
Fm 251
Mc Leod, TX 75565
|
1,534 sq. feet
|
2 baths 3 beds |
show details |
| Photo | Address | Area | Beds / Baths | Price | Details |
|---|---|---|---|---|---|

|
#11
Spearman
Rodessa, LA 71069
|
- sq. feet
|
- baths - beds |
$5,800
|
show details |

|
#12
Tyson Rd
Rodessa, LA 71069
|
- sq. feet
|
- baths - beds |
$5,875
|
show details |

|
#13
Church Rd
Rodessa, LA 71069
|
- sq. feet
|
- baths - beds |
$5,800
|
show details |

|
#14
Shelia St
Atlanta, TX 75551
|
1,450 sq. feet
|
2 baths 3 beds |
show details | |

|
#15
Front
Rodessa, LA 71069
|
- sq. feet
|
- baths - beds |
$5,875
|
show details |

|
#16
N Lake Davis Dr
Texarkana, AR 71854
|
2,140 sq. feet
|
2 baths - beds |
show details | |

|
#17
Woodland Lake Dr
Atlanta, TX 75551
|
2,419 sq. feet
|
- baths - beds |
show details | |

|
#18
Cherokee Trl
Texarkana, TX 75501
|
1,260 sq. feet
|
- baths - beds |
show details | |

|
#19
Blackman Ferry Rd
Texarkana, AR 71854
|
2,000 sq. feet
|
2 baths - beds |
show details | |

|
#20
Stipp Ln
Texarkana, TX 75501
|
3,010 sq. feet
|
- baths - beds |
show details |
| Photo | Address | Area | Beds / Baths | Price | Details |
|---|---|---|---|---|---|

|
#21
Fm 251 S
Bivins, TX 75555
|
1,648 sq. feet
|
- baths - beds |
show details | |

|
#22
Lakeshore Dr
Texarkana, TX 75501
|
- sq. feet
|
- baths - beds |
show details | |

|
#23
Redwater Blvd E
Texarkana, TX 75501
|
- sq. feet
|
- baths - beds |
show details | |

|
#24
County Road 1204
Maud, TX 75567
|
- sq. feet
|
- baths - beds |
show details | |

|
#25
S Kings Hwy
Texarkana, TX 75501
|
- sq. feet
|
- baths - beds |
show details | |

|
#26
Miller County 20
Texarkana, AR 71854
|
- sq. feet
|
- baths - beds |
show details | |

|
#27
Cummings Ln
Texarkana, TX 75501
|
- sq. feet
|
- baths - beds |
show details | |

|
#28
Tony Ln
Texarkana, TX 75501
|
- sq. feet
|
- baths - beds |
show details | |

|
#29
Eylau Loop Rd
Texarkana, TX 75501
|
872 sq. feet
|
- baths - beds |
show details | |

|
#30
Clara Ln
Texarkana, TX 75501
|
- sq. feet
|
- baths - beds |
show details |
| Photo | Address | Area | Beds / Baths | Price | Details |
|---|---|---|---|---|---|

|
#31
Parkway Dr
Texarkana, TX 75501
|
- sq. feet
|
- baths - beds |
show details | |

|
#32
Iris Ln
Texarkana, TX 75501
|
1,269 sq. feet
|
- baths - beds |
show details | |

|
#33
N Elmwood Dr
Texarkana, TX 75501
|
- sq. feet
|
- baths - beds |
show details | |

|
#34
Alpine Dr
Texarkana, TX 75501
|
2,222 sq. feet
|
- baths - beds |
show details | |

|
#35
Mimosa Ln
Atlanta, TX 75551
|
1,080 sq. feet
|
- baths - beds |
show details | |

|
#36
Timber Ridge Dr
Atlanta, TX 75551
|
1,582 sq. feet
|
- baths - beds |
show details | |

|
#37
Massie St
Atlanta, TX 75551
|
1,404 sq. feet
|
- baths - beds |
show details | |

|
#38
Fm 2328
Atlanta, TX 75551
|
- sq. feet
|
- baths - beds |
show details | |

|
#39
Fm 1154
Atlanta, TX 75551
|
648 sq. feet
|
- baths - beds |
show details | |

|
#40
E Taylor St
Atlanta, TX 75551
|
- sq. feet
|
- baths - beds |
show details |
| Photo | Address | Area | Beds / Baths | Price | Details |
|---|---|---|---|---|---|

|
#41
Chuck St
Atlanta, TX 75551
|
- sq. feet
|
- baths - beds |
show details | |

|
#42
W Main St # 95
Atlanta, TX 75551
|
15,204 sq. feet
|
- baths - beds |
show details | |

|
#43
Choctaw Dr
Atlanta, TX 75551
|
2,592 sq. feet
|
- baths - beds |
show details | |

|
#44
Chickasaw Cir
Atlanta, TX 75551
|
2,436 sq. feet
|
- baths - beds |
show details | |

|
#45
Private Road 190
Atlanta, TX 75551
|
- sq. feet
|
- baths - beds |
show details | |

|
#46
County Road 4673
Atlanta, TX 75551
|
- sq. feet
|
- baths - beds |
show details | |

|
#47
County Road 4228
Atlanta, TX 75551
|
- sq. feet
|
- baths - beds |
show details | |

|
#48
Miller County 3
Doddridge, AR 71834
|
- sq. feet
|
- baths - beds |
show details | |

|
#49
North St
Douglassville, TX 75560
|
990 sq. feet
|
- baths - beds |
show details | |

|
Check over 1 million property listings on Foreclosure.com!
|
browse all offers | |||


 | Beazer homes in Telfair (15 replies) |
| How does Fort Worth differ from Dallas? (189 replies) |
| AA family moving form NC to Texas (25 replies) |
| Houston ranks #5 in best cities to live...by Forbes (13 replies) |
Median year apartment built: 1983
Household type by relationship:
Households: 1,341- Male householders: 225 (83 living alone), Female householders: 348 (107 living alone)
214 spouses (214 opposite-sex spouses), 33 unmarried partners, (33 opposite-sex unmarried partners), 334 children (324 natural, 2 adopted, 8 stepchildren), 112 grandchildren, 4 brothers or sisters, 7 parents, 0 foster children, 0 other relatives, 57 non-relatives
- In group quarters: 2
Size of family households: 177 2-persons, 71 3-persons, 67 4-persons, 26 5-persons, 4 6-persons, 7 7-or-more-persons.
Size of nonfamily households: 201 1-person, 30 2-persons, 7 3-persons.
132 married couples with children.
64 single-parent households (0 men, 64 women).
98.7% of residents of Queen City speak English at home.
1.4% of residents speak other language at home (100% speak English very well).
Foreign born population: 18 (1.3%)
(105.6% of them are naturalized citizens)
| Here: | 5.8 |
| State: | 6.3 |
| Here: | 4.8 |
| State: | 4.0 |
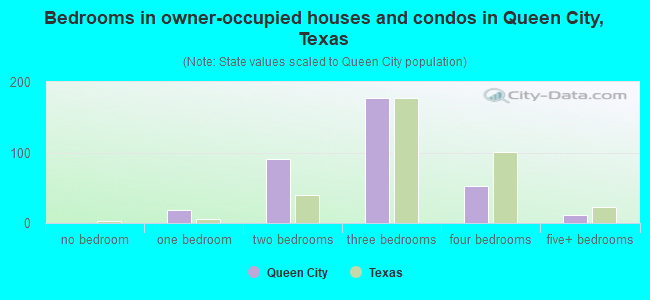
- Bedrooms in owner-occupied houses and condos in Queen City, Texas
- 0no bedroom
- 181 bedroom
- 912 bedrooms
- 1773 bedrooms
- 524 bedrooms
- 125+ bedrooms
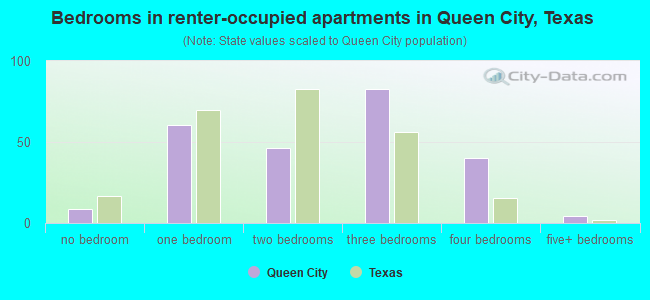
- Bedrooms in renter-occupied apartments in Queen City, Texas
- 8no bedroom
- 601 bedroom
- 472 bedrooms
- 823 bedrooms
- 404 bedrooms
- 45+ bedrooms
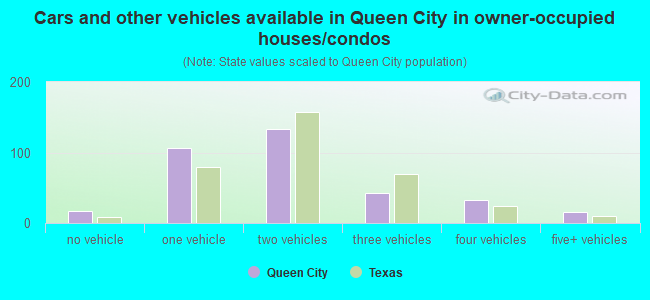
- Cars and other vehicles available in Queen City in owner-occupied houses/condos
- 17no vehicle
- 1071 vehicle
- 1342 vehicles
- 433 vehicles
- 334 vehicles
- 155+ vehicles
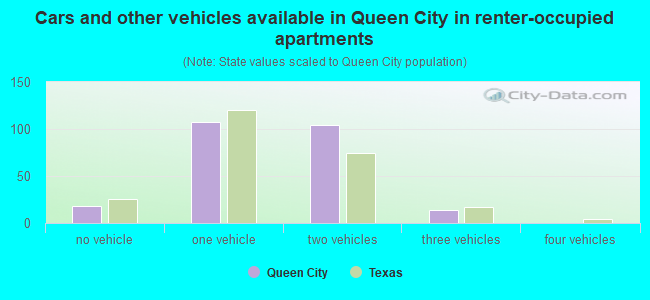
- Cars and other vehicles available in Queen City in renter-occupied apartments
- 18no vehicle
- 1071 vehicle
- 1042 vehicles
- 143 vehicles
- 04 vehicles
- 05+ vehicles
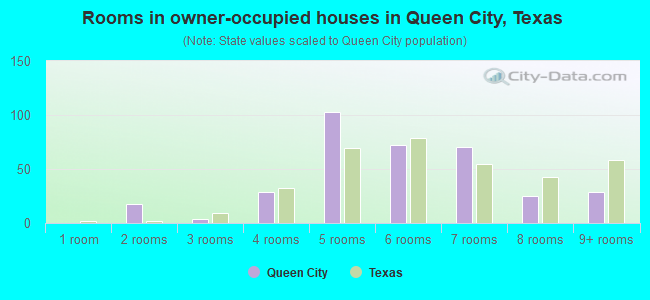
- Rooms in owner-occupied houses in Queen City, Texas
- 01 room
- 182 rooms
- 43 rooms
- 294 rooms
- 1035 rooms
- 726 rooms
- 707 rooms
- 258 rooms
- 299+ rooms
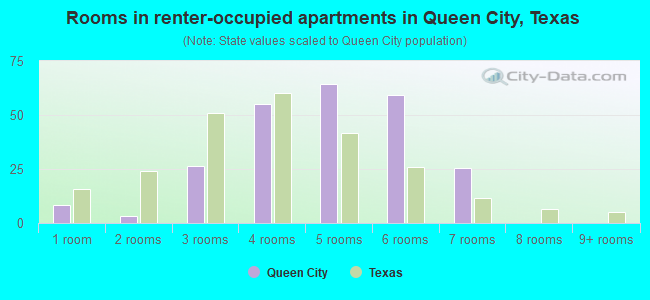
- Rooms in renter-occupied apartments in Queen City, Texas
- 81 room
- 32 rooms
- 263 rooms
- 554 rooms
- 645 rooms
- 596 rooms
- 257 rooms
- 08 rooms
- 09+ rooms
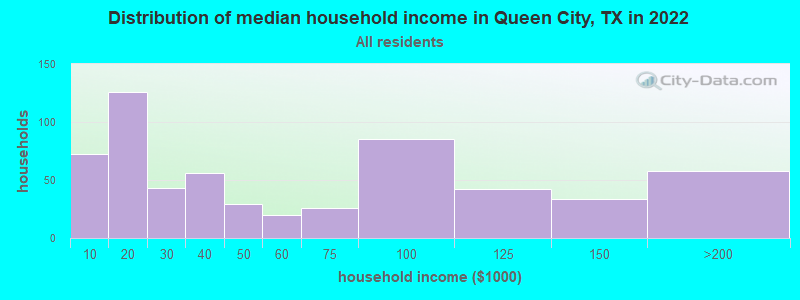
Queen City, TX household income distribution

- 72Less than $10,000
- 126$10,000 to $19,999
- 43$20,000 to $29,999
- 56$30,000 to $39,999
- 29$40,000 to $49,999
- 20$50,000 to $59,999
- 26$60,000 to $74,999
- 85$75,000 to $99,999
- 42$100,000 to $124,999
- 34$125,000 to $149,999
- 58$150,000 to $199,999
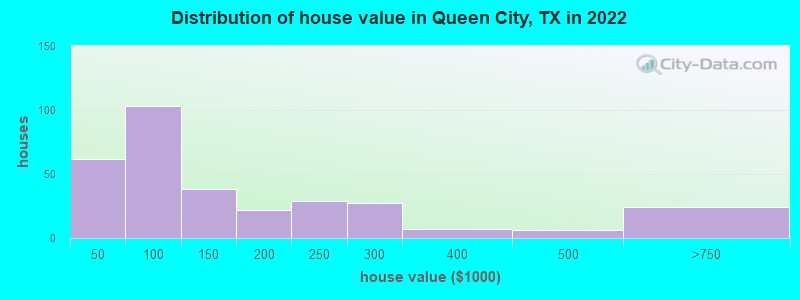
Home value of owner - occupied houses in 2022 in Queen City, TX
-
- 35Less than $10,000
- 9$10,000 to $14,999
- 10$30,000 to $34,999
- 2$35,000 to $39,999
- 2$40,000 to $49,999
- 17$50,000 to $59,999
- 12$60,000 to $69,999
- 42$70,000 to $79,999
- 7$80,000 to $89,999
- 19$90,000 to $99,999
- 27$100,000 to $124,999
- 10$125,000 to $149,999
- 18$150,000 to $174,999
- 2$175,000 to $199,999
- 28$200,000 to $249,999
- 27$250,000 to $299,999
- 7$300,000 to $399,999
- 5$400,000 to $499,999
- 24$500,000 to $749,999
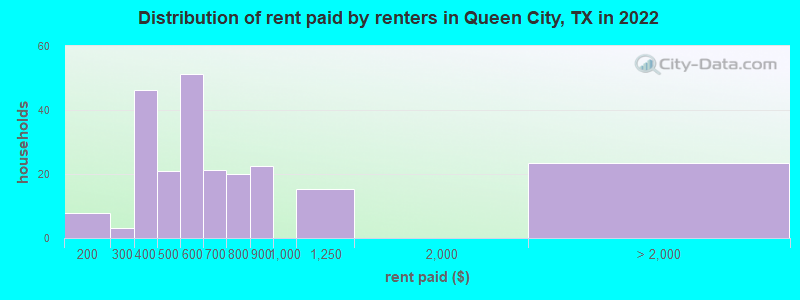
Rent paid by renters in 2022 in Queen City, TX
-
- 7$150 to $199
- 2$200 to $249
- 46$300 to $349
- 20$450 to $499
- 32$500 to $549
- 19$550 to $599
- 13$600 to $649
- 7$650 to $699
- 8$700 to $749
- 11$750 to $799
- 22$800 to $899
- 15$1,000 to $1,249
- 20$2,000 to $2,499
- 3No cash rent
Percentage of workers working in this county: 74.1%
Number of people working at home: 1 (0.2% of all workers)
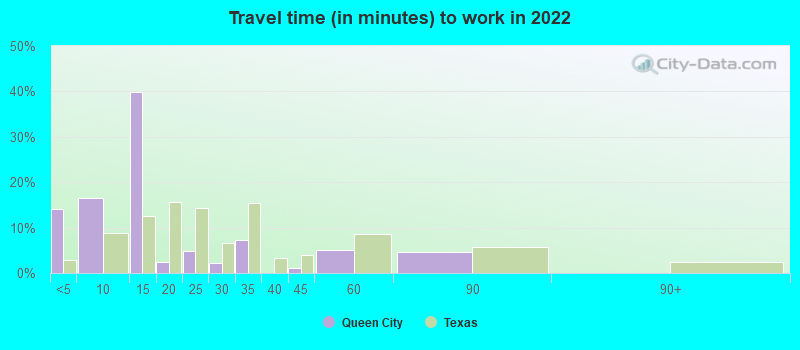
Travel time to work (commute)
- Less than 5 minutes: 3
- 5 to 9 minutes: 193
- 10 to 14 minutes: 146
- 15 to 19 minutes: 13
- 20 to 24 minutes: 50
- 25 to 29 minutes: 44
- 30 to 34 minutes: 79
- 35 to 39 minutes: 9
- 40 to 44 minutes: 17
- 45 to 59 minutes: 6
- 60 to 89 minutes: 7
- 90 or more minutes: 0
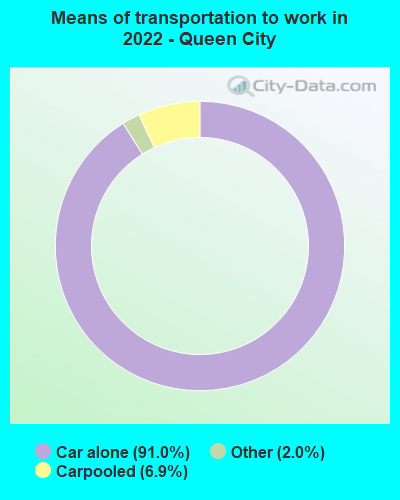
Means of transportation to work:
- Drove a car alone: 525 (83.6%)
- Carpooled: 41 (6.5%)
- Taxi: 14 (2.2%)
- Worked at home: 20 (3.2%)
- Unemployment by race in 2022
- Unemployment rate for White non-Hispanic residents
- 2.9%Females
- Unemployment rate for Black residents
- 12.2%Females
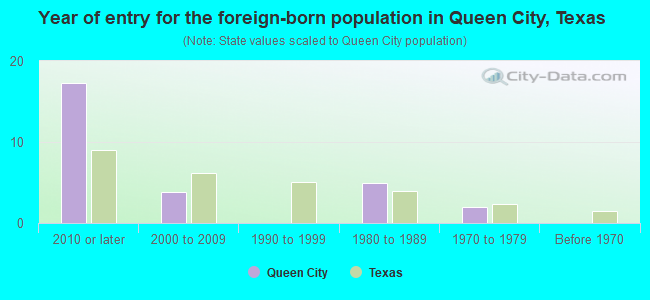
- Year of entry for the foreign-born population in Queen City, Texas
- 172010 or later
- 42000 to 2009
- 01990 to 1999
- 51980 to 1989
- 21970 to 1979
- 0Before 1970
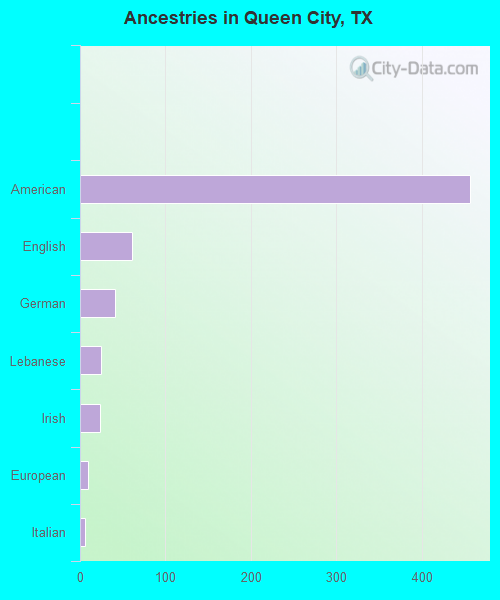
First ancestries reported:
- American: 456 (51.4%)
- English: 61 (6.9%)
- German: 41 (4.6%)
- Lebanese: 24 (2.7%)
- Irish: 23 (2.6%)
- European: 9 (1.0%)
- Italian: 6 (0.7%)
- Czech: 3 (0.3%)
- Scotch-Irish: 2 (0.2%)
Most common places of birth for foreign-born residents (%):
| Queen City: | 94.4% (17) |
| Texas: | 0.2% (9,332) |
Place of birth for U.S.-born residents:
- This state: 926
- Other state: 391
- Northeast: 1
- Midwest: 53
- South: 251
- West: 84
92.4% of Queen City residents lived in the same house 1 years ago.
Out of people who lived in different houses, 20.2% lived in this county.
Out of people who lived in different counties, 78.8% lived in Texas.
| Queen City: | 92.4% |
| State average: | 85.7% |
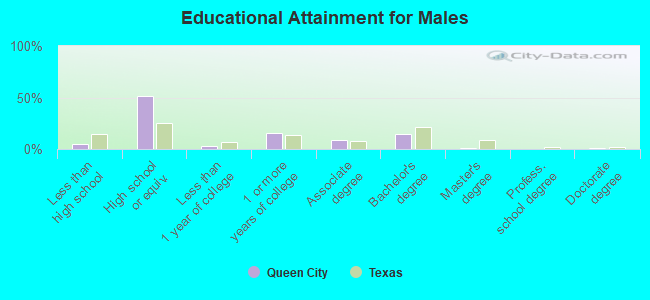
Education attainment for males 25 years and older:
- No schooling: 5
- Nursery to 4th grade: 0
- 5th and 6th grade: 0
- 7th and 8th grade: 4
- 9th grade: 1
- 10th grade: 0
- 11th grade: 10
- 12th grade, no diploma: 0
- High school graduate (or equivalency): 218
- Less than 1 year of college: 12
- Some college more than 1 year, no degree: 65
- Associate degree: 35
- Bachelor's degree: 63
- Master's degree: 3
- Professional school degree: 0
- Doctorate degree: 4
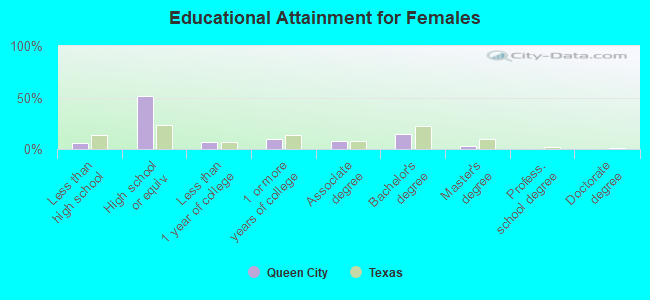
Education attainment for females 25 years and older:
- No schooling: 4
- Nursery to 4th grade: 0
- 5th and 6th grade: 0
- 7th and 8th grade: 0
- 9th grade: 2
- 10th grade: 9
- 11th grade: 10
- 12th grade, no diploma: 8
- High school graduate (or equivalency): 295
- Less than 1 year of college: 38
- Some college more than 1 year, no degree: 54
- Associate degree: 47
- Bachelor's degree: 85
- Master's degree: 18
- Professional school degree: 0
- Doctorate degree: 0
Housing units in structures:
- One, detached: 485
- One, attached: 5
- Two: 49
- 3 or 4: 35
- 5 to 9: 35
- 10 to 19: 13
- 20 to 49: 3
- Mobile homes: 65
- Boats, RVs, vans, etc.: 9
Median worth of mobile homes: $11,388
Housing units lacking complete kitchen facilities in 2022: 16.0%
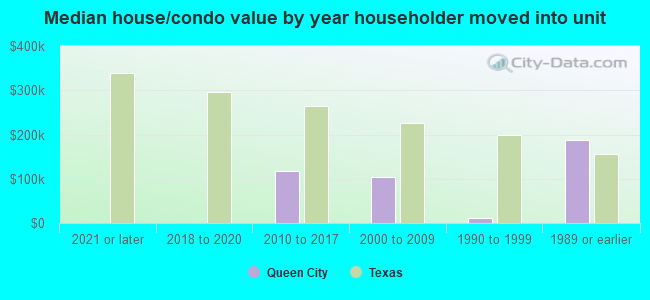
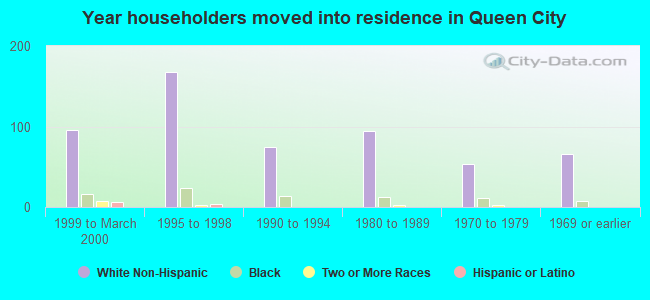
House/condo owner moved in on average 14 years ago
Renter moved in on average 5 years ago
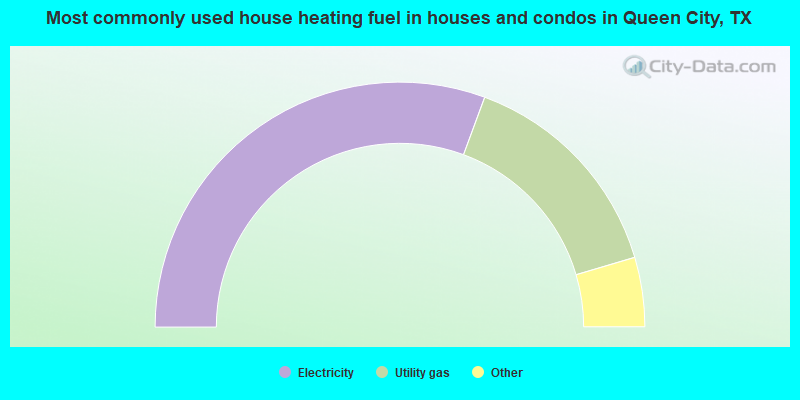
- 61.5%Electricity
- 29.7%Utility gas
- 3.9%No fuel used
- 3.6%Bottled, tank, or LP gas
- 1.2%Wood
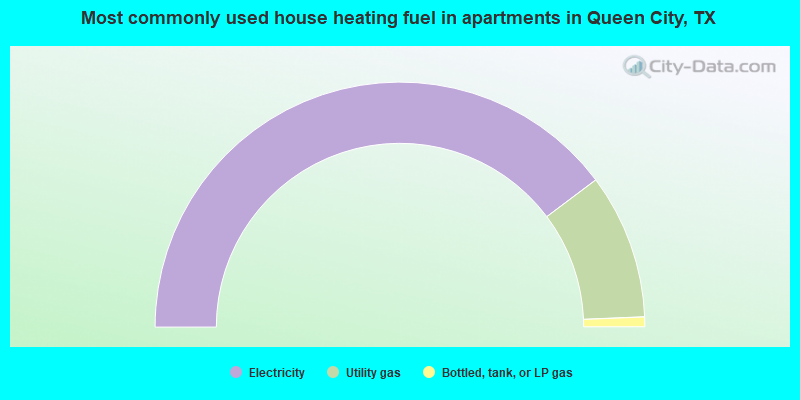
- 79.5%Electricity
- 19.2%Utility gas
- 1.3%Bottled, tank, or LP gas
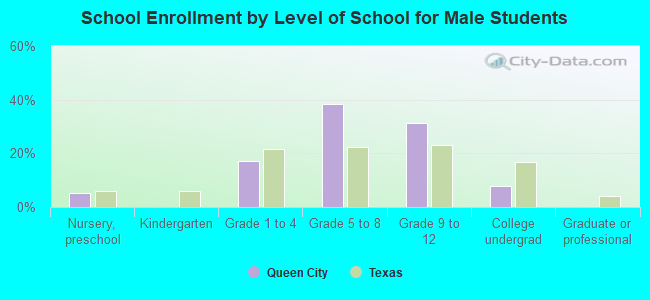
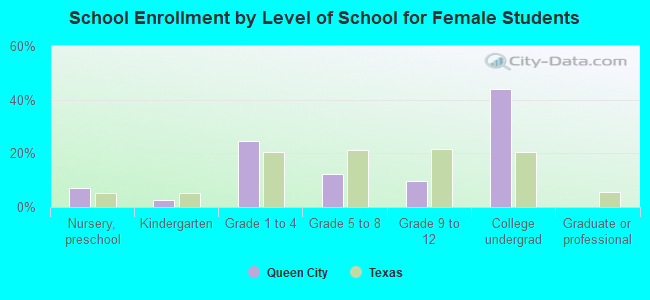
Private vs. public school enrollment:
| Here: | 0.0% |
| Texas: | 8.8% |
| Here: | 0.0% |
| Texas: | 8.0% |
| Here: | 79.0% |
| Texas: | 16.2% |