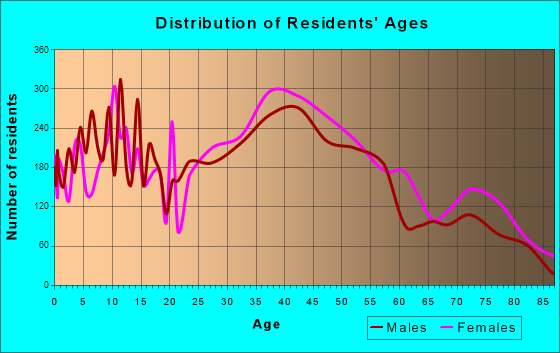
Randolph, MA (Massachusetts) Houses and Residents
| Randolph: | $459,175 |
| Massachusetts: | $534,700 |
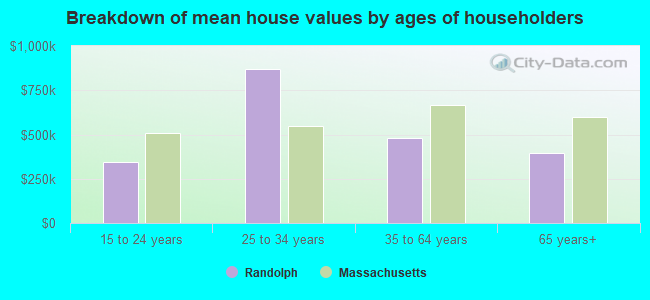
Mean price in 2022:
Detached houses: $462,066
Here: $462,066 State: $651,570 Townhouses or other attached units: $485,686
Here: $485,686 State: $617,749 In 2-unit structures: $509,628
Here: $509,628 State: $594,808 In 3-to-4-unit structures: $360,446
Here: $360,446 State: $601,912 In 5-or-more-unit structures: $848,449
Here: $848,449 State: $555,768
Total population: 32,112 (Urban population: 30,997, Rural population: 0)
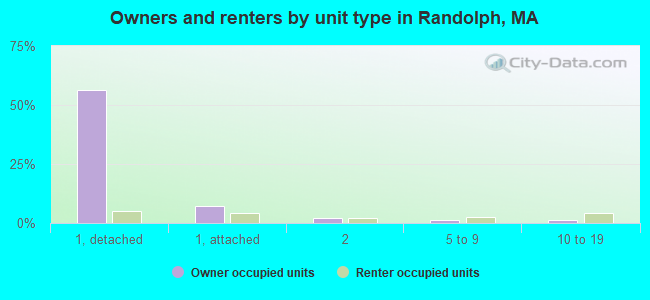
Houses: 13,409 (12,870 occupied: 8,977 owner occupied, 4,125 renter occupied)
| % of renters here: | 31% |
| State: | 38% |
Housing density: 1,332 houses/condos per square mile
Median price asked for vacant for-sale houses and condos in 2022: $1,194,805.
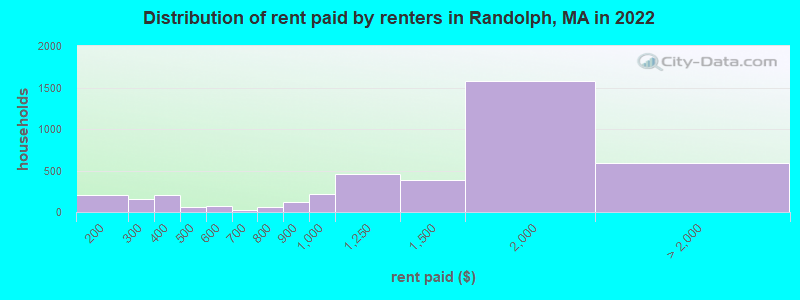
Median contract rent in 2022: $1,908 (lower quartile is $1,259, upper quartile is over $2,000)
Median rent asked for vacant for-rent units in 2022: $2,015
Median gross rent in Randolph, MA in 2022: $1,979
Housing units in Randolph with a mortgage: 6,094 (122 second mortgage, 478 home equity loan, 33 both second mortgage and home equity loan)
Houses without a mortgage: 2,292
Median household income for houses/condos with a mortgage: $122,337
Median household income for apartments without a mortgage: $89,356
Median monthly housing costs: $2,025
Compare current foreclosures in Randolph, MA:
| Photo | Address | Area | Beds / Baths | Price | Details |
|---|---|---|---|---|---|

|
#1
Cochato Park
Randolph, MA 02368
|
1,428 sq. feet
|
1 baths 3 beds |
show details | |

|
#2
Dorr St
Randolph, MA 02368
|
1,558 sq. feet
|
1 baths 3 beds |
show details | |

|
#3
Mill St
Randolph, MA 02368
|
1,916 sq. feet
|
1 baths 3 beds |
show details | |

|
#4
Barry St
Randolph, MA 02368
|
1,848 sq. feet
|
2 baths 3 beds |
show details | |

|
#5
Thornton St
Randolph, MA 02368
|
1,365 sq. feet
|
1 baths 4 beds |
show details | |

|
#6
Highland Ave
Randolph, MA 02368
|
1,404 sq. feet
|
1 baths 3 beds |
show details | |

|
#7
S Main St
Randolph, MA 02368
|
1,804 sq. feet
|
1 baths 4 beds |
show details | |

|
#8
Emily Jeffers Rd
Randolph, MA 02368
|
1,350 sq. feet
|
1 baths 3 beds |
show details | |

|
#9
S Main St
Randolph, MA 02368
|
3,773 sq. feet
|
2 baths 8 beds |
show details | |

|
#10
Kingcrest Ter
Randolph, MA 02368
|
720 sq. feet
|
1 baths 2 beds |
show details |
| Photo | Address | Area | Beds / Baths | Price | Details |
|---|---|---|---|---|---|

|
#11
Warren St
Randolph, MA 02368
|
872 sq. feet
|
1 baths 3 beds |
show details | |

|
#12
Lawson St
Randolph, MA 02368
|
2,630 sq. feet
|
3 baths 3 beds |
show details | |

|
#13
Old Farm Rd
Randolph, MA 02368
|
1,296 sq. feet
|
3 baths 3 beds |
show details | |

|
#14
S Main Street Aka 350 South Main Street
Randolph, MA Array
|
3,984 sq. feet
|
2 baths 8 beds |
show details | |

|
#15
Selwyn Rd
Randolph, MA 02368
|
1,728 sq. feet
|
2 baths 3 beds |
show details | |

|
#16
Eagle Rock Rd
Randolph, MA 02368
|
1,724 sq. feet
|
1 baths 4 beds |
show details | |

|
#17
Centre St
Randolph, MA 02368
|
1,071 sq. feet
|
1 baths 3 beds |
show details | |

|
#18
Charles St
Randolph, MA 02368
|
984 sq. feet
|
1 baths 2 beds |
show details | |

|
#19
Birch Dr
Randolph, MA 02368
|
4,013 sq. feet
|
3 baths 4 beds |
show details | |

|
#20
Wilmarth Rd
Randolph, MA 02368
|
1,236 sq. feet
|
1 baths 2 beds |
show details |
| Photo | Address | Area | Beds / Baths | Price | Details |
|---|---|---|---|---|---|

|
#21
Upham St
Randolph, MA 02368
|
1,438 sq. feet
|
1 baths 2 beds |
show details | |

|
#22
Bayberry Ln
Randolph, MA 02368
|
1,812 sq. feet
|
1 baths 4 beds |
show details | |

|
#23
West St
Randolph, MA 02368
|
1,476 sq. feet
|
1 baths 4 beds |
show details | |

|
#24
Morse St
Randolph, MA 02368
|
1,939 sq. feet
|
2 baths 3 beds |
show details | |

|
#25
Lafayette St
Randolph, MA 02368
|
1,936 sq. feet
|
1 baths 3 beds |
show details | |

|
#26
North St
Randolph, MA 02368
|
1,378 sq. feet
|
1 baths 3 beds |
show details | |

|
#27
Mill St
Randolph, MA 02368
|
820 sq. feet
|
1 baths 2 beds |
show details | |

|
#28
Pond Ln
Randolph, MA 02368
|
1,992 sq. feet
|
2 baths 3 beds |
show details | |

|
#29
Webster St
Randolph, MA 02368
|
1,481 sq. feet
|
2 baths 4 beds |
show details | |

|
#30
Lindberg Ave
Randolph, MA 02368
|
1,448 sq. feet
|
1 baths 3 beds |
show details |
| Photo | Address | Area | Beds / Baths | Price | Details |
|---|---|---|---|---|---|

|
#31
Highland Ave
Randolph, MA 02368
|
1,614 sq. feet
|
1 baths 3 beds |
show details | |

|
#32
Plain St
Randolph, MA 02368
|
1,643 sq. feet
|
1 baths 3 beds |
show details | |

|
#33
Vesey Rd
Randolph, MA 02368
|
1,532 sq. feet
|
1 baths 3 beds |
show details | |

|
#34
Chestnut St
Randolph, MA 02368
|
1,512 sq. feet
|
2 baths 3 beds |
show details | |

|
#35
Emily Jeffers Rd
Randolph, MA 02368
|
1,280 sq. feet
|
1 baths 3 beds |
show details | |

|
#36
Mill St
Randolph, MA 02368
|
- sq. feet
|
- baths - beds |
show details | |

|
#37
South St # 2
Randolph, MA 02368
|
- sq. feet
|
- baths - beds |
show details | |

|
#38
Hd Sandborn Way
Randolph, MA 02368
|
- sq. feet
|
- baths - beds |
show details | |

|
Check over 1 million property listings on Foreclosure.com!
|
browse all offers | |||

Latest news about housing in Randolph, MA collected exclusively by city-data.com from local newspapers, TV, and radio stations

 | How Much Massachusetts Households Make Per Year: Census Data (37 replies) |
| 2024 Real Estate Observations (759 replies) |
| $250K Houses With the Closest Proximity to Boston That Are Also Safe? (65 replies) |
| 2021 Real Estate Observations (1729 replies) |
| 2021 Median Home Prices By Town/City (118 replies) |
| 2020 Real Estate Observations (623 replies) |
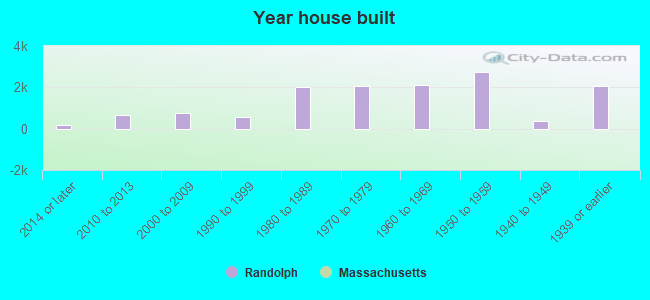
Median year apartment built: 1983
Household type by relationship:
Households: 34,281- In family households: 29,261 (3,432 male householders, 5,126 female householders)
5,269 spouses, 10,387 children (10,019 natural, 102 adopted, 265 stepchildren), 1,152 grandchildren, 856 brothers or sisters, 1,326 parents, 189 foster children, 753 other relatives, 954 non-relatives
- In nonfamily households: 4,675 (1,486 male householders (1,092 living alone)), 2,320 female householders (2,031 living alone)), 869 nonrelatives
- In group quarters: 344
Size of family households: 3,339 2-persons, 1,726 3-persons, 2,049 4-persons, 817 5-persons, 658 6-persons, 222 7-or-more-persons.
Size of nonfamily households: 3,325 1-person, 726 2-persons, 40 3-persons, 69 4-persons.
3,170 married couples with children.
1,602 single-parent households (89 men, 1,513 women).
59.2% of residents of Randolph speak English at home.
6.5% of residents speak Spanish at home (74% speak English very well, 17% speak English well, 4% speak English not well, 5% don't speak English at all).
21.2% of residents speak other Indo-European language at home (63% speak English very well, 22% speak English well, 10% speak English not well, 5% don't speak English at all).
9.7% of residents speak Asian or Pacific Island language at home (37% speak English very well, 31% speak English well, 19% speak English not well, 13% don't speak English at all).
4.6% of residents speak other language at home (83% speak English very well, 12% speak English well, 3% speak English not well, 1% don't speak English at all).
Foreign born population: 13,002 (37.1%)
(76.1% of them are naturalized citizens)
| Here: | 6.3 |
| State: | 6.5 |
| Here: | 4.0 |
| State: | 4.0 |
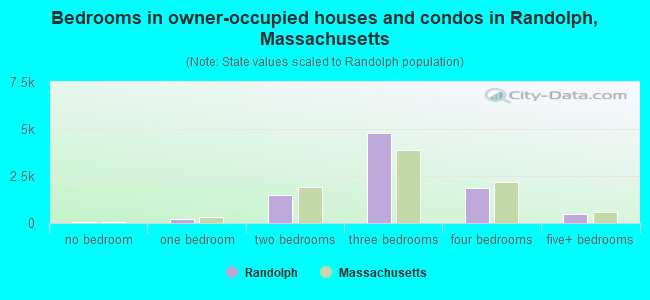
- Bedrooms in owner-occupied houses and condos in Randolph, Massachusetts
- 30no bedroom
- 2351 bedroom
- 1,4832 bedrooms
- 4,8023 bedrooms
- 1,8764 bedrooms
- 4825+ bedrooms
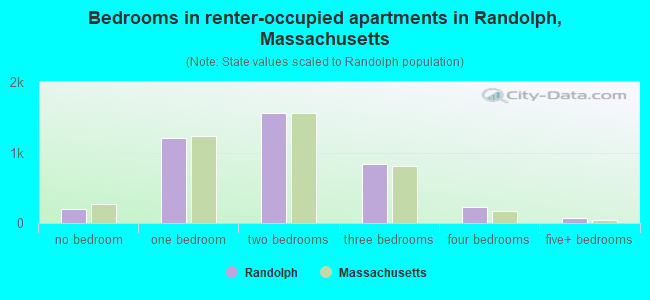
- Bedrooms in renter-occupied apartments in Randolph, Massachusetts
- 200no bedroom
- 1,2071 bedroom
- 1,5632 bedrooms
- 8323 bedrooms
- 2244 bedrooms
- 685+ bedrooms
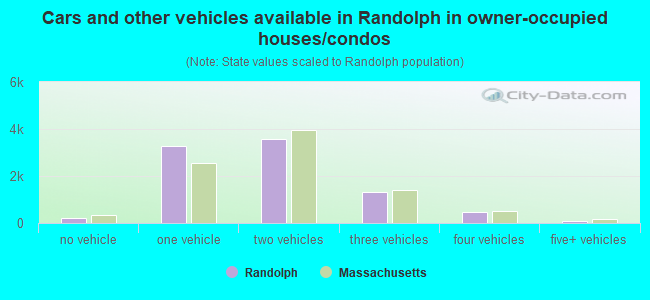
- Cars and other vehicles available in Randolph in owner-occupied houses/condos
- 211no vehicle
- 3,2601 vehicle
- 3,5712 vehicles
- 1,3243 vehicles
- 4784 vehicles
- 645+ vehicles
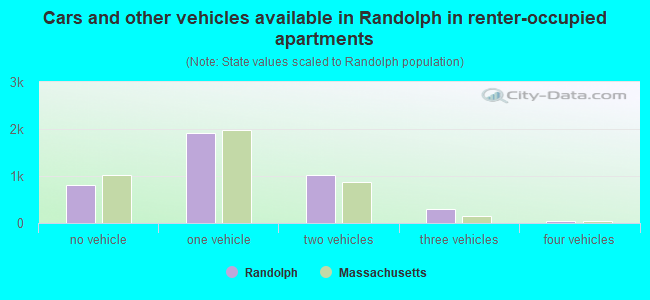
- Cars and other vehicles available in Randolph in renter-occupied apartments
- 816no vehicle
- 1,9241 vehicle
- 1,0212 vehicles
- 2923 vehicles
- 404 vehicles
- 05+ vehicles
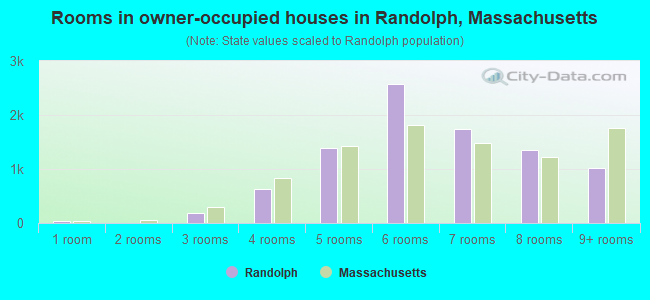
- Rooms in owner-occupied houses in Randolph, Massachusetts
- 301 room
- 02 rooms
- 1893 rooms
- 6254 rooms
- 1,3865 rooms
- 2,5826 rooms
- 1,7327 rooms
- 1,3458 rooms
- 1,0209+ rooms
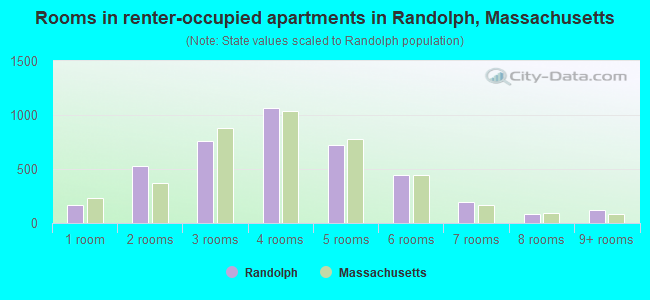
- Rooms in renter-occupied apartments in Randolph, Massachusetts
- 1711 room
- 5282 rooms
- 7603 rooms
- 1,0684 rooms
- 7185 rooms
- 4496 rooms
- 1997 rooms
- 808 rooms
- 1219+ rooms
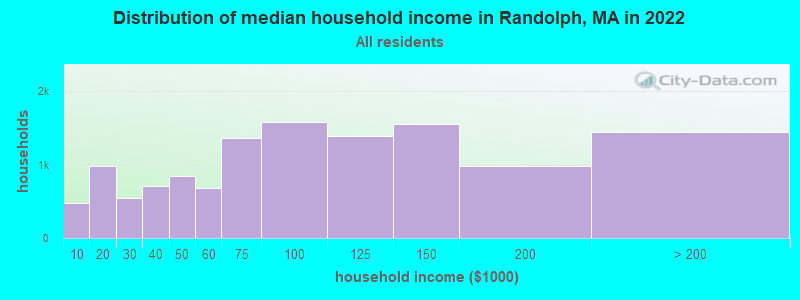
Randolph, MA household income distribution

- 475Less than $10,000
- 978$10,000 to $19,999
- 549$20,000 to $29,999
- 709$30,000 to $39,999
- 842$40,000 to $49,999
- 682$50,000 to $59,999
- 1,361$60,000 to $74,999
- 1,581$75,000 to $99,999
- 1,392$100,000 to $124,999
- 1,547$125,000 to $149,999
- 979$150,000 to $199,999
- 1,442$200,000 or more
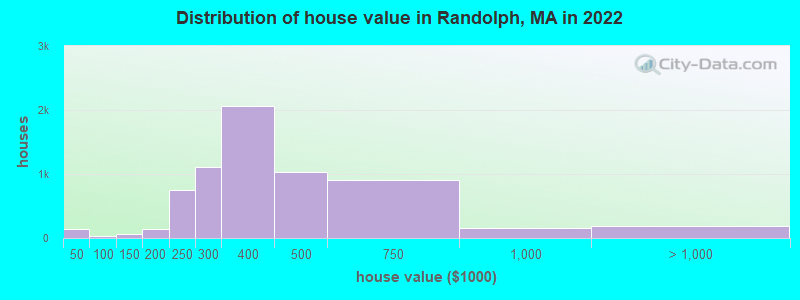
Home value of owner - occupied houses in 2022 in Randolph, MA
-
- 92Less than $10,000
- 36$25,000 to $29,999
- 16$35,000 to $39,999
- 8$60,000 to $69,999
- 20$70,000 to $79,999
- 63$100,000 to $124,999
- 3$125,000 to $149,999
- 42$150,000 to $174,999
- 93$175,000 to $199,999
- 751$200,000 to $249,999
- 1,110$250,000 to $299,999
- 2,058$300,000 to $399,999
- 1,039$400,000 to $499,999
- 905$500,000 to $749,999
- 163$750,000 to $999,999
- 70$1,000,000 to $1,499,999
- 82$1,500,000 to $1,999,999
- 39$2,000,000 or more
Rent paid by renters in 2022 in Randolph, MA
-
- 11Less than $100
- 84$100 to $149
- 121$150 to $199
- 55$200 to $249
- 97$250 to $299
- 71$300 to $349
- 134$350 to $399
- 18$400 to $449
- 36$450 to $499
- 44$500 to $549
- 30$550 to $599
- 9$600 to $649
- 10$650 to $699
- 9$700 to $749
- 47$750 to $799
- 122$800 to $899
- 213$900 to $999
- 456$1,000 to $1,249
- 384$1,250 to $1,499
- 1,581$1,500 to $1,999
- 422$2,000 to $2,499
- 169No cash rent
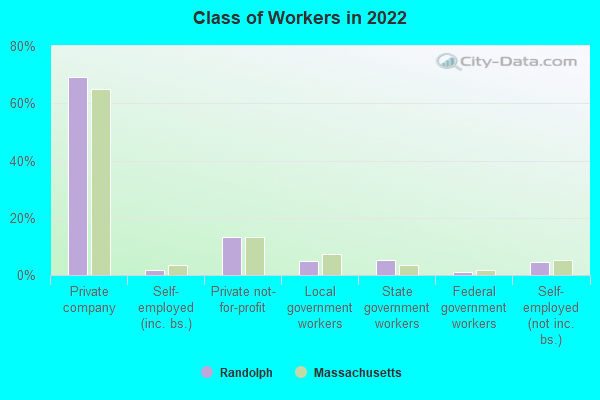
Percentage of workers working in this county: 45.0%
Number of people working at home: 1,024 (5.6% of all workers)
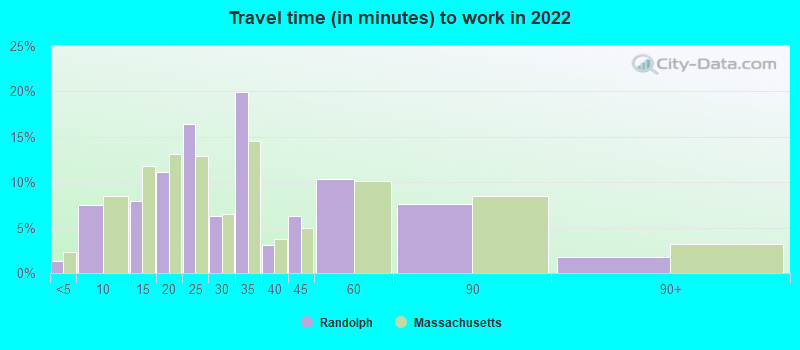
Travel time to work (commute)
- Less than 5 minutes: 138
- 5 to 9 minutes: 833
- 10 to 14 minutes: 1,175
- 15 to 19 minutes: 2,380
- 20 to 24 minutes: 1,987
- 25 to 29 minutes: 667
- 30 to 34 minutes: 2,119
- 35 to 39 minutes: 362
- 40 to 44 minutes: 841
- 45 to 59 minutes: 2,331
- 60 to 89 minutes: 2,084
- 90 or more minutes: 1,067
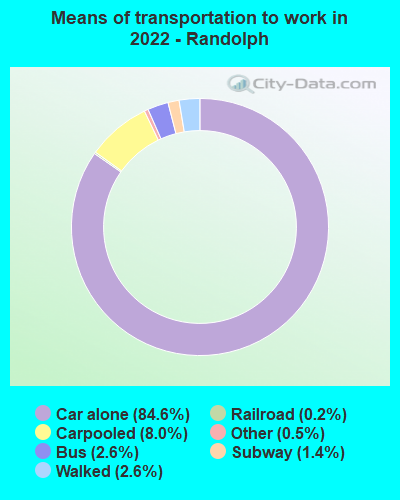
Means of transportation to work:
- Drove a car alone: 6,594 (74.7%)
- Carpooled: 629 (7.1%)
- Bus or trolley bus: 144 (1.6%)
- Subway or elevated: 34 (0.4%)
- Railroad: 8 (0.1%)
- Taxi: 56 (0.6%)
- Walked: 204 (2.3%)
- Worked at home: 896 (10.1%)
- Unemployment by race in 2022
- Unemployment rate for White non-Hispanic residents
- 4.9%Males
- 6.0%Females
- Unemployment rate for Black residents
- 9.2%Males
- 5.5%Females
- Unemployment rate for Asian residents
- 1.4%Males
- 2.9%Females
- Unemployment rate for other race residents
- 4.8%Males
- Unemployment rate for two or more race residents
- 75.4%Males
- 18.4%Females
- Unemployment rate for Hispanic or Latino residents
- 3.0%Males
- 14.2%Females
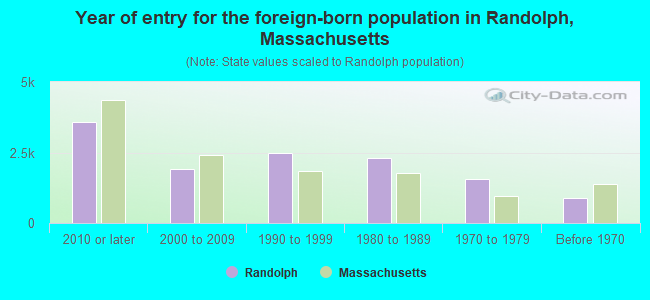
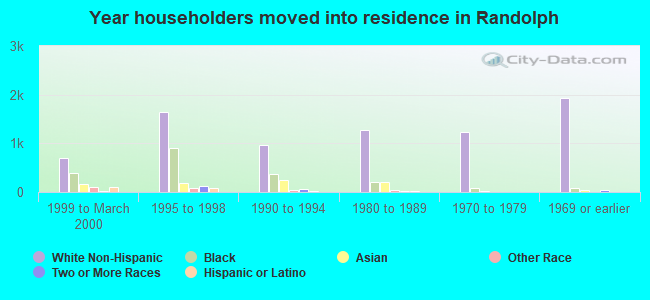
- Year of entry for the foreign-born population in Randolph, Massachusetts
- 3,5822010 or later
- 1,9062000 to 2009
- 2,4891990 to 1999
- 2,3131980 to 1989
- 1,5551970 to 1979
- 900Before 1970
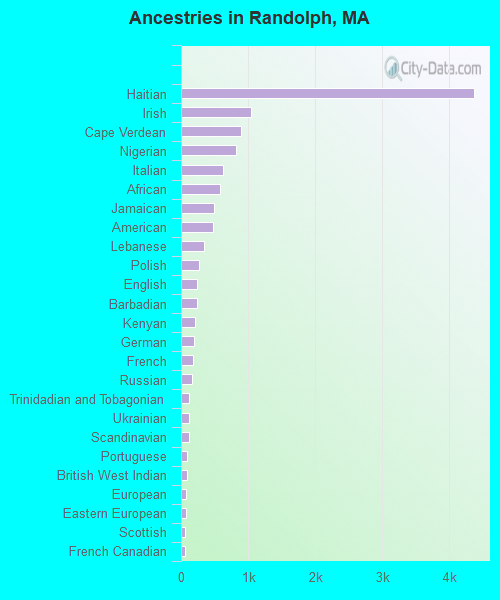
First ancestries reported:
- Haitian: 4,377 (21.1%)
- Irish: 1,041 (5.0%)
- Cape Verdean: 894 (4.3%)
- Nigerian: 825 (4.0%)
- Italian: 633 (3.1%)
- African: 575 (2.8%)
- Jamaican: 489 (2.4%)
- American: 471 (2.3%)
- Lebanese: 336 (1.6%)
- Polish: 267 (1.3%)
- English: 242 (1.2%)
- Barbadian: 237 (1.1%)
- Kenyan: 214 (1.0%)
- German: 190 (0.9%)
- French: 185 (0.9%)
- Russian: 171 (0.8%)
- Trinidadian and Tobagonian: 126 (0.6%)
- Ukrainian: 117 (0.6%)
- Scandinavian: 113 (0.5%)
- Portuguese: 87 (0.4%)
- British West Indian: 86 (0.4%)
- European: 81 (0.4%)
- Eastern European: 79 (0.4%)
- Scottish: 62 (0.3%)
- French Canadian: 58 (0.3%)
- Norwegian: 57 (0.3%)
- Greek: 52 (0.3%)
- Canadian: 49 (0.2%)
- Egyptian: 45 (0.2%)
- West Indian: 44 (0.2%)
- Brazilian: 39 (0.2%)
- Scotch-Irish: 33 (0.2%)
- Dutch: 24 (0.1%)
- Croatian: 23 (0.1%)
- Arab: 20 (0.10%)
- Swedish: 13 (0.06%)
- British: 8 (0.04%)
- Lithuanian: 7 (0.03%)
- Iraqi: 3 (0.01%)
Most common places of birth for foreign-born residents (%):
| Randolph: | 33.7% (3,777) |
| Massachusetts: | 100.0% (-1) |
| Randolph: | 15.2% (1,704) |
| Massachusetts: | 100.0% (-1) |
| Randolph: | 5.2% (583) |
| Massachusetts: | 100.0% (-1) |
| Randolph: | 4.5% (509) |
| Massachusetts: | 100.0% (-1) |
| Randolph: | 4.3% (479) |
| Massachusetts: | 100.0% (-1) |
| Randolph: | 3.3% (365) |
| Massachusetts: | 100.0% (-1) |
| Randolph: | 3.0% (332) |
| Massachusetts: | 100.0% (-1) |
| Randolph: | 2.0% (228) |
| Massachusetts: | 100.0% (-1) |
| Randolph: | 2.0% (228) |
| Massachusetts: | 100.0% (-1) |
| Randolph: | 1.8% (205) |
| Massachusetts: | 100.0% (-1) |
| Randolph: | 1.8% (200) |
| Massachusetts: | 100.0% (-1) |
| Randolph: | 1.8% (197) |
| Massachusetts: | 100.0% (-1) |
| Randolph: | 1.7% (196) |
| Massachusetts: | 100.0% (-1) |
| Randolph: | 1.6% (178) |
| Massachusetts: | 100.0% (-1) |
| Randolph: | 1.5% (169) |
| Massachusetts: | 100.0% (-1) |
Place of birth for U.S.-born residents:
- This state: 19,020
- Other state: 3,427
- Northeast: 1,549
- Midwest: 223
- South: 1,240
- West: 480
92.4% of Randolph residents lived in the same house 1 years ago.
Out of people who lived in different houses, 19.2% lived in this county.
Out of people who lived in different counties, 80.5% lived in Massachusetts.
| Randolph: | 92.4% |
| State average: | 87.7% |
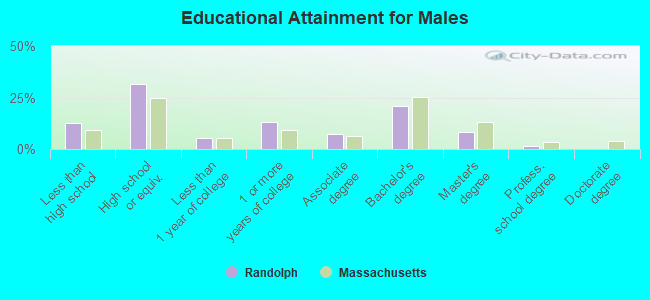
Education attainment for males 25 years and older:
- No schooling: 353
- Nursery to 4th grade: 34
- 5th and 6th grade: 62
- 7th and 8th grade: 92
- 9th grade: 69
- 10th grade: 118
- 11th grade: 262
- 12th grade, no diploma: 425
- High school graduate (or equivalency): 3,521
- Less than 1 year of college: 591
- Some college more than 1 year, no degree: 1,443
- Associate degree: 819
- Bachelor's degree: 2,322
- Master's degree: 917
- Professional school degree: 157
- Doctorate degree: 0
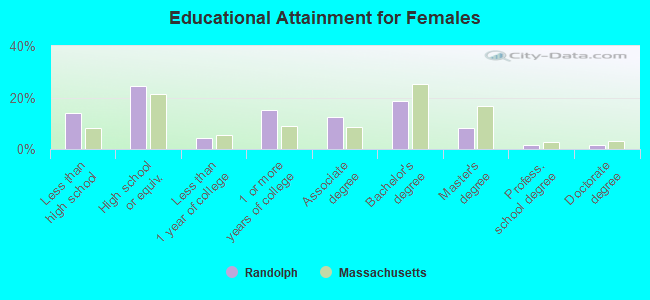
Education attainment for females 25 years and older:
- No schooling: 525
- Nursery to 4th grade: 159
- 5th and 6th grade: 67
- 7th and 8th grade: 301
- 9th grade: 124
- 10th grade: 73
- 11th grade: 41
- 12th grade, no diploma: 534
- High school graduate (or equivalency): 3,239
- Less than 1 year of college: 548
- Some college more than 1 year, no degree: 2,004
- Associate degree: 1,665
- Bachelor's degree: 2,474
- Master's degree: 1,089
- Professional school degree: 195
- Doctorate degree: 192
Housing units in structures:
- One, detached: 8,358
- One, attached: 1,406
- Two: 605
- 3 or 4: 229
- 5 to 9: 530
- 10 to 19: 747
- 20 to 49: 1,063
- 50 or more: 514
- Boats, RVs, vans, etc.: 19
Median worth of mobile homes: $364,636
Housing units lacking complete kitchen facilities in 2022: 1.1%
House/condo owner moved in on average 14 years ago
Renter moved in on average 3 years ago
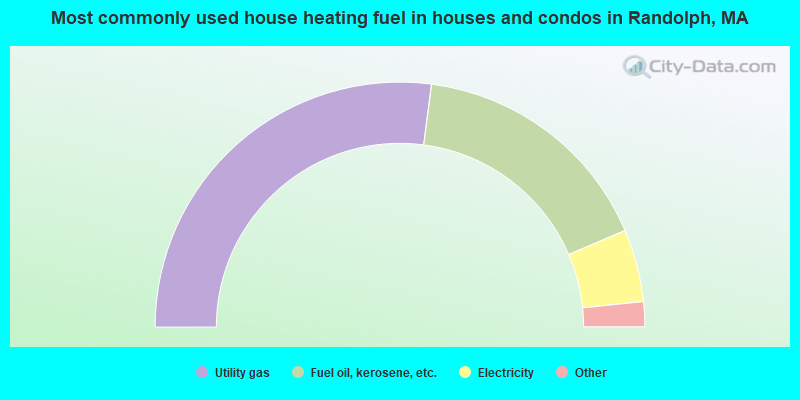
- 54.2%Utility gas
- 33.0%Fuel oil, kerosene, etc.
- 9.6%Electricity
- 2.0%Bottled, tank, or LP gas
- 0.4%Solar energy
- 0.4%Wood
- 0.3%Coal or coke
- 0.2%No fuel used
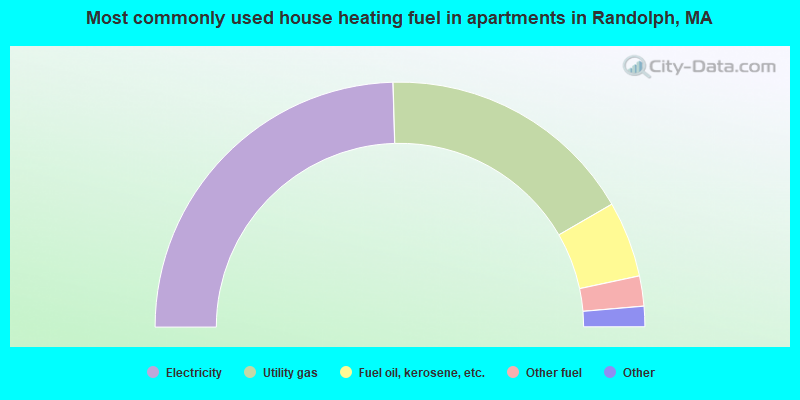
- 49.1%Electricity
- 34.2%Utility gas
- 10.0%Fuel oil, kerosene, etc.
- 4.0%Other fuel
- 1.8%Bottled, tank, or LP gas
- 0.8%No fuel used
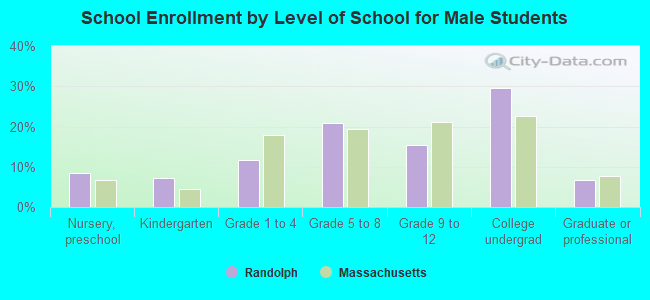
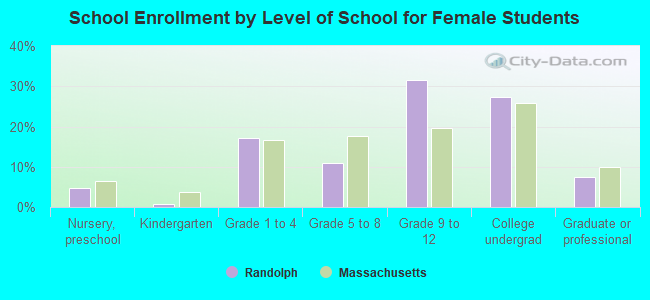
Private vs. public school enrollment:
| Here: | 20.6% |
| Massachusetts: | 10.3% |
| Here: | 21.3% |
| Massachusetts: | 12.3% |
| Here: | 41.6% |
| Massachusetts: | 51.2% |