Red Bank, SC (South Carolina) Houses and Residents
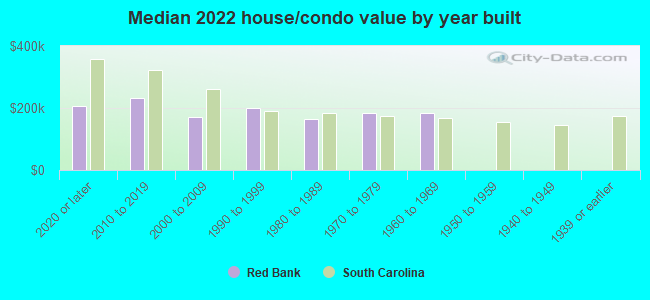
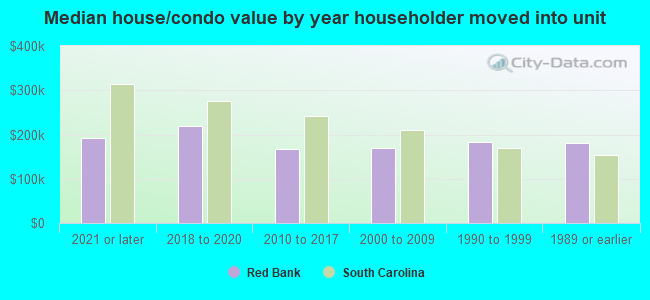
| Red Bank: | $186,126 |
| South Carolina: | $254,600 |
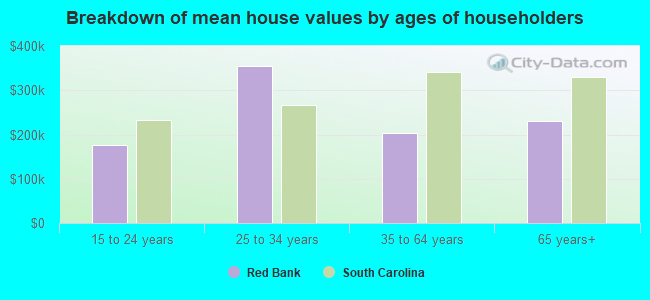
Mean price in 2022:
Detached houses: $220,518
Here: $220,518 State: $368,255 Mobile homes: $87,238
Here: $87,238 State: $102,531
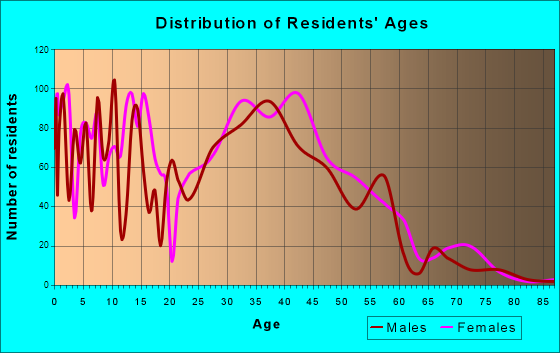
Total population: 9,617 (Urban population: 7,473, Rural population: 1,155 (all nonfarm))
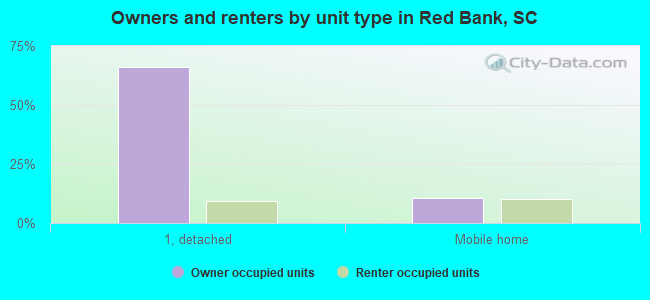
Houses: 4,589 (4,380 occupied: 3,314 owner occupied, 1,061 renter occupied)
| % of renters here: | 24% |
| State: | 28% |
Housing density: 386 houses/condos per square mile
Median price asked for vacant for-sale houses and condos in 2022 in this county: $361,416.
Median contract rent in 2022: $843 (lower quartile is $618, upper quartile is $930)
Median rent asked for vacant for-rent units in 2022: $817
Median gross rent in Red Bank, SC in 2022: $1,059
Housing units in Red Bank with a mortgage: 2,376 (79 second mortgage, 16 home equity loan, 49 both second mortgage and home equity loan)
Houses without a mortgage: 76
Median household income for houses/condos with a mortgage: $72,383
Median household income for apartments without a mortgage: $59,875
Median monthly housing costs: $906
Compare current foreclosures near Red Bank, SC:
| Photo | Address | Area | Beds / Baths | Price | Details |
|---|---|---|---|---|---|

|
#1
Brookview Rd
Columbia, SC 29212
|
1,721 sq. feet
|
2 baths 3 beds |
$280,000
|
show details |

|
#2
Boyd Shumpert Rd
Gaston, SC 29053
|
1,716 sq. feet
|
2 baths 4 beds |
$270,000
|
show details |

|
#3
Orchard Hill Dr
West Columbia, SC 29170
|
1,560 sq. feet
|
1 baths 3 beds |
$240,000
|
show details |

|
#4
Mockingbird Dr
Lexington, SC 29073
|
1,575 sq. feet
|
2 baths 3 beds |
show details | |

|
#5
Morningwood Dr
Lexington, SC 29073
|
1,995 sq. feet
|
3 baths 3 beds |
show details | |

|
#6
Crawfish Ln
Irmo, SC 29063
|
3,844 sq. feet
|
3 baths 5 beds |
show details | |

|
#7
Dutchfork Creek Trl
Irmo, SC 29063
|
4,908 sq. feet
|
5 baths 6 beds |
show details | |

|
#8
Seabury St
Columbia, SC 29203
|
900 sq. feet
|
1 baths 3 beds |
show details | |

|
#9
Beechcreek Cir
Lexington, SC 29072
|
4,068 sq. feet
|
3 baths 4 beds |
show details | |

|
#10
N Oak Ct
Columbia, SC 29212
|
1,632 sq. feet
|
2 baths 3 beds |
show details |
| Photo | Address | Area | Beds / Baths | Price | Details |
|---|---|---|---|---|---|

|
#11
Foxport Dr
Chapin, SC 29036
|
2,326 sq. feet
|
2 baths 4 beds |
show details | |

|
#12
Bear Creek Rd
Chapin, SC 29036
|
1,400 sq. feet
|
1 baths 2 beds |
show details | |

|
#13
Hatton Ln
Lexington, SC 29072
|
1,796 sq. feet
|
2 baths 3 beds |
show details | |

|
#14
N Royal Tower Dr
Irmo, SC 29063
|
1,685 sq. feet
|
2 baths 3 beds |
show details | |

|
#15
Ben Franklin Rd
Leesville, SC 29070
|
- sq. feet
|
2 baths 4 beds |
show details | |

|
#16
Ashley St
Columbia, SC 29203
|
875 sq. feet
|
1 baths 2 beds |
show details | |

|
#17
Holmes Ave
Columbia, SC 29203
|
1,200 sq. feet
|
1 baths 3 beds |
show details | |

|
#18
Madera Dr
Columbia, SC 29203
|
1,751 sq. feet
|
1 baths 3 beds |
show details | |

|
#19
Denny Rd
Columbia, SC 29203
|
936 sq. feet
|
1 baths 2 beds |
show details | |

|
#20
Julius Felder St
Cayce, SC 29033
|
1,036 sq. feet
|
2 baths 3 beds |
show details |
| Photo | Address | Area | Beds / Baths | Price | Details |
|---|---|---|---|---|---|

|
#21
Tayser Ct
Lexington, SC 29072
|
1,806 sq. feet
|
2 baths 3 beds |
show details | |

|
#22
Lou Ln
Columbia, SC 29203
|
1,056 sq. feet
|
2 baths 3 beds |
show details | |

|
#23
Superior Cir
Chapin, SC 29036
|
2,342 sq. feet
|
2 baths 3 beds |
show details | |

|
#24
Dovefield Ln
Lexington, SC 29073
|
- sq. feet
|
2 baths 5 beds |
show details | |

|
#25
Andrews Rd
Columbia, SC 29201
|
1,736 sq. feet
|
1 baths 2 beds |
show details | |

|
#26
Jones Rd
Irmo, SC 29063
|
3,717 sq. feet
|
4 baths 4 beds |
show details | |

|
#27
Tamara Ln
Gaston, SC 29053
|
2,128 sq. feet
|
3 baths 4 beds |
show details | |

|
#28
Dunbar Rd
West Columbia, SC 29172
|
1,040 sq. feet
|
1 baths 3 beds |
show details | |

|
#29
Rembert St
Columbia, SC 29201
|
2,098 sq. feet
|
2 baths 3 beds |
show details | |

|
#30
Audubon Oaks Way
Irmo, SC 29063
|
2,027 sq. feet
|
2 baths 4 beds |
show details |
| Photo | Address | Area | Beds / Baths | Price | Details |
|---|---|---|---|---|---|

|
#31
Blanding St
Columbia, SC 29201
|
2,402 sq. feet
|
2 baths 3 beds |
show details | |

|
#32
Duke Ave
Columbia, SC 29203
|
2,632 sq. feet
|
1 baths 4 beds |
show details | |

|
#33
Brookridge Dr
Columbia, SC 29203
|
725 sq. feet
|
1 baths 2 beds |
show details | |

|
#34
Marion St
Columbia, SC 29201
|
1,972 sq. feet
|
3 baths 3 beds |
show details | |

|
#35
N Royal Tower Dr
Irmo, SC 29063
|
1,188 sq. feet
|
2 baths 3 beds |
show details | |

|
#36
N Royal Tower Dr
Irmo, SC 29063
|
1,685 sq. feet
|
2 baths 3 beds |
show details | |

|
#37
Abingdon Rd
Columbia, SC 29203
|
1,475 sq. feet
|
2 baths 3 beds |
show details | |

|
#38
Cockspur Rd
Irmo, SC 29063
|
1,248 sq. feet
|
2 baths 3 beds |
show details | |

|
#39
Driftwood Dr
Columbia, SC 29210
|
1,328 sq. feet
|
2 baths 3 beds |
show details | |

|
#40
Koulter Dr
Columbia, SC 29210
|
1,486 sq. feet
|
2 baths 3 beds |
show details |
| Photo | Address | Area | Beds / Baths | Price | Details |
|---|---|---|---|---|---|

|
#41
London Pride Rd
Irmo, SC 29063
|
2,269 sq. feet
|
2 baths 3 beds |
show details | |

|
#42
Doncaster Dr
Irmo, SC 29063
|
1,742 sq. feet
|
2 baths 3 beds |
show details | |

|
#43
Westpine Ct
Columbia, SC 29212
|
1,204 sq. feet
|
2 baths 3 beds |
show details | |

|
#44
Forest Trail Ct
Columbia, SC 29212
|
1,308 sq. feet
|
1 baths 3 beds |
show details | |

|
#45
Park St
Columbia, SC 29201
|
1,882 sq. feet
|
2 baths 3 beds |
show details | |

|
#46
Minehead Rd
Irmo, SC 29063
|
1,377 sq. feet
|
2 baths 3 beds |
show details | |

|
#47
Olympia Ave
Columbia, SC 29201
|
2,488 sq. feet
|
2 baths 3 beds |
show details | |

|
#48
Kenton Dr
Irmo, SC 29063
|
1,301 sq. feet
|
2 baths 3 beds |
show details | |

|
#49
Minehead Rd
Irmo, SC 29063
|
1,139 sq. feet
|
2 baths 3 beds |
show details | |

|
Check over 1 million property listings on Foreclosure.com!
|
browse all offers | |||


 | Bluefield Neighborhood in Lexington (Red Bank) (3 replies) |
| Moving 2Lexington area (7 replies) |
| Approximate utilities cost for Lexington (Red Bank)? (0 replies) |
| Race in NE Columbia - hitting to close to home (108 replies) |
| Columbia - general (5143 replies) |
| Possibly move to Columbia (14 replies) |
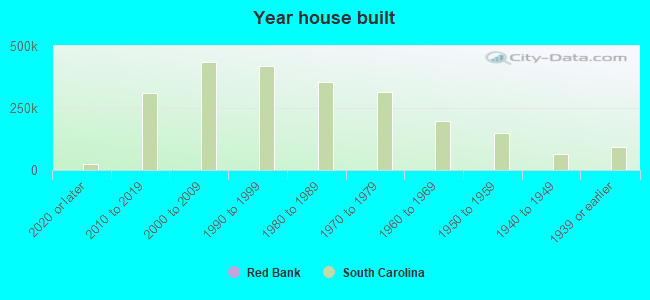
Median year apartment built: 1990
Household type by relationship:
Households: 10,859- Male householders: 2,065 (438 living alone), Female householders: 2,286 (602 living alone)
2,192 spouses (2,172 opposite-sex spouses), 237 unmarried partners, (237 opposite-sex unmarried partners), 3,007 children (2,840 natural, 0 adopted, 166 stepchildren), 470 grandchildren, 147 brothers or sisters, 93 parents, 66 foster children, 105 other relatives, 161 non-relatives
- In group quarters: 24
Size of family households: 1,426 2-persons, 949 3-persons, 674 4-persons, 123 5-persons, 63 6-persons, 61 7-or-more-persons.
Size of nonfamily households: 1,014 1-person, 98 2-persons, 14 4-persons.
1,135 married couples with children.
1,100 single-parent households (145 men, 955 women).
92.9% of residents of Red Bank speak English at home.
5.5% of residents speak Spanish at home (61% speak English very well, 33% speak English well, 7% speak English not well).
1.4% of residents speak other Indo-European language at home (65% speak English very well, 12% speak English well, 23% speak English not well).
Foreign born population: 336 (3.1%)
(31.2% of them are naturalized citizens)
| Here: | 5.9 |
| State: | 6.4 |
| Here: | 4.2 |
| State: | 4.5 |
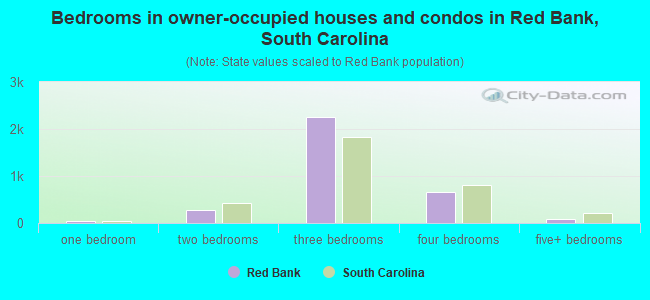
- Bedrooms in owner-occupied houses and condos in Red Bank, South Carolina
- 0no bedroom
- 401 bedroom
- 2692 bedrooms
- 2,2563 bedrooms
- 6694 bedrooms
- 805+ bedrooms
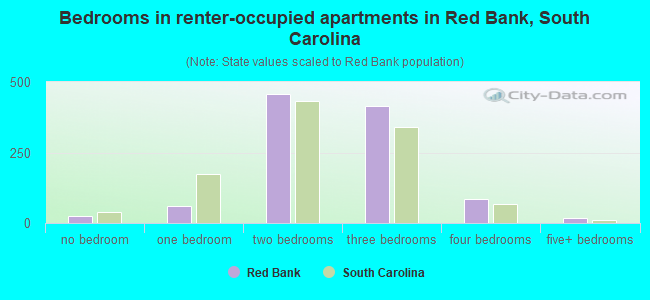
- Bedrooms in renter-occupied apartments in Red Bank, South Carolina
- 25no bedroom
- 621 bedroom
- 4582 bedrooms
- 4153 bedrooms
- 844 bedrooms
- 185+ bedrooms
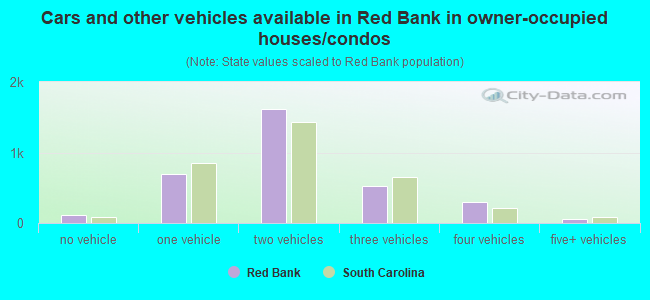
- Cars and other vehicles available in Red Bank in owner-occupied houses/condos
- 118no vehicle
- 7011 vehicle
- 1,6102 vehicles
- 5313 vehicles
- 2984 vehicles
- 565+ vehicles
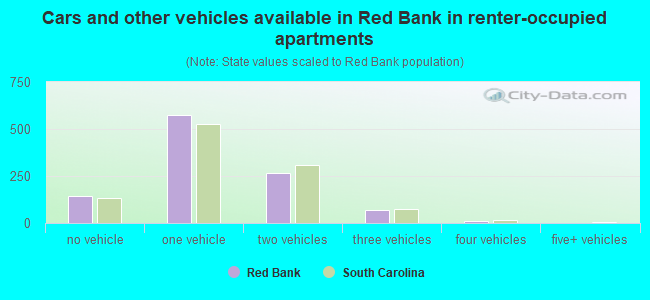
- Cars and other vehicles available in Red Bank in renter-occupied apartments
- 145no vehicle
- 5721 vehicle
- 2662 vehicles
- 673 vehicles
- 114 vehicles
- 05+ vehicles

- Rooms in owner-occupied houses in Red Bank, South Carolina
- 01 room
- 02 rooms
- 403 rooms
- 2604 rooms
- 9945 rooms
- 7416 rooms
- 6087 rooms
- 1638 rooms
- 5099+ rooms
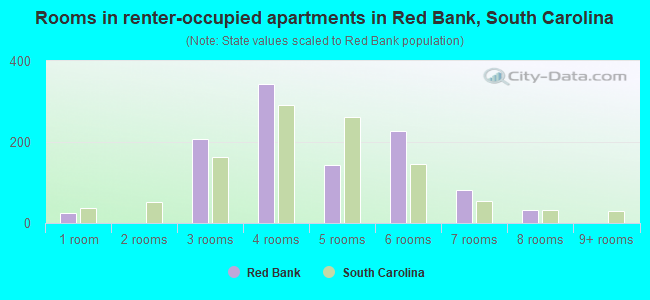
- Rooms in renter-occupied apartments in Red Bank, South Carolina
- 251 room
- 02 rooms
- 2083 rooms
- 3444 rooms
- 1445 rooms
- 2286 rooms
- 827 rooms
- 318 rooms
- 09+ rooms
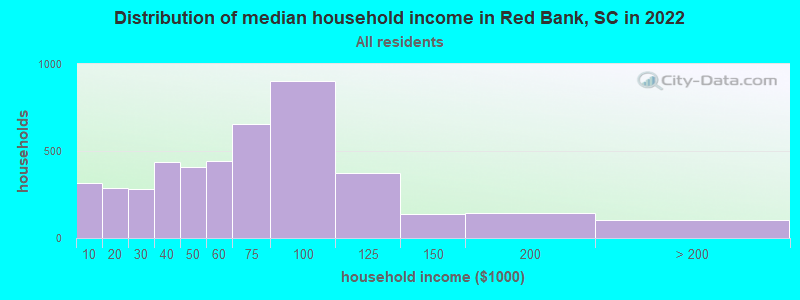
Red Bank, SC household income distribution

- 314Less than $10,000
- 286$10,000 to $19,999
- 283$20,000 to $29,999
- 439$30,000 to $39,999
- 407$40,000 to $49,999
- 445$50,000 to $59,999
- 658$60,000 to $74,999
- 904$75,000 to $99,999
- 372$100,000 to $124,999
- 140$125,000 to $149,999
- 142$150,000 to $199,999
- 102$200,000 or more
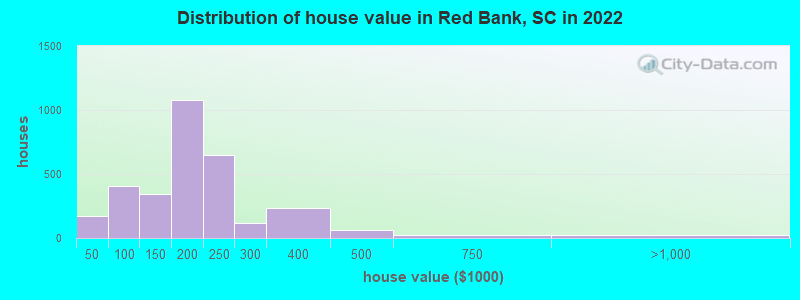
Home value of owner - occupied houses in 2022 in Red Bank, SC
-
- 62Less than $10,000
- 13$15,000 to $19,999
- 22$20,000 to $24,999
- 12$25,000 to $29,999
- 42$30,000 to $34,999
- 18$40,000 to $49,999
- 92$50,000 to $59,999
- 18$60,000 to $69,999
- 66$70,000 to $79,999
- 81$80,000 to $89,999
- 132$90,000 to $99,999
- 148$100,000 to $124,999
- 193$125,000 to $149,999
- 728$150,000 to $174,999
- 346$175,000 to $199,999
- 650$200,000 to $249,999
- 120$250,000 to $299,999
- 232$300,000 to $399,999
- 60$400,000 to $499,999
- 24$500,000 to $749,999
- 20$750,000 to $999,999
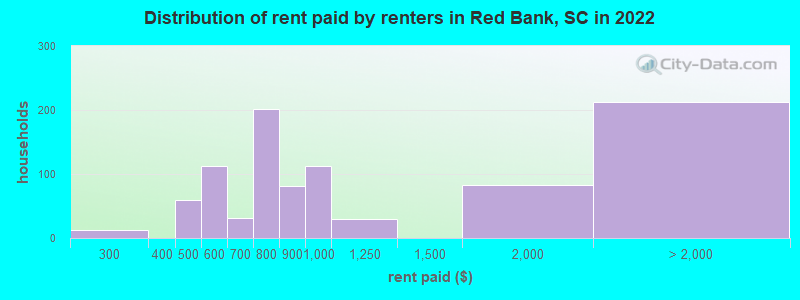
Rent paid by renters in 2022 in Red Bank, SC
-
- 12$250 to $299
- 58$450 to $499
- 35$500 to $549
- 77$550 to $599
- 3$600 to $649
- 28$650 to $699
- 17$700 to $749
- 183$750 to $799
- 80$800 to $899
- 113$900 to $999
- 29$1,000 to $1,249
- 83$1,500 to $1,999
- 212No cash rent
Percentage of workers working in this county: 76.4%
Number of people working at home: 609 (11.7% of all workers)
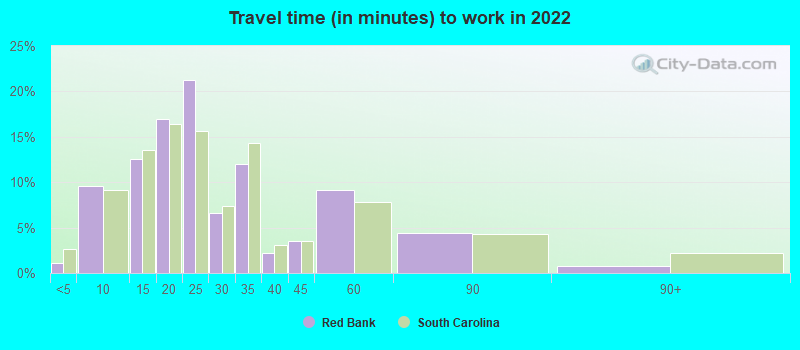
Travel time to work (commute)
- Less than 5 minutes: 50
- 5 to 9 minutes: 283
- 10 to 14 minutes: 811
- 15 to 19 minutes: 801
- 20 to 24 minutes: 901
- 25 to 29 minutes: 411
- 30 to 34 minutes: 527
- 35 to 39 minutes: 244
- 40 to 44 minutes: 187
- 45 to 59 minutes: 233
- 60 to 89 minutes: 59
- 90 or more minutes: 50
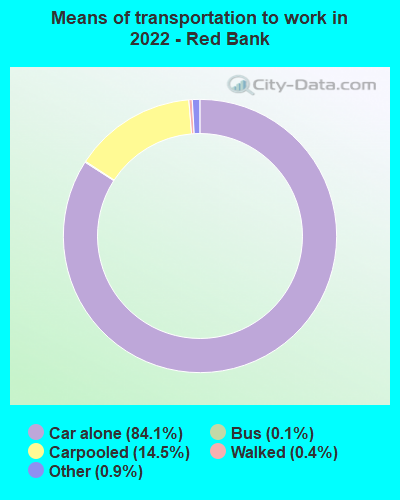
Means of transportation to work:
- Drove a car alone: 3,132 (73.2%)
- Carpooled: 474 (11.1%)
- Bus: 5 (0.1%)
- Taxi: 33 (0.8%)
- Walked: 11 (0.3%)
- Worked at home: 609 (14.2%)
- Unemployment by race in 2022
- Unemployment rate for White non-Hispanic residents
- 6.7%Males
- 4.5%Females
- Unemployment rate for Black residents
- 7.9%Females
- Unemployment rate for other race residents
- 11.5%Males
- Unemployment rate for two or more race residents
- 6.5%Males
- 7.6%Females
- Unemployment rate for Hispanic or Latino residents
- 4.6%Males
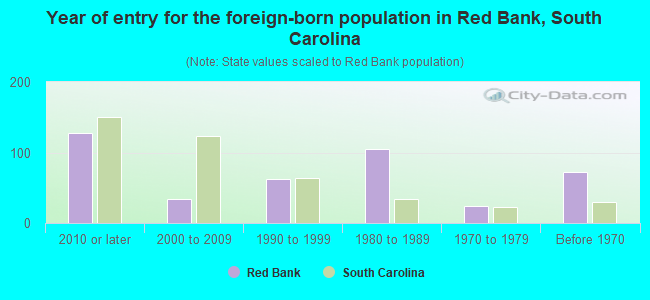
- Year of entry for the foreign-born population in Red Bank, South Carolina
- 1272010 or later
- 342000 to 2009
- 621990 to 1999
- 1051980 to 1989
- 241970 to 1979
- 72Before 1970
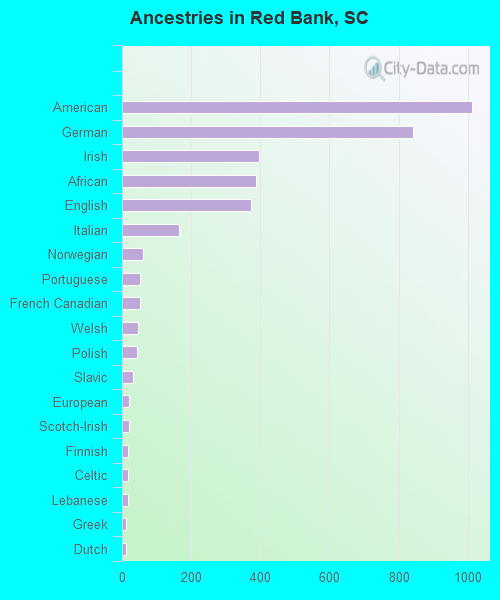
First ancestries reported:
- American: 1,011 (21.6%)
- German: 842 (18.0%)
- Irish: 395 (8.4%)
- African: 387 (8.3%)
- English: 373 (8.0%)
- Italian: 165 (3.5%)
- Norwegian: 61 (1.3%)
- Portuguese: 53 (1.1%)
- French Canadian: 51 (1.1%)
- Welsh: 47 (1.0%)
- Polish: 42 (0.9%)
- Slavic: 31 (0.7%)
- European: 20 (0.4%)
- Scotch-Irish: 20 (0.4%)
- Finnish: 18 (0.4%)
- Celtic: 17 (0.4%)
- Lebanese: 16 (0.3%)
- Greek: 12 (0.3%)
- Dutch: 11 (0.2%)
- Brazilian: 9 (0.2%)
- Hungarian: 9 (0.2%)
- British: 4 (0.09%)
Most common places of birth for foreign-born residents (%):
| Red Bank: | 19.0% (62) |
| South Carolina: | 2.0% (5,344) |
| Red Bank: | 17.5% (57) |
| South Carolina: | 22.5% (60,774) |
| Red Bank: | 14.7% (48) |
| South Carolina: | 3.0% (8,193) |
| Red Bank: | 13.2% (43) |
| South Carolina: | 3.7% (9,982) |
| Red Bank: | 6.7% (22) |
| South Carolina: | 4.3% (11,533) |
| Red Bank: | 6.4% (21) |
| South Carolina: | 1.1% (2,998) |
| Red Bank: | 6.4% (21) |
| South Carolina: | 4.8% (12,834) |
| Red Bank: | 4.6% (15) |
| South Carolina: | 1.4% (3,822) |
| Red Bank: | 4.3% (14) |
| South Carolina: | 4.1% (11,031) |
| Red Bank: | 3.1% (10) |
| South Carolina: | 1.3% (3,522) |
| Red Bank: | 1.8% (6) |
| South Carolina: | 2.3% (6,308) |
Place of birth for U.S.-born residents:
- This state: 6,364
- Other state: 4,014
- Northeast: 786
- Midwest: 487
- South: 2,411
- West: 302
88.0% of Red Bank residents lived in the same house 1 years ago.
Out of people who lived in different houses, 28.5% lived in this county.
Out of people who lived in different counties, 49.5% lived in South Carolina.
| Red Bank: | 88.0% |
| State average: | 86.5% |
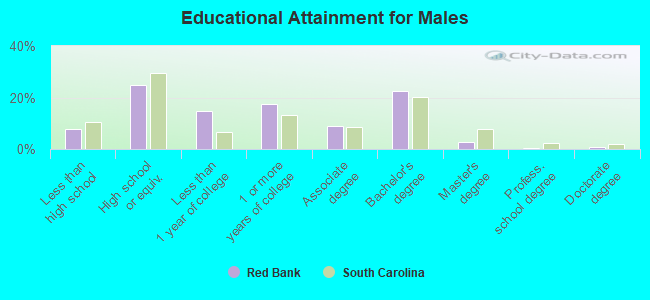
Education attainment for males 25 years and older:
- No schooling: 0
- Nursery to 4th grade: 0
- 5th and 6th grade: 0
- 7th and 8th grade: 0
- 9th grade: 23
- 10th grade: 135
- 11th grade: 44
- 12th grade, no diploma: 66
- High school graduate (or equivalency): 838
- Less than 1 year of college: 500
- Some college more than 1 year, no degree: 593
- Associate degree: 296
- Bachelor's degree: 766
- Master's degree: 94
- Professional school degree: 7
- Doctorate degree: 23
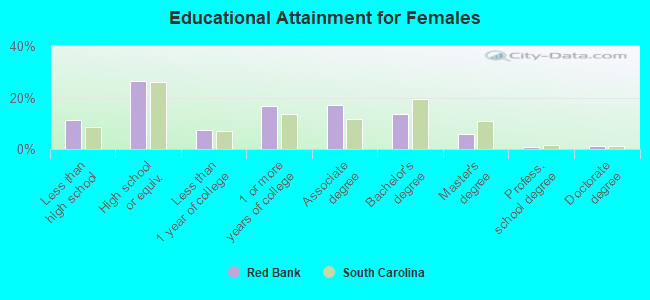
Education attainment for females 25 years and older:
- No schooling: 115
- Nursery to 4th grade: 0
- 5th and 6th grade: 5
- 7th and 8th grade: 40
- 9th grade: 29
- 10th grade: 127
- 11th grade: 51
- 12th grade, no diploma: 75
- High school graduate (or equivalency): 1,035
- Less than 1 year of college: 281
- Some college more than 1 year, no degree: 658
- Associate degree: 659
- Bachelor's degree: 525
- Master's degree: 226
- Professional school degree: 26
- Doctorate degree: 48
Housing units in structures:
- One, detached: 3,368
- Two: 19
- 5 to 9: 40
- Mobile homes: 1,098
- Boats, RVs, vans, etc.: 62
Median worth of mobile homes: $60,914
Housing units lacking complete kitchen facilities in 2022: 3.5%
House/condo owner moved in on average 10 years ago
Renter moved in on average 2 years ago
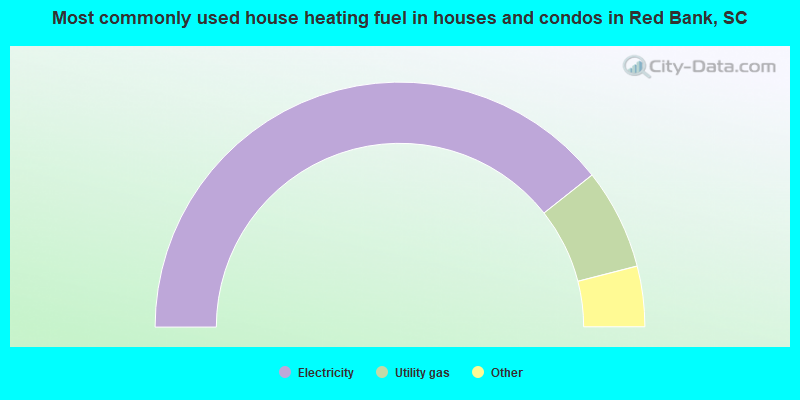
- 78.7%Electricity
- 13.3%Utility gas
- 3.0%Wood
- 2.9%Bottled, tank, or LP gas
- 1.2%Fuel oil, kerosene, etc.
- 0.7%No fuel used
- 0.2%Solar energy
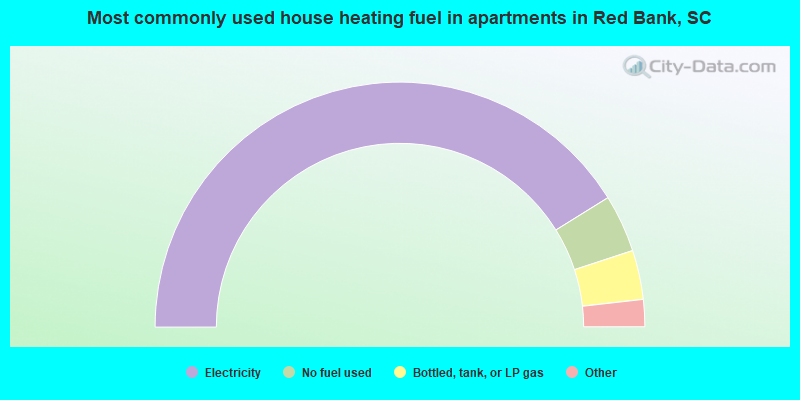
- 82.4%Electricity
- 7.6%No fuel used
- 6.5%Bottled, tank, or LP gas
- 2.0%Fuel oil, kerosene, etc.
- 1.5%Utility gas
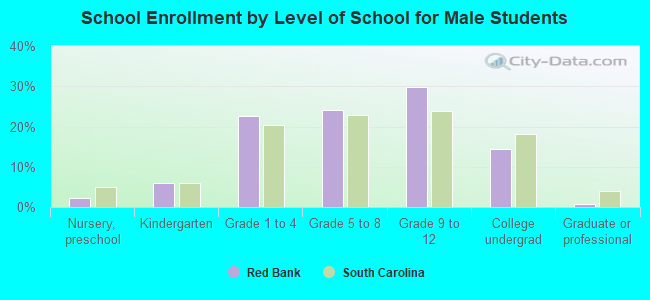
Private vs. public school enrollment:
| Here: | 0.0% |
| South Carolina: | 14.4% |
| Here: | 0.0% |
| South Carolina: | 11.1% |
| Here: | 12.2% |
| South Carolina: | 21.9% |