Reedsburg, WI (Wisconsin) Houses and Residents
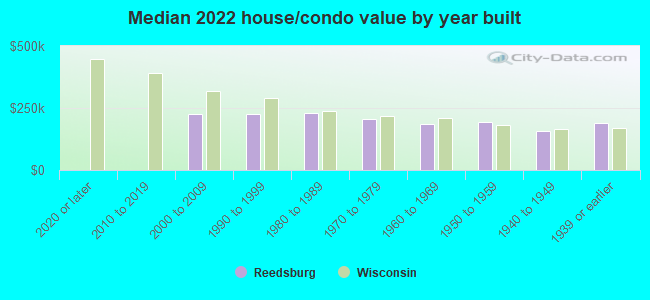
Estimated median house or condo value in 2022: $219,551 (it was $88,000 in 2000 )
Reedsburg:
$219,551Wisconsin:
$252,800
Lower value quartile - upper value quartile: $150,353 - $280,199Mean price in 2022: Detached houses: $217,061 Here:
$217,061State:
$308,468
Townhouses or other attached units: $212,067 Here:
$212,067State:
$265,873
In 2-unit structures: $194,308 Here:
$194,308State:
$203,667
Mobile homes: $43,241 Here:
$43,241State:
$79,042
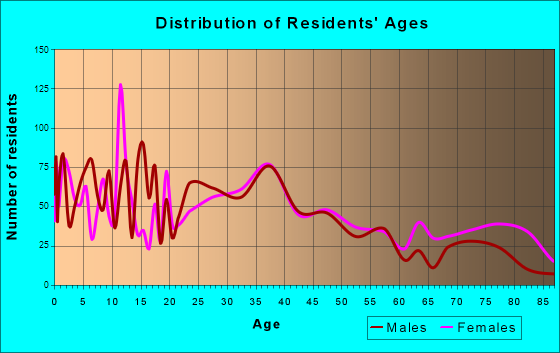
Total population: 9,533 (Urban population: 7,706 (all inside urban clusters), Rural population: 93 (all nonfarm) )
Houses: 4,116 (4,017 occupied: 2,633 owner occupied, 1,469 renter occupied )
% of renters here:
36%State:
32%
Housing density: 791 houses/condos per square mile
Median price asked for vacant for-sale houses and condos in 2022 in this county: $229,078.
Median contract rent in 2022: $800 (lower quartile is $540, upper quartile is $935)
Median rent asked for vacant for-rent units in 2022: $2,652
Median gross rent in Reedsburg, WI in 2022: $917
Housing units in Reedsburg with a mortgage: 1,575 (285 second mortgage, 0 home equity loan, 255 both second mortgage and home equity loan )Houses without a mortgage: 66
Median household income for houses/condos with a mortgage: $93,600
Median household income for apartments without a mortgage: $68,046
Median monthly housing costs: $959
Data:
Median house or condo value ($)
Median house or condo value ($ change since 2000)
Median house or condo value ($) - White
Median house or condo value ($) - Black or African American
Median house or condo value ($) - Asian
Median house or condo value ($) - Hispanic or Latino
Median house or condo value ($) - American Indian and Alaska Native
Median house or condo value ($) - Multirace
Median house or condo value ($) - Other Race
Median price asked for mobile homes ($)
Household density (households per square mile)
Mean house or condo value by units in structure - 1, detached ($)
Mean house or condo value by units in structure - 1, attached ($)
Mean house or condo value by units in structure - 2 ($)
Mean house or condo value by units in structure by units in structure - 3 or 4 ($)
Mean house or condo value by units in structure - 5 or more ($)
Mean house or condo value by units in structure - Boat, RV, van, etc. ($)
Mean house or condo value by units in structure - Mobile home ($)
Median contract rent ($)
Median contract rent - Lower quartile ($)
Median contract rent - Upper quartile ($)
Median gross rent ($)
Urban houses (%)
Rural houses (%)
Houses occupied (%)
Houses occupied (% change since 2000)
Houses owner occupied (%)
Houses owner occupied (% change since 2000)
Houses renter occupied (%)
Houses renter occupied (% change since 2000)
Vacant housing units - For rent (%)
Vacant housing units - For rent (% change since 2000)
Vacant housing units - For sale only (%)
Vacant housing units - For sale only (% change since 2000)
Vacant housing units - Rented or sold, not occupied (%)
Vacant housing units - Rented or sold, not occupied (% change since 2000)
Vacant housing units - For seasonal, recreational, or occasional use (%)
Vacant housing units - For seasonal, recreational, or occasional use (% change since 2000)
Vacant housing units - For migrant workers (%)
Vacant housing units - For migrant workers (% change since 2000)
Vacant housing units - Other vacant (%)
Vacant housing units - Other vacant (% change since 2000)
Median monthly housing costs ($)
Median household income for houses/condos with a mortgage ($)
Median household income for houses/condos without a mortgage ($)
Median household income ($)
Median household income ($) - White
Median household income ($) - Black or African American
Median household income ($) - Asian
Median household income ($) - Hispanic or Latino
Median household income ($) - American Indian and Alaska Native
Median household income ($) - Multirace
Median household income ($) - Other Race
Mortgage status - with mortgage (%)
Mortgage status - with second mortgage (%)
Mortgage status - with home equity loan (%)
Mortgage status - with both second mortgage and home equity loan (%)
Mortgage status - without a mortgage (%)
Median year house/condo built
Median year apartment built
Household type by relationship - Male householder living alone (%)
Household type by relationship - Male householder not living alone (%)
Household type by relationship - Female householder living alone (%)
Household type by relationship - Female householder not living alone (%)
Household type by relationship - Opposite-Sex spouse (%)
Household type by relationship - Same-Sex spouse (%)
Household type by relationship - Opposite-Sex unmarried partner (%)
Household type by relationship - Same-Sex unmarried partner (%)
Household type by relationship - In group quarters (%)
Size of family households - 2-person household (%)
Size of family households - 3-person household (%)
Size of family households - 4-person household (%)
Size of family households - 5-person household (%)
Size of family households - 6-person household (%)
Size of family households - 7-or-more-person household (%)
Size of nonfamily households - 1-person household (%)
Size of nonfamily households - 2-person household (%)
Size of nonfamily households - 3-person household (%)
Size of nonfamily households - 4-person household (%)
Size of nonfamily households - 5-person household (%)
Size of nonfamily households - 6-person household (%)
Size of nonfamily households - 7-or-moreperson household (%)
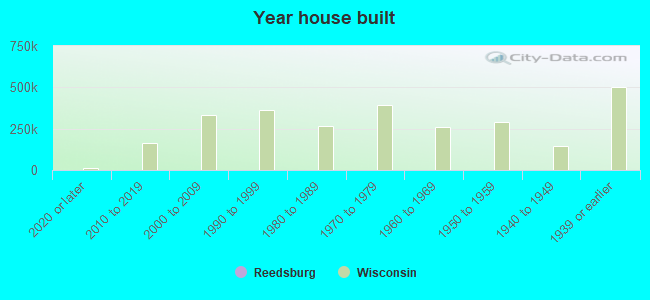
Year house built - Built 2010 or later (%)
Year house built - Built 2000 to 2009 (%)
Year house built - Built 1990 to 1999 (%)
Year house built - Built 1980 to 1989 (%)
Year house built - Built 1970 to 1979 (%)
Year house built - Built 1960 to 1969 (%)
Year house built - Built 1950 to 1959 (%)
Year house built - Built 1940 to 1949 (%)
Year house built - Built 1939 or earlier (%)
Median number of rooms in houses and condos
Median number of rooms in apartments
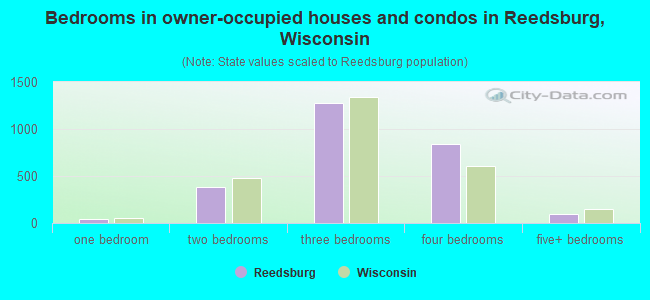
Median number of bedrooms in owner occupied houses
Mean number of bedrooms in owner occupied houses
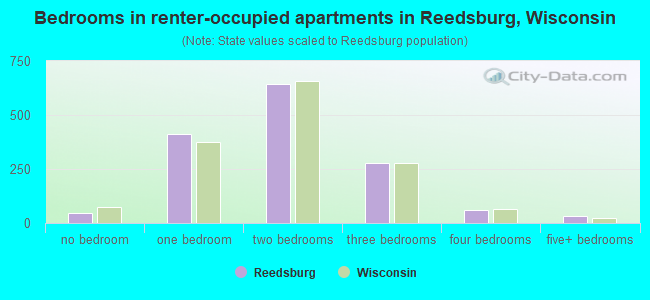
Median number of bedrooms in renter occupied houses
Mean number of bedrooms in renter occupied houses
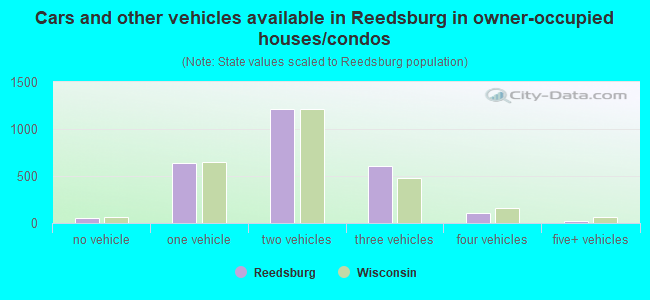
Median number of vehichles in owner occupied houses
Mean number of vehichles in owner occupied houses
Median number of vehichles in renter occupied houses
Mean number of vehichles in renter occupied houses
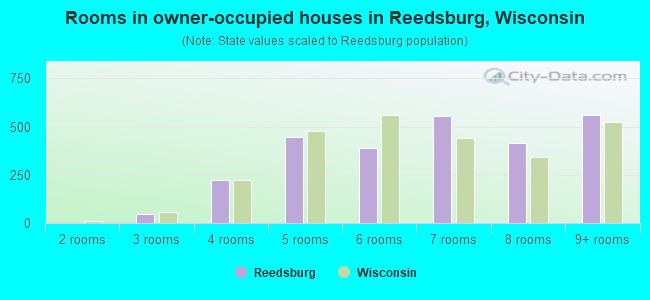
Rooms in owner-occupied houses - 1 room (%)
Rooms in owner-occupied houses - 2 rooms (%)
Rooms in owner-occupied houses - 3 rooms (%)
Rooms in owner-occupied houses - 4 rooms (%)
Rooms in owner-occupied houses - 5 rooms (%)
Rooms in owner-occupied houses - 6 rooms (%)
Rooms in owner-occupied houses - 7 rooms (%)
Rooms in owner-occupied houses - 8 rooms (%)
Rooms in owner-occupied houses - 9+ rooms (%)
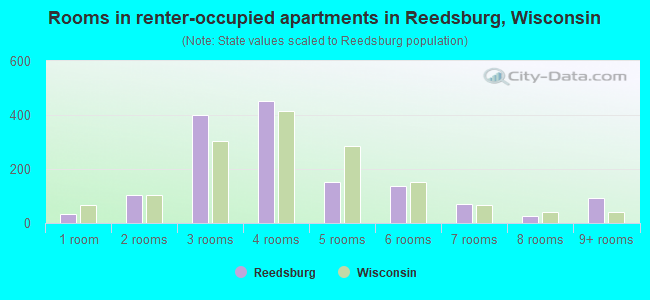
Rooms in renter-occupied houses - 1 room (%)
Rooms in renter-occupied houses - 2 rooms (%)
Rooms in renter-occupied houses - 3 rooms (%)
Rooms in renter-occupied houses - 4 rooms (%)
Rooms in renter-occupied houses - 5 rooms (%)
Rooms in renter-occupied houses - 6 rooms (%)
Rooms in renter-occupied houses - 7 rooms (%)
Rooms in renter-occupied houses - 8 rooms (%)
Rooms in renter-occupied houses - 9+ rooms (%)
Bedrooms in owner-occupied houses - no bedrooms (%)
Bedrooms in owner-occupied houses - 1 bedroom (%)
Bedrooms in owner-occupied houses - 2 bedrooms (%)
Bedrooms in owner-occupied houses - 3 bedrooms (%)
Bedrooms in owner-occupied houses - 4 bedrooms (%)
Bedrooms in owner-occupied houses - 5+ bedrooms (%)
Bedrooms in renter-occupied houses - no bedrooms (%)
Bedrooms in renter-occupied houses - 1 bedroom (%)
Bedrooms in renter-occupied houses - 2 bedrooms (%)
Bedrooms in renter-occupied houses - 3 bedrooms (%)
Bedrooms in renter-occupied houses - 4 bedrooms (%)
Bedrooms in renter-occupied houses - 5+ bedrooms (%)
Vehicles available in owner-occupied houses - no vehicle available (%)
Vehicles available in owner-occupied houses - 1 vehicle available(%)
Vehicles available in owner-occupied houses - 2 Vehicles available (%)
Vehicles available in owner-occupied houses - 3 Vehicles available (%)
Vehicles available in owner-occupied houses - 4 Vehicles available (%)
Vehicles available in owner-occupied houses - 5+ Vehicles available (%)
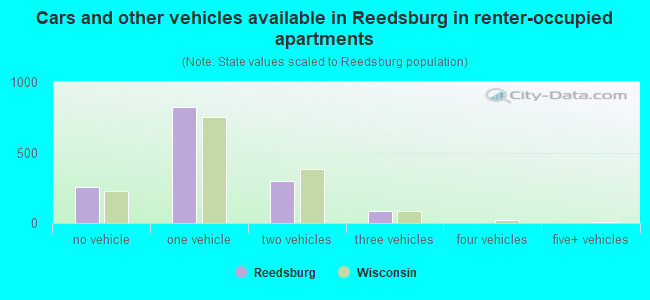
Vehicles available in renter-occupied houses - no vehicle available (%)
Vehicles available in renter-occupied houses - 1 vehicle available (%)
Vehicles available in renter-occupied houses - 2 Vehicles available (%)
Vehicles available in renter-occupied houses - 3 Vehicles available (%)
Vehicles available in renter-occupied houses - 4 Vehicles available (%)
Vehicles available in renter-occupied houses - 5+ Vehicles available (%)
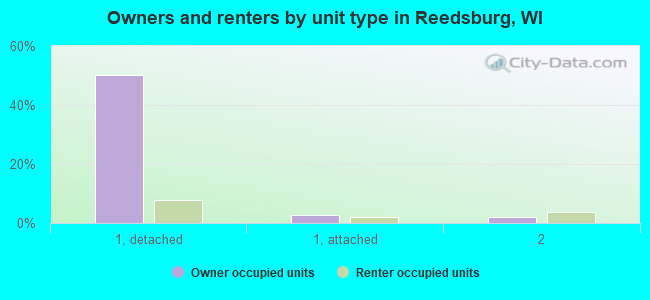
Housing units in structures - 1, detached (%)
Housing units in structures - 1, attached (%)
Housing units in structures - 2 (%)
Housing units in structures - 3 or 4 (%)
Housing units in structures - 5 to 9 (%)
Housing units in structures - 10 to 19 (%)
Housing units in structures - 20 to 49 (%)
Housing units in structures - 50 or more (%)
Housing units in structures - Mobile home (%)
Housing units in structures - Boat, RV, van, etc. (%)
Housing units in structures - Owners - 1, detached (%)
Housing units in structures - Owners - 1, attached (%)
Housing units in structures - Owners - 2 (%)
Housing units in structures - Owners - 3 or 4 (%)
Housing units in structures - Owners - 5 to 9 (%)
Housing units in structures - Owners - 10 to 19 (%)
Housing units in structures - Owners - 20 to 49 (%)
Housing units in structures - Owners - 50 or more (%)
Housing units in structures - Owners - Mobile home (%)
Housing units in structures - Owners - Boat, RV, van, etc. (%)
Housing units in structures - Renters - 1, detached (%)
Housing units in structures - Renters - 1, attached (%)
Housing units in structures - Renters - 2 (%)
Housing units in structures - Renters - 3 or 4 (%)
Housing units in structures - Renters - 5 to 9 (%)
Housing units in structures - Renters - 10 to 19 (%)
Housing units in structures - Renters - 20 to 49 (%)
Housing units in structures - Renters - 50 or more (%)
Housing units in structures - Renters - Mobile home (%)
Housing units in structures - Renters - Boat, RV, van, etc. (%)
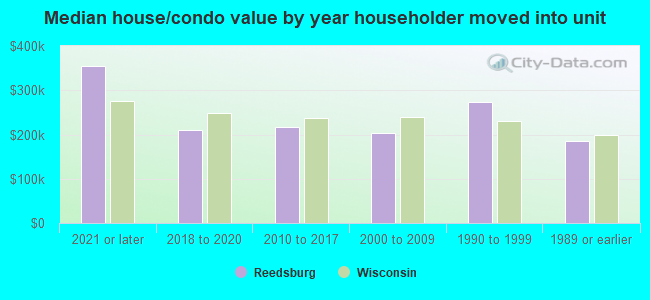
House/condo owner moved in on average (years ago)
Renter moved in on average (years ago)
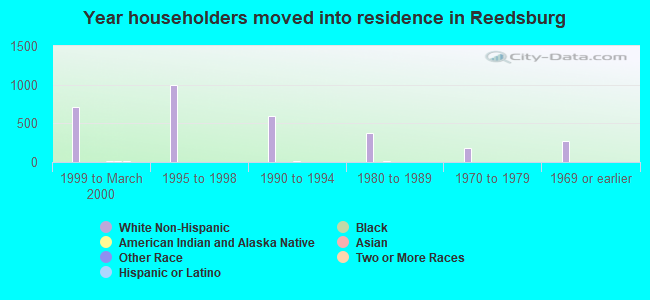
Year householder moved into unit - Moved in 1999 to March 2000 (%)
Year householder moved into unit - Moved in 1999 to March 2000 (%) - White
Year householder moved into unit - Moved in 1999 to March 2000 (%) - Black or African American
Year householder moved into unit - Moved in 1999 to March 2000 (%) - Asian
Year householder moved into unit - Moved in 1999 to March 2000 (%) - Hispanic or Latino
Year householder moved into unit - Moved in 1999 to March 2000 (%) - American Indian and Alaska Native
Year householder moved into unit - Moved in 1999 to March 2000 (%) - Multirace
Year householder moved into unit - Moved in 1999 to March 2000 (%) - Other Race
Year householder moved into unit - Moved in 1995 to 1998 (%)
Year householder moved into unit - Moved in 1995 to 1998 (%) - White
Year householder moved into unit - Moved in 1995 to 1998 (%) - Black or African American
Year householder moved into unit - Moved in 1995 to 1998 (%) - Asian
Year householder moved into unit - Moved in 1995 to 1998 (%) - Hispanic or Latino
Year householder moved into unit - Moved in 1995 to 1998 (%) - American Indian and Alaska Native
Year householder moved into unit - Moved in 1995 to 1998 (%) - Multirace
Year householder moved into unit - Moved in 1995 to 1998 (%) - Other Race
Year householder moved into unit - Moved in 1990 to 1994 (%)
Year householder moved into unit - Moved in 1990 to 1994 (%) - White
Year householder moved into unit - Moved in 1990 to 1994 (%) - Black or African American
Year householder moved into unit - Moved in 1990 to 1994 (%) - Asian
Year householder moved into unit - Moved in 1990 to 1994 (%) - Hispanic or Latino
Year householder moved into unit - Moved in 1990 to 1994 (%) - American Indian and Alaska Native
Year householder moved into unit - Moved in 1990 to 1994 (%) - Multirace
Year householder moved into unit - Moved in 1990 to 1994 (%) - Other Race
Year householder moved into unit - Moved in 1980 to 1989 (%)
Year householder moved into unit - Moved in 1980 to 1989 (%) - White
Year householder moved into unit - Moved in 1980 to 1989 (%) - Black or African American
Year householder moved into unit - Moved in 1980 to 1989 (%) - Asian
Year householder moved into unit - Moved in 1980 to 1989 (%) - Hispanic or Latino
Year householder moved into unit - Moved in 1980 to 1989 (%) - American Indian and Alaska Native
Year householder moved into unit - Moved in 1980 to 1989 (%) - Multirace
Year householder moved into unit - Moved in 1980 to 1989 (%) - Other Race
Year householder moved into unit - Moved in 1970 to 1979 (%)
Year householder moved into unit - Moved in 1970 to 1979 (%) - White
Year householder moved into unit - Moved in 1970 to 1979 (%) - Black or African American
Year householder moved into unit - Moved in 1970 to 1979 (%) - Asian
Year householder moved into unit - Moved in 1970 to 1979 (%) - Hispanic or Latino
Year householder moved into unit - Moved in 1970 to 1979 (%) - American Indian and Alaska Native
Year householder moved into unit - Moved in 1970 to 1979 (%) - Multirace
Year householder moved into unit - Moved in 1970 to 1979 (%) - Other Race
Year householder moved into unit - Moved in 1969 or earlier (%)
Year householder moved into unit - Moved in 1969 or earlier (%) - White
Year householder moved into unit - Moved in 1969 or earlier (%) - Black or African American
Year householder moved into unit - Moved in 1969 or earlier (%) - Asian
Year householder moved into unit - Moved in 1969 or earlier (%) - Hispanic or Latino
Year householder moved into unit - Moved in 1969 or earlier (%) - American Indian and Alaska Native
Year householder moved into unit - Moved in 1969 or earlier (%) - Multirace
Year householder moved into unit - Moved in 1969 or earlier (%) - Other Race
Housing units lacking complete plumbing facilities (%)
Housing units lacking complete kitchen facilities (%)
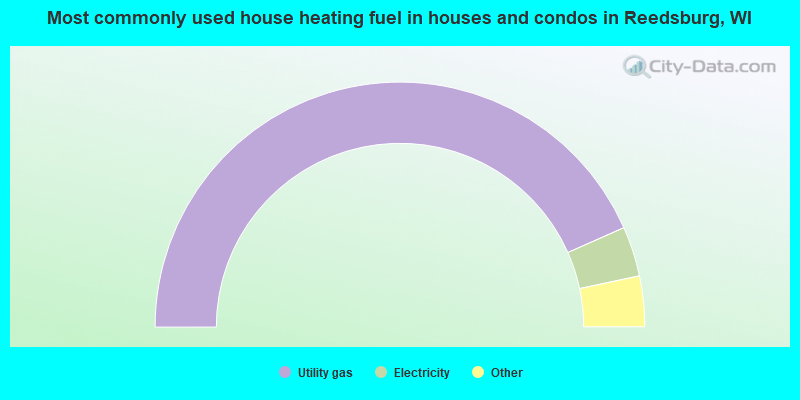
House heating fuel used in houses and condos - Utility gas (%)
House heating fuel used in houses and condos - Bottled, tank, or LP gas (%)
House heating fuel used in houses and condos - Electricity (%)
House heating fuel used in houses and condos - Fuel oil, kerosene, etc. (%)
House heating fuel used in houses and condos - Coal or coke (%)
House heating fuel used in houses and condos - Wood (%)
House heating fuel used in houses and condos - Solar energy (%)
House heating fuel used in houses and condos - Other fuel (%)
House heating fuel used in houses and condos - No fuel used (%)
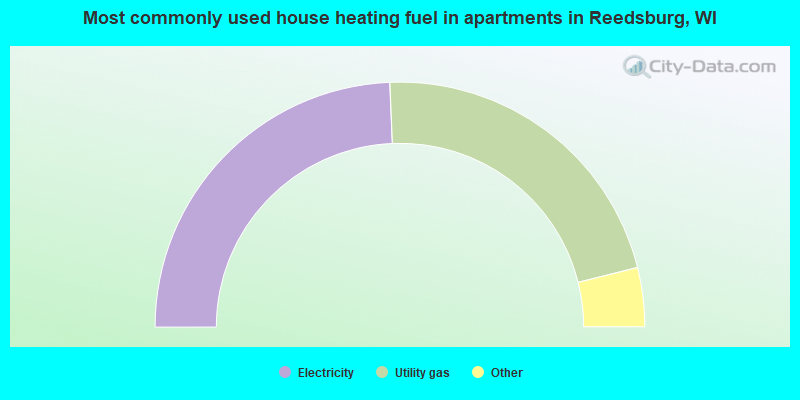
House heating fuel used in apartments - Utility gas (%)
House heating fuel used in apartments - Bottled, tank, or LP gas (%)
House heating fuel used in apartments - Electricity (%)
House heating fuel used in apartments - Fuel oil, kerosene, etc. (%)
House heating fuel used in apartments - Coal or coke (%)
House heating fuel used in apartments - Wood (%)
House heating fuel used in apartments - Solar energy (%)
House heating fuel used in apartments - Other fuel (%)
House heating fuel used in apartments - No fuel used (%)
Latest news about housing in Reedsburg, WI collected exclusively by city-data.com from local newspapers, TV, and radio stations
Median year house/condo built: 1985Median year apartment built: 2004Household type by relationship:
Households: 10,036
Male householders: 1,592 (339 living alone ), Female householders: 2,373 (726 living alone )1,901 spouses (1,863 opposite-sex spouses ), 283 unmarried partners , (275 opposite-sex unmarried partners ), 3,095 children (2,983 natural , 53 adopted , 59 stepchildren ), 101 grandchildren , 39 brothers or sisters , 90 parents , 2 foster children , 160 other relatives , 232 non-relatives In group quarters: 165
Size of family households: 1,299 2-persons , 563 3-persons , 586 4-persons , 248 5-persons , 38 6-persons , 26 7-or-more-persons .
Size of nonfamily households: 1,142 1-person , 193 2-persons , 13 3-persons .
1,577 married couples with children. single-parent households (138 men , 791 women ).
93.3% of residents of Reedsburg speak English at home. of residents speak Spanish at home (54% speak English very well , 17% speak English well , 9% speak English not well , 20% don't speak English at all ).of residents speak other Indo-European language at home (100% speak English very well ).
Foreign born population: 385 (3.8%)of them are naturalized citizens )
Median number of rooms in houses and condos:
Median number of rooms in apartments
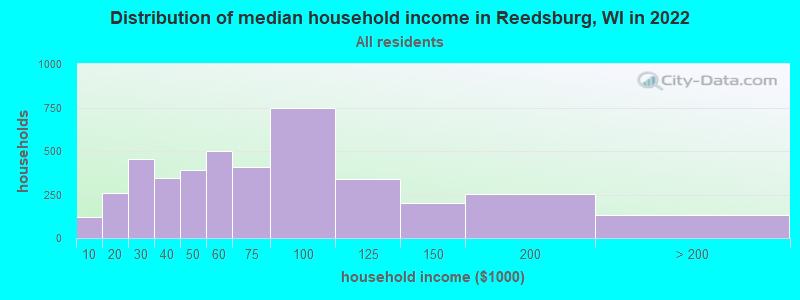
Reedsburg, WI household income distribution 121 Less than $10,000257 $10,000 to $19,999455 $20,000 to $29,999346 $30,000 to $39,999390 $40,000 to $49,999499 $50,000 to $59,999409 $60,000 to $74,999745 $75,000 to $99,999339 $100,000 to $124,999203 $125,000 to $149,999252 $150,000 to $199,999130 $200,000 or more
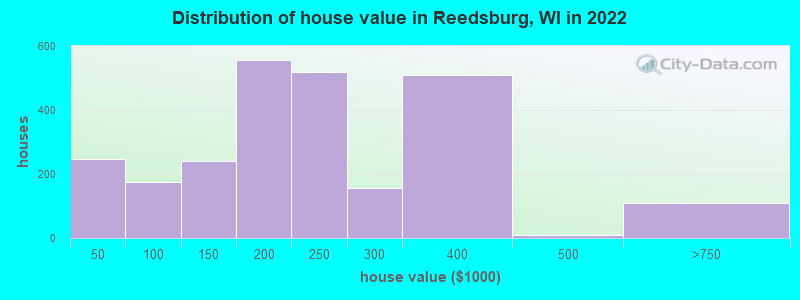
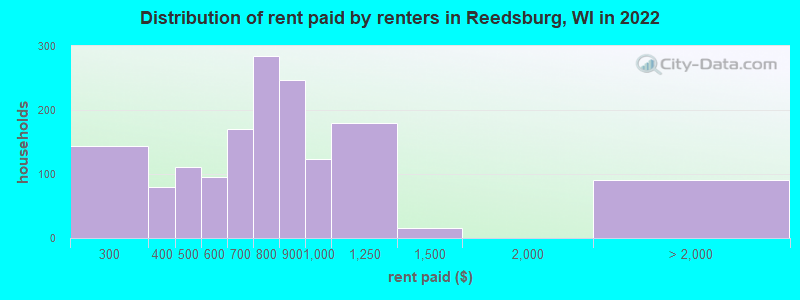
Home value of owner - occupied houses in 2022 in Reedsburg, WI 33 Less than $10,00051 $10,000 to $14,99926 $15,000 to $19,99925 $20,000 to $24,99944 $25,000 to $29,99936 $30,000 to $34,99929 $35,000 to $39,99910 $50,000 to $59,99943 $60,000 to $69,99932 $70,000 to $79,99976 $80,000 to $89,99912 $90,000 to $99,99981 $100,000 to $124,999159 $125,000 to $149,999348 $150,000 to $174,999207 $175,000 to $199,999519 $200,000 to $249,999155 $250,000 to $299,999508 $300,000 to $399,99910 $400,000 to $499,999108 $500,000 to $749,999Rent paid by renters in 2022 in Reedsburg, WI 131 $200 to $24912 $250 to $29947 $300 to $34931 $350 to $39931 $400 to $44979 $450 to $49984 $500 to $54910 $550 to $59956 $600 to $649114 $650 to $69989 $700 to $749193 $750 to $799246 $800 to $899122 $900 to $999180 $1,000 to $1,24915 $1,250 to $1,49923 $3,500 or more67 No cash rent
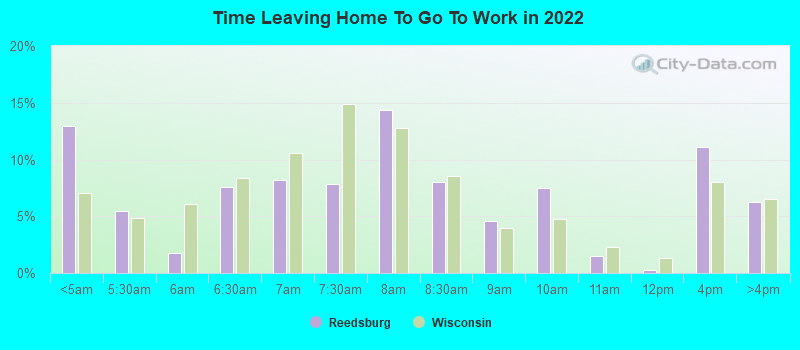
Percentage of workers working in this county: 86.6%Number of people working at home: 263 (5.5% of all workers )
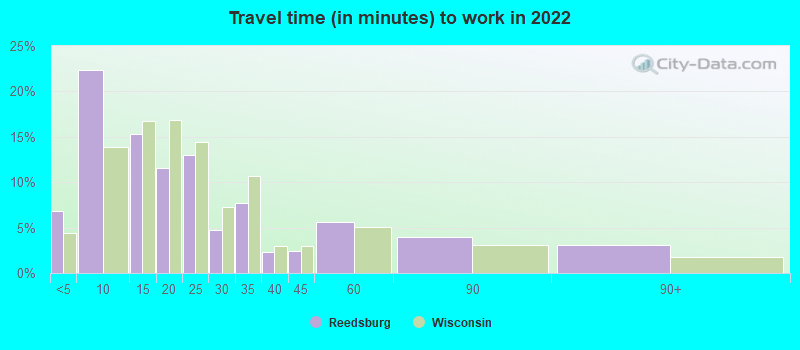
Travel time to work (commute)
Less than 5 minutes: 3505 to 9 minutes: 1,20910 to 14 minutes: 65115 to 19 minutes: 53320 to 24 minutes: 25225 to 29 minutes: 27630 to 34 minutes: 14735 to 39 minutes: 7040 to 44 minutes: 11345 to 59 minutes: 19260 to 89 minutes: 32490 or more minutes: 99
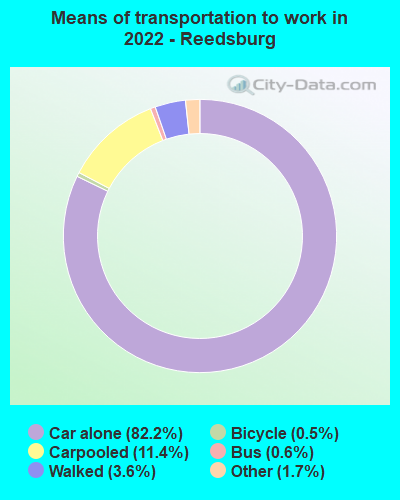
Means of transportation to work:
Drove a car alone: 5,226 (76.0%)Carpooled: 811 (11.8%)Bus : 45 (0.7%)Taxi: 164 (2.4%)Bicycle: 39 (0.6%)Walked: 201 (2.9%)Worked at home: 263 (3.8%)
Unemployment by race in 2022
Unemployment rate for White non-Hispanic residents 1.6% Males0.5% FemalesUnemployment rate for two or more race residents 19.8% MalesUnemployment rate for Hispanic or Latino residents 18.4% Males
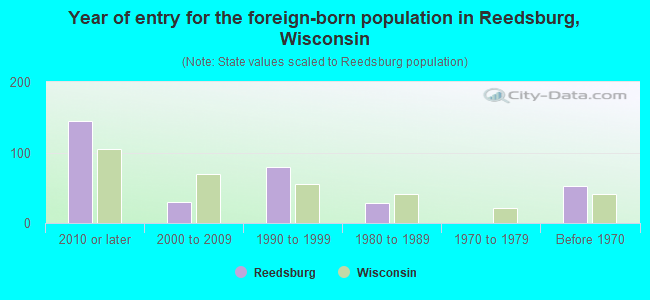
Year of entry for the foreign-born population in Reedsburg, Wisconsin
144 2010 or later 30 2000 to 2009 79 1990 to 1999 28 1980 to 1989 0 1970 to 1979 52 Before 1970
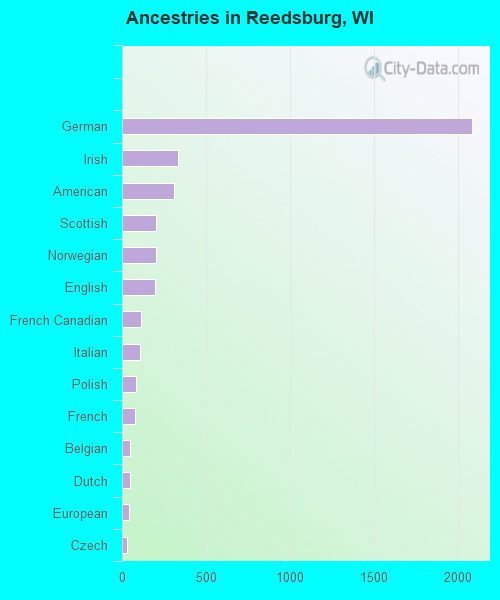
First ancestries reported:
German: 2,083 (42.6%)
Irish: 331 (6.8%)
American: 308 (6.3%)
Scottish: 204 (4.2%)
Norwegian: 203 (4.1%)
English: 195 (4.0%)
French Canadian: 116 (2.4%)
Italian: 107 (2.2%)
Polish: 86 (1.8%)
French: 77 (1.6%)
Belgian: 46 (0.9%)
Dutch: 45 (0.9%)
European: 39 (0.8%)
Czech: 32 (0.7%)
Scotch-Irish: 15 (0.3%)
Slovak: 15 (0.3%)
Danish: 14 (0.3%)
Jamaican: 11 (0.2%)
Swedish: 10 (0.2%)
Czechoslovakian: 6 (0.1%)
Northern European: 6 (0.1%)
Swiss: 6 (0.1%)
Canadian: 5 (0.1%)
Scandinavian: 4 (0.08%)
British: 2 (0.04%) Most common places of birth for foreign-born residents (%): Nicaragua Reedsburg:
74.4% (221)Wisconsin:
1.1% (3,231)
Mexico Reedsburg:
33.0% (98)Wisconsin:
29.5% (87,182)
Peru Reedsburg:
11.8% (35)Wisconsin:
0.7% (1,960)
England Reedsburg:
8.8% (26)Wisconsin:
0.8% (2,478)
Czechoslovakia (includes Czech Republic and Slovakia) Reedsburg:
6.1% (18)Wisconsin:
0.3% (953)
Canada Reedsburg:
5.4% (16)Wisconsin:
2.3% (6,747)
Germany Reedsburg:
4.7% (14)Wisconsin:
3.0% (8,773)
Place of birth for U.S.-born residents:
This state: 7,700Other state: 1,703Northeast: 146Midwest: 1,013South: 217West: 351 82.9% of Reedsburg residents lived in the same house 1 years ago.
Out of people who lived in different houses, 34.7% lived in this county.
Out of people who lived in different counties, 90.3% lived in Wisconsin.
Reedsburg:
82.9%State average:
87.7%
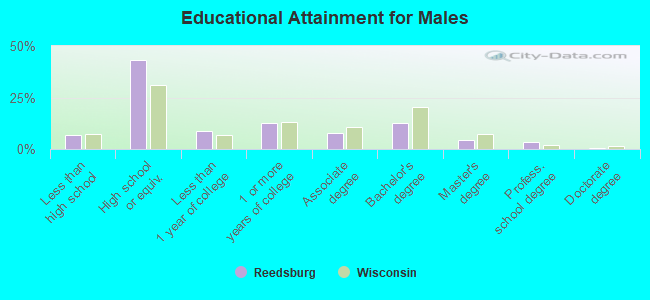
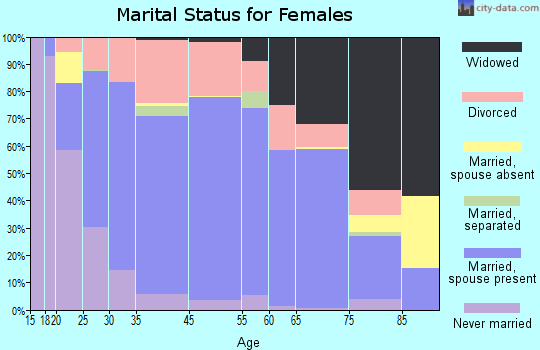
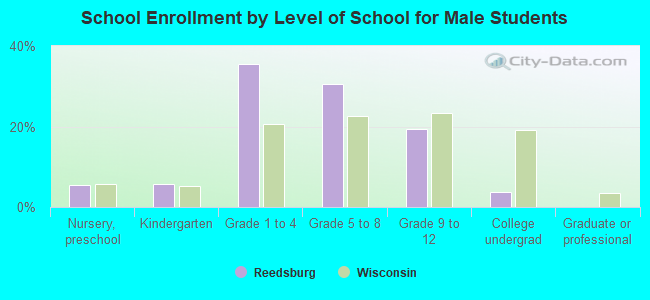
Education attainment for males 25 years and older:
No schooling: 6Nursery to 4th grade: 05th and 6th grade: 237th and 8th grade: 539th grade: 6110th grade: 4111th grade: 1612th grade, no diploma: 9High school graduate (or equivalency): 1,289Less than 1 year of college: 268Some college more than 1 year, no degree: 370Associate degree: 228Bachelor's degree: 372Master's degree: 133Professional school degree: 98Doctorate degree: 20
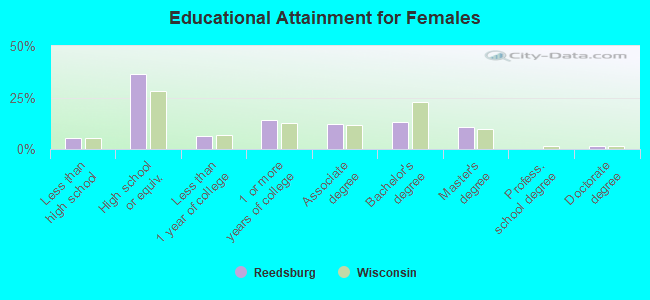
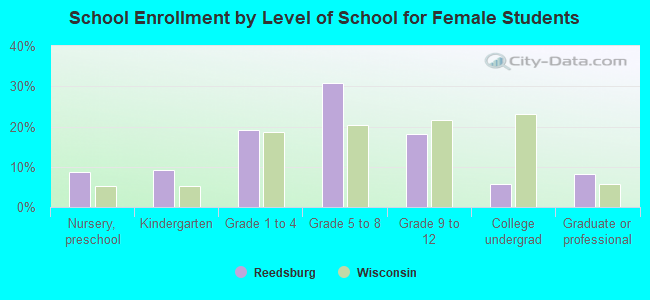
Education attainment for females 25 years and older:
No schooling: 29Nursery to 4th grade: 05th and 6th grade: 217th and 8th grade: 39th grade: 5210th grade: 511th grade: 1712th grade, no diploma: 70High school graduate (or equivalency): 1,349Less than 1 year of college: 240Some college more than 1 year, no degree: 527Associate degree: 442Bachelor's degree: 488Master's degree: 395Professional school degree: 0Doctorate degree: 61
Housing units in structures:
One, detached: 2,462One, attached: 184Two: 3663 or 4: 1105 to 9: 15310 to 19: 27620 to 49: 19550 or more: 64Mobile homes: 302Median worth of mobile homes: $36,133
Housing units lacking complete plumbing facilities in 2022: 1.2%Housing units lacking complete kitchen facilities in 2022: 1.2%House/condo owner moved in on average 10 years ago
Renter moved in on average 2 years ago
Private vs. public school enrollment:
Students in private schools in grades 1 to 8 (elementary and middle school): 192 Here:
14.7%Wisconsin:
16.7%
Students in private schools in grades 9 to 12 (high school): 5 Students in private undergraduate colleges: 38 Here:
30.9%Wisconsin:
17.5%