Rochester, NH (New Hampshire) Houses and Residents
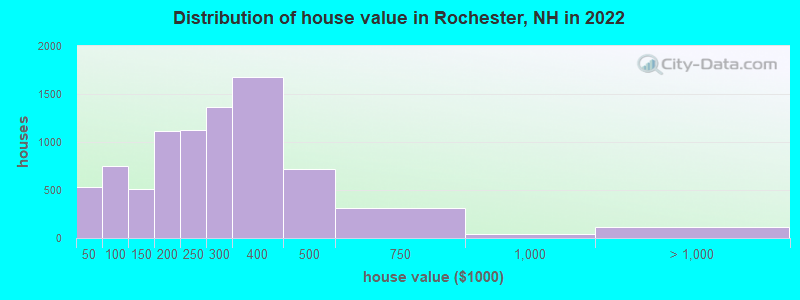
Estimated median house or condo value in 2022: $275,883 (it was $89,300 in 2000 )
Rochester:
$275,883New Hampshire:
$384,700
Lower value quartile - upper value quartile: $181,533 - $362,921Mean price in 2022: Detached houses: $323,274 Here:
$323,274State:
$491,479
Townhouses or other attached units: $255,528 Here:
$255,528State:
$361,001
In 2-unit structures: $275,734 Here:
$275,734State:
$368,847
In 3-to-4-unit structures: $225,257 Here:
$225,257State:
$575,942
In 5-or-more-unit structures: $277,587 Here:
$277,587State:
$274,068
Mobile homes: $123,954 Here:
$123,954State:
$124,817
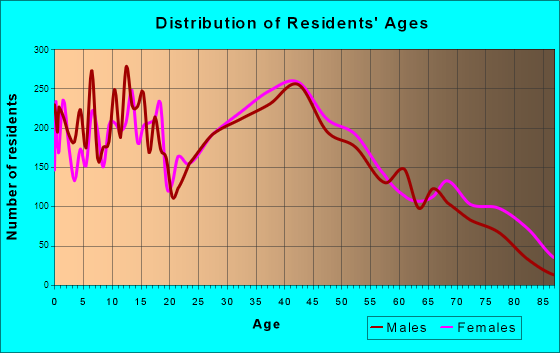
Total population: 29,991 (Urban population: 22,614, Rural population: 5,847 (89 farm, 5,758 nonfarm ))
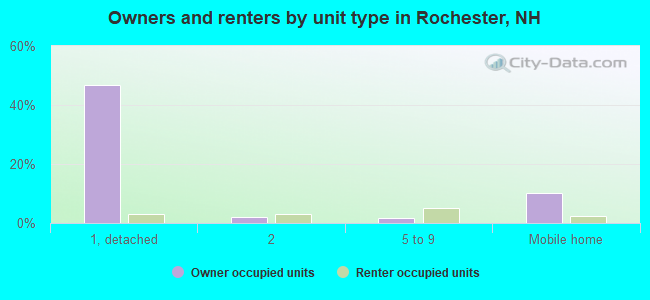
Houses: 14,546 (13,766 occupied: 9,061 owner occupied, 4,675 renter occupied )
% of renters here:
34%State:
28%
Housing density: 322 houses/condos per square mile
Median price asked for vacant for-sale houses and condos in 2022: $79,904.
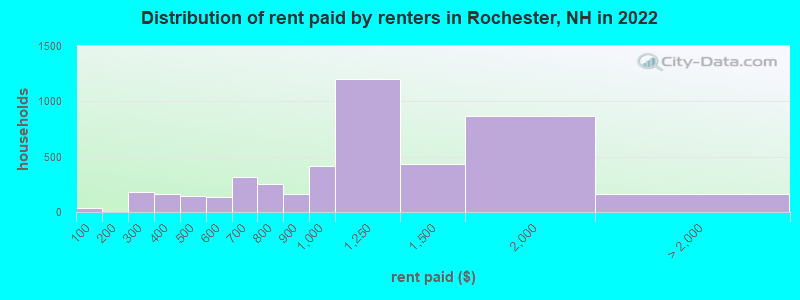
Median contract rent in 2022: $1,166 (lower quartile is $768, upper quartile is $1,465)
Median rent asked for vacant for-rent units in 2022: $799
Median gross rent in Rochester, NH in 2022: $1,258
Housing units in Rochester with a mortgage: 5,100 (364 second mortgage, 0 home equity loan, 308 both second mortgage and home equity loan )Houses without a mortgage: 147
Median household income for houses/condos with a mortgage: $105,201
Median household income for apartments without a mortgage: $61,560
Median monthly housing costs: $1,230
Data:
Median house or condo value ($)
Median house or condo value ($ change since 2000)
Median house or condo value ($) - White
Median house or condo value ($) - Black or African American
Median house or condo value ($) - Asian
Median house or condo value ($) - Hispanic or Latino
Median house or condo value ($) - American Indian and Alaska Native
Median house or condo value ($) - Multirace
Median house or condo value ($) - Other Race
Median price asked for mobile homes ($)
Household density (households per square mile)
Mean house or condo value by units in structure - 1, detached ($)
Mean house or condo value by units in structure - 1, attached ($)
Mean house or condo value by units in structure - 2 ($)
Mean house or condo value by units in structure by units in structure - 3 or 4 ($)
Mean house or condo value by units in structure - 5 or more ($)
Mean house or condo value by units in structure - Boat, RV, van, etc. ($)
Mean house or condo value by units in structure - Mobile home ($)
Median contract rent ($)
Median contract rent - Lower quartile ($)
Median contract rent - Upper quartile ($)
Median gross rent ($)
Urban houses (%)
Rural houses (%)
Houses occupied (%)
Houses occupied (% change since 2000)
Houses owner occupied (%)
Houses owner occupied (% change since 2000)
Houses renter occupied (%)
Houses renter occupied (% change since 2000)
Vacant housing units - For rent (%)
Vacant housing units - For rent (% change since 2000)
Vacant housing units - For sale only (%)
Vacant housing units - For sale only (% change since 2000)
Vacant housing units - Rented or sold, not occupied (%)
Vacant housing units - Rented or sold, not occupied (% change since 2000)
Vacant housing units - For seasonal, recreational, or occasional use (%)
Vacant housing units - For seasonal, recreational, or occasional use (% change since 2000)
Vacant housing units - For migrant workers (%)
Vacant housing units - For migrant workers (% change since 2000)
Vacant housing units - Other vacant (%)
Vacant housing units - Other vacant (% change since 2000)
Median monthly housing costs ($)
Median household income for houses/condos with a mortgage ($)
Median household income for houses/condos without a mortgage ($)
Median household income ($)
Median household income ($) - White
Median household income ($) - Black or African American
Median household income ($) - Asian
Median household income ($) - Hispanic or Latino
Median household income ($) - American Indian and Alaska Native
Median household income ($) - Multirace
Median household income ($) - Other Race
Mortgage status - with mortgage (%)
Mortgage status - with second mortgage (%)
Mortgage status - with home equity loan (%)
Mortgage status - with both second mortgage and home equity loan (%)
Mortgage status - without a mortgage (%)
Median year house/condo built
Median year apartment built
Household type by relationship - Male householder living alone (%)
Household type by relationship - Male householder not living alone (%)
Household type by relationship - Female householder living alone (%)
Household type by relationship - Female householder not living alone (%)
Household type by relationship - Opposite-Sex spouse (%)
Household type by relationship - Same-Sex spouse (%)
Household type by relationship - Opposite-Sex unmarried partner (%)
Household type by relationship - Same-Sex unmarried partner (%)
Household type by relationship - In group quarters (%)
Size of family households - 2-person household (%)
Size of family households - 3-person household (%)
Size of family households - 4-person household (%)
Size of family households - 5-person household (%)
Size of family households - 6-person household (%)
Size of family households - 7-or-more-person household (%)
Size of nonfamily households - 1-person household (%)
Size of nonfamily households - 2-person household (%)
Size of nonfamily households - 3-person household (%)
Size of nonfamily households - 4-person household (%)
Size of nonfamily households - 5-person household (%)
Size of nonfamily households - 6-person household (%)
Size of nonfamily households - 7-or-moreperson household (%)
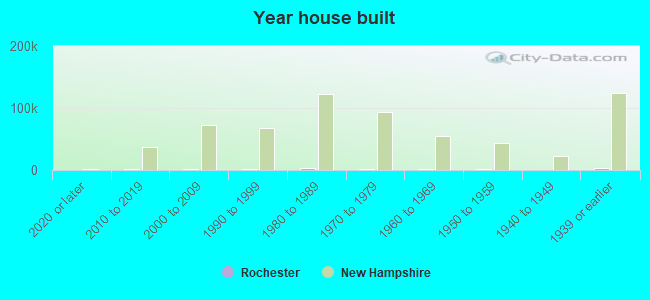
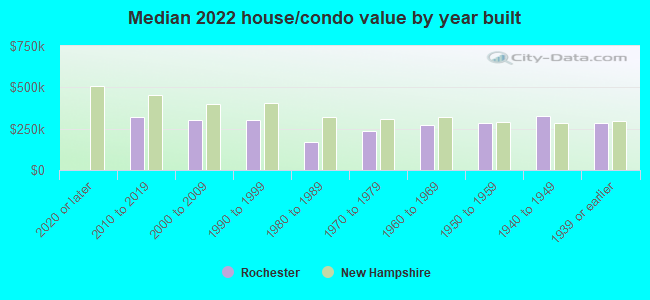
Year house built - Built 2010 or later (%)
Year house built - Built 2000 to 2009 (%)
Year house built - Built 1990 to 1999 (%)
Year house built - Built 1980 to 1989 (%)
Year house built - Built 1970 to 1979 (%)
Year house built - Built 1960 to 1969 (%)
Year house built - Built 1950 to 1959 (%)
Year house built - Built 1940 to 1949 (%)
Year house built - Built 1939 or earlier (%)
Median number of rooms in houses and condos
Median number of rooms in apartments
Median number of bedrooms in owner occupied houses
Mean number of bedrooms in owner occupied houses
Median number of bedrooms in renter occupied houses
Mean number of bedrooms in renter occupied houses
Median number of vehichles in owner occupied houses
Mean number of vehichles in owner occupied houses
Median number of vehichles in renter occupied houses
Mean number of vehichles in renter occupied houses
Rooms in owner-occupied houses - 1 room (%)
Rooms in owner-occupied houses - 2 rooms (%)
Rooms in owner-occupied houses - 3 rooms (%)
Rooms in owner-occupied houses - 4 rooms (%)
Rooms in owner-occupied houses - 5 rooms (%)
Rooms in owner-occupied houses - 6 rooms (%)
Rooms in owner-occupied houses - 7 rooms (%)
Rooms in owner-occupied houses - 8 rooms (%)
Rooms in owner-occupied houses - 9+ rooms (%)
Rooms in renter-occupied houses - 1 room (%)
Rooms in renter-occupied houses - 2 rooms (%)
Rooms in renter-occupied houses - 3 rooms (%)
Rooms in renter-occupied houses - 4 rooms (%)
Rooms in renter-occupied houses - 5 rooms (%)
Rooms in renter-occupied houses - 6 rooms (%)
Rooms in renter-occupied houses - 7 rooms (%)
Rooms in renter-occupied houses - 8 rooms (%)
Rooms in renter-occupied houses - 9+ rooms (%)
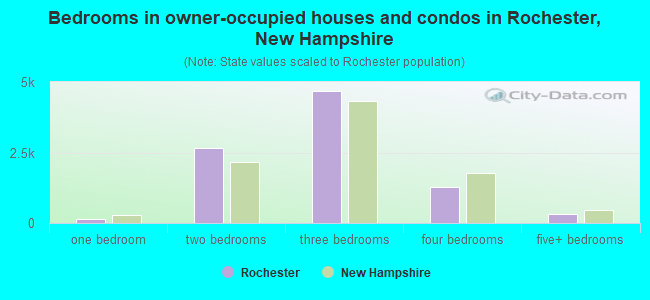
Bedrooms in owner-occupied houses - no bedrooms (%)
Bedrooms in owner-occupied houses - 1 bedroom (%)
Bedrooms in owner-occupied houses - 2 bedrooms (%)
Bedrooms in owner-occupied houses - 3 bedrooms (%)
Bedrooms in owner-occupied houses - 4 bedrooms (%)
Bedrooms in owner-occupied houses - 5+ bedrooms (%)
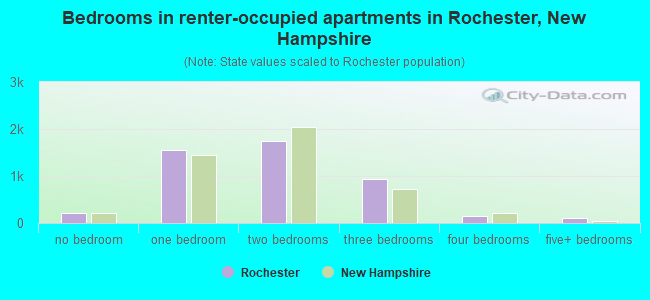
Bedrooms in renter-occupied houses - no bedrooms (%)
Bedrooms in renter-occupied houses - 1 bedroom (%)
Bedrooms in renter-occupied houses - 2 bedrooms (%)
Bedrooms in renter-occupied houses - 3 bedrooms (%)
Bedrooms in renter-occupied houses - 4 bedrooms (%)
Bedrooms in renter-occupied houses - 5+ bedrooms (%)
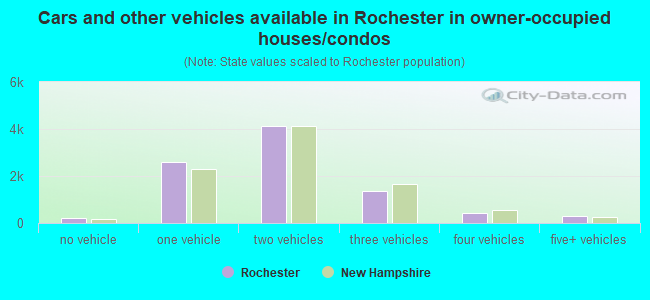
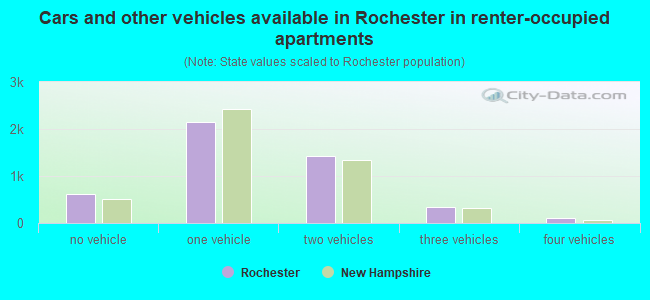
Vehicles available in owner-occupied houses - no vehicle available (%)
Vehicles available in owner-occupied houses - 1 vehicle available(%)
Vehicles available in owner-occupied houses - 2 Vehicles available (%)
Vehicles available in owner-occupied houses - 3 Vehicles available (%)
Vehicles available in owner-occupied houses - 4 Vehicles available (%)
Vehicles available in owner-occupied houses - 5+ Vehicles available (%)
Vehicles available in renter-occupied houses - no vehicle available (%)
Vehicles available in renter-occupied houses - 1 vehicle available (%)
Vehicles available in renter-occupied houses - 2 Vehicles available (%)
Vehicles available in renter-occupied houses - 3 Vehicles available (%)
Vehicles available in renter-occupied houses - 4 Vehicles available (%)
Vehicles available in renter-occupied houses - 5+ Vehicles available (%)
Housing units in structures - 1, detached (%)
Housing units in structures - 1, attached (%)
Housing units in structures - 2 (%)
Housing units in structures - 3 or 4 (%)
Housing units in structures - 5 to 9 (%)
Housing units in structures - 10 to 19 (%)
Housing units in structures - 20 to 49 (%)
Housing units in structures - 50 or more (%)
Housing units in structures - Mobile home (%)
Housing units in structures - Boat, RV, van, etc. (%)
Housing units in structures - Owners - 1, detached (%)
Housing units in structures - Owners - 1, attached (%)
Housing units in structures - Owners - 2 (%)
Housing units in structures - Owners - 3 or 4 (%)
Housing units in structures - Owners - 5 to 9 (%)
Housing units in structures - Owners - 10 to 19 (%)
Housing units in structures - Owners - 20 to 49 (%)
Housing units in structures - Owners - 50 or more (%)
Housing units in structures - Owners - Mobile home (%)
Housing units in structures - Owners - Boat, RV, van, etc. (%)
Housing units in structures - Renters - 1, detached (%)
Housing units in structures - Renters - 1, attached (%)
Housing units in structures - Renters - 2 (%)
Housing units in structures - Renters - 3 or 4 (%)
Housing units in structures - Renters - 5 to 9 (%)
Housing units in structures - Renters - 10 to 19 (%)
Housing units in structures - Renters - 20 to 49 (%)
Housing units in structures - Renters - 50 or more (%)
Housing units in structures - Renters - Mobile home (%)
Housing units in structures - Renters - Boat, RV, van, etc. (%)
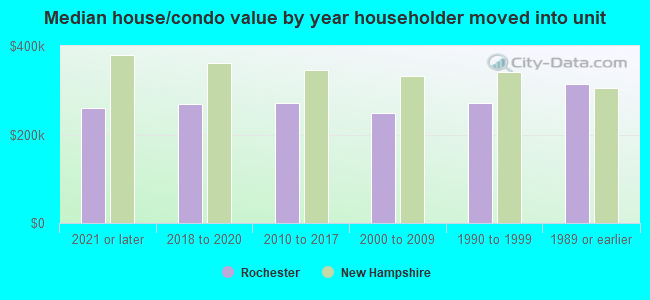
House/condo owner moved in on average (years ago)
Renter moved in on average (years ago)
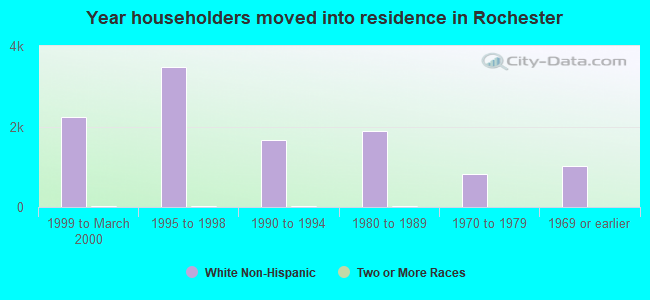
Year householder moved into unit - Moved in 1999 to March 2000 (%)
Year householder moved into unit - Moved in 1999 to March 2000 (%) - White
Year householder moved into unit - Moved in 1999 to March 2000 (%) - Black or African American
Year householder moved into unit - Moved in 1999 to March 2000 (%) - Asian
Year householder moved into unit - Moved in 1999 to March 2000 (%) - Hispanic or Latino
Year householder moved into unit - Moved in 1999 to March 2000 (%) - American Indian and Alaska Native
Year householder moved into unit - Moved in 1999 to March 2000 (%) - Multirace
Year householder moved into unit - Moved in 1999 to March 2000 (%) - Other Race
Year householder moved into unit - Moved in 1995 to 1998 (%)
Year householder moved into unit - Moved in 1995 to 1998 (%) - White
Year householder moved into unit - Moved in 1995 to 1998 (%) - Black or African American
Year householder moved into unit - Moved in 1995 to 1998 (%) - Asian
Year householder moved into unit - Moved in 1995 to 1998 (%) - Hispanic or Latino
Year householder moved into unit - Moved in 1995 to 1998 (%) - American Indian and Alaska Native
Year householder moved into unit - Moved in 1995 to 1998 (%) - Multirace
Year householder moved into unit - Moved in 1995 to 1998 (%) - Other Race
Year householder moved into unit - Moved in 1990 to 1994 (%)
Year householder moved into unit - Moved in 1990 to 1994 (%) - White
Year householder moved into unit - Moved in 1990 to 1994 (%) - Black or African American
Year householder moved into unit - Moved in 1990 to 1994 (%) - Asian
Year householder moved into unit - Moved in 1990 to 1994 (%) - Hispanic or Latino
Year householder moved into unit - Moved in 1990 to 1994 (%) - American Indian and Alaska Native
Year householder moved into unit - Moved in 1990 to 1994 (%) - Multirace
Year householder moved into unit - Moved in 1990 to 1994 (%) - Other Race
Year householder moved into unit - Moved in 1980 to 1989 (%)
Year householder moved into unit - Moved in 1980 to 1989 (%) - White
Year householder moved into unit - Moved in 1980 to 1989 (%) - Black or African American
Year householder moved into unit - Moved in 1980 to 1989 (%) - Asian
Year householder moved into unit - Moved in 1980 to 1989 (%) - Hispanic or Latino
Year householder moved into unit - Moved in 1980 to 1989 (%) - American Indian and Alaska Native
Year householder moved into unit - Moved in 1980 to 1989 (%) - Multirace
Year householder moved into unit - Moved in 1980 to 1989 (%) - Other Race
Year householder moved into unit - Moved in 1970 to 1979 (%)
Year householder moved into unit - Moved in 1970 to 1979 (%) - White
Year householder moved into unit - Moved in 1970 to 1979 (%) - Black or African American
Year householder moved into unit - Moved in 1970 to 1979 (%) - Asian
Year householder moved into unit - Moved in 1970 to 1979 (%) - Hispanic or Latino
Year householder moved into unit - Moved in 1970 to 1979 (%) - American Indian and Alaska Native
Year householder moved into unit - Moved in 1970 to 1979 (%) - Multirace
Year householder moved into unit - Moved in 1970 to 1979 (%) - Other Race
Year householder moved into unit - Moved in 1969 or earlier (%)
Year householder moved into unit - Moved in 1969 or earlier (%) - White
Year householder moved into unit - Moved in 1969 or earlier (%) - Black or African American
Year householder moved into unit - Moved in 1969 or earlier (%) - Asian
Year householder moved into unit - Moved in 1969 or earlier (%) - Hispanic or Latino
Year householder moved into unit - Moved in 1969 or earlier (%) - American Indian and Alaska Native
Year householder moved into unit - Moved in 1969 or earlier (%) - Multirace
Year householder moved into unit - Moved in 1969 or earlier (%) - Other Race
Housing units lacking complete plumbing facilities (%)
Housing units lacking complete kitchen facilities (%)
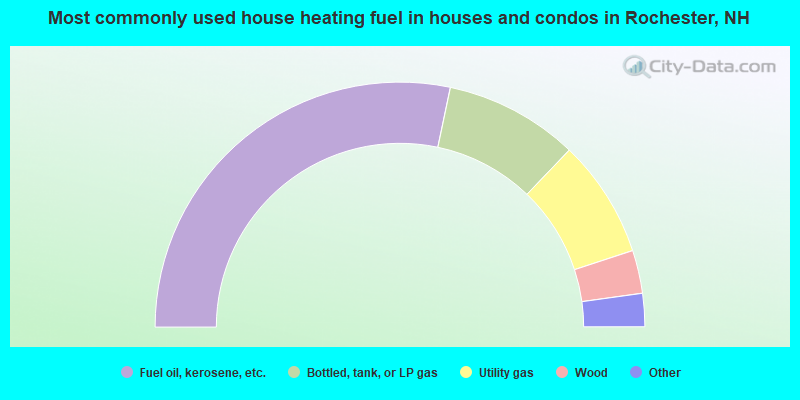
House heating fuel used in houses and condos - Utility gas (%)
House heating fuel used in houses and condos - Bottled, tank, or LP gas (%)
House heating fuel used in houses and condos - Electricity (%)
House heating fuel used in houses and condos - Fuel oil, kerosene, etc. (%)
House heating fuel used in houses and condos - Coal or coke (%)
House heating fuel used in houses and condos - Wood (%)
House heating fuel used in houses and condos - Solar energy (%)
House heating fuel used in houses and condos - Other fuel (%)
House heating fuel used in houses and condos - No fuel used (%)
House heating fuel used in apartments - Utility gas (%)
House heating fuel used in apartments - Bottled, tank, or LP gas (%)
House heating fuel used in apartments - Electricity (%)
House heating fuel used in apartments - Fuel oil, kerosene, etc. (%)
House heating fuel used in apartments - Coal or coke (%)
House heating fuel used in apartments - Wood (%)
House heating fuel used in apartments - Solar energy (%)
House heating fuel used in apartments - Other fuel (%)
House heating fuel used in apartments - No fuel used (%)
Latest news about housing in Rochester, NH collected exclusively by city-data.com from local newspapers, TV, and radio stations
Median year house/condo built: 1979Median year apartment built: 1984Household type by relationship:
Households: 32,898
Male householders: 6,541 (1,730 living alone ), Female householders: 7,135 (2,372 living alone )6,200 spouses (6,080 opposite-sex spouses ), 1,335 unmarried partners , (1,318 opposite-sex unmarried partners ), 8,174 children (7,565 natural , 165 adopted , 443 stepchildren ), 489 grandchildren , 257 brothers or sisters , 422 parents , 333 foster children , 416 other relatives , 1,354 non-relatives In group quarters: 237
Size of family households: 4,167 2-persons , 1,622 3-persons , 1,111 4-persons , 718 5-persons , 298 6-persons , 124 7-or-more-persons .
Size of nonfamily households: 4,450 1-person , 1,152 2-persons , 261 3-persons , 5 4-persons , 21 6-persons .
3,814 married couples with children. single-parent households (226 men , 1,450 women ).
96.4% of residents of Rochester speak English at home. of residents speak Spanish at home (93% speak English very well , 3% speak English well , 4% speak English not well ).of residents speak other Indo-European language at home (78% speak English very well , 19% speak English well , 3% don't speak English at all ).of residents speak Asian or Pacific Island language at home (32% speak English very well , 60% speak English well , 8% speak English not well ).of residents speak other language at home (100% speak English well ).
Foreign born population: 1,081 (3.3%)of them are naturalized citizens )
Median number of rooms in houses and condos:
Median number of rooms in apartments
Owner-occupied Renter-occupied
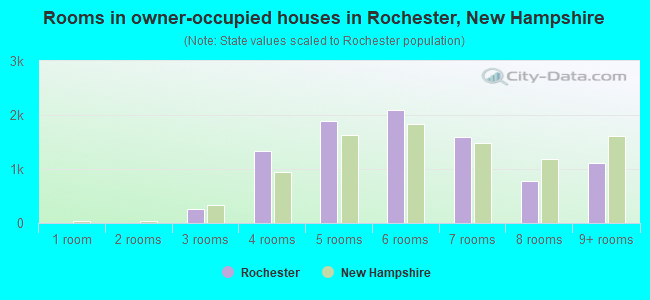
Rooms in owner-occupied houses in Rochester, New Hampshire
0 1 room 9 2 rooms 258 3 rooms 1,342 4 rooms 1,896 5 rooms 2,087 6 rooms 1,585 7 rooms 778 8 rooms 1,108 9+ rooms
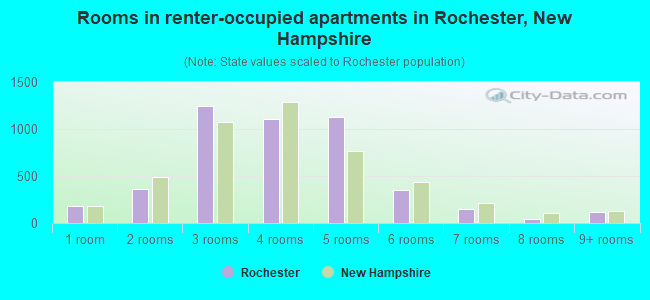
Rooms in renter-occupied apartments in Rochester, New Hampshire
185 1 room 364 2 rooms 1,240 3 rooms 1,105 4 rooms 1,126 5 rooms 351 6 rooms 151 7 rooms 42 8 rooms 113 9+ rooms
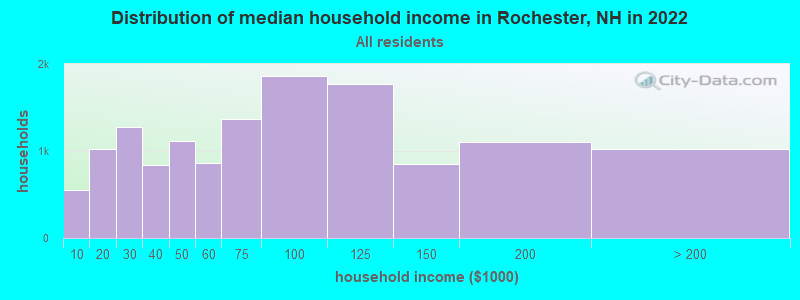
Rochester, NH household income distribution 551 Less than $10,0001,028 $10,000 to $19,9991,272 $20,000 to $29,999841 $30,000 to $39,9991,113 $40,000 to $49,999864 $50,000 to $59,9991,373 $60,000 to $74,9991,858 $75,000 to $99,9991,774 $100,000 to $124,999845 $125,000 to $149,9991,104 $150,000 to $199,9991,025 $200,000 or more
Home value of owner - occupied houses in 2022 in Rochester, NH 46 Less than $10,00015 $10,000 to $14,9991 $15,000 to $19,999126 $20,000 to $24,99992 $25,000 to $29,99980 $30,000 to $34,99933 $35,000 to $39,999136 $40,000 to $49,999182 $50,000 to $59,99998 $60,000 to $69,999135 $70,000 to $79,999118 $80,000 to $89,99973 $90,000 to $99,999230 $100,000 to $124,999277 $125,000 to $149,999749 $150,000 to $174,999369 $175,000 to $199,9991,122 $200,000 to $249,9991,367 $250,000 to $299,9991,681 $300,000 to $399,999715 $400,000 to $499,999312 $500,000 to $749,99941 $750,000 to $999,99938 $1,000,000 to $1,499,99911 $1,500,000 to $1,999,99960 $2,000,000 or moreRent paid by renters in 2022 in Rochester, NH 40 Less than $10093 $200 to $24988 $250 to $29939 $300 to $349120 $350 to $39971 $400 to $44969 $450 to $499111 $500 to $54923 $550 to $59937 $600 to $649280 $650 to $69940 $700 to $749210 $750 to $799165 $800 to $899419 $900 to $9991,199 $1,000 to $1,249435 $1,250 to $1,499865 $1,500 to $1,99980 $2,000 to $2,49910 $2,500 to $2,99970 No cash rent
Percentage of workers working in this county: 61.1%Number of people working at home: 2,455 (14.3% of all workers )
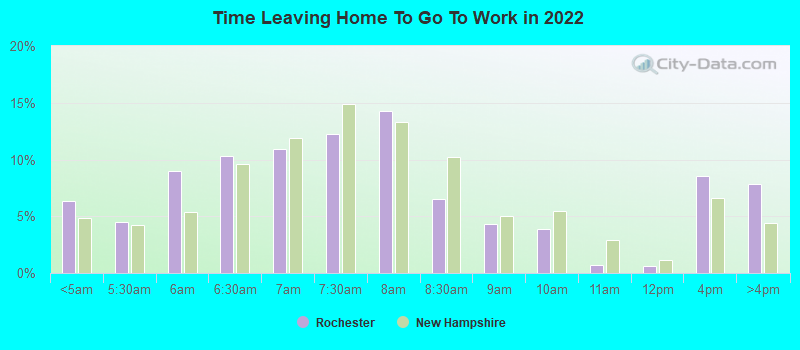
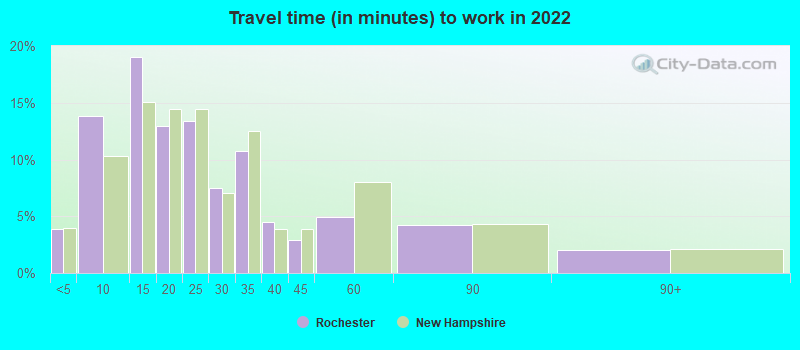
Travel time to work (commute)
Less than 5 minutes: 4315 to 9 minutes: 1,65910 to 14 minutes: 1,88415 to 19 minutes: 1,93420 to 24 minutes: 1,48025 to 29 minutes: 1,15730 to 34 minutes: 2,45335 to 39 minutes: 82640 to 44 minutes: 58145 to 59 minutes: 1,28560 to 89 minutes: 1,02890 or more minutes: 540
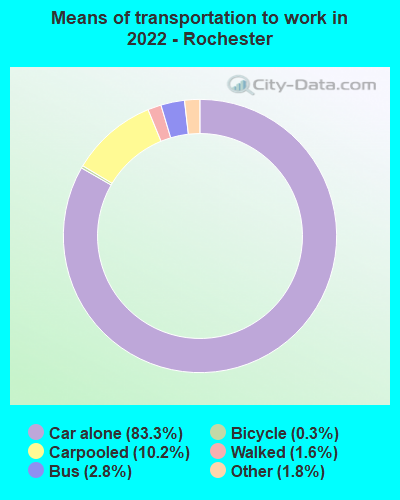
Means of transportation to work:
Drove a car alone: 10,179 (68.1%)Carpooled: 1,477 (9.9%)Bus : 178 (1.2%)Taxi: 284 (1.9%)Bicycle: 39 (0.3%)Walked: 197 (1.3%)Worked at home: 2,455 (16.4%)
Unemployment by race in 2022
Unemployment rate for White non-Hispanic residents 2.0% Males2.5% FemalesUnemployment rate for two or more race residents 5.0% Males
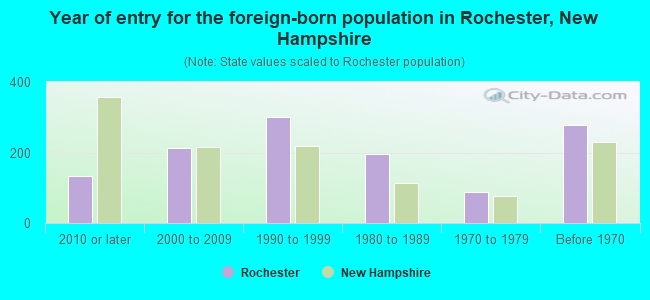
Year of entry for the foreign-born population in Rochester, New Hampshire
133 2010 or later 214 2000 to 2009 302 1990 to 1999 196 1980 to 1989 89 1970 to 1979 278 Before 1970
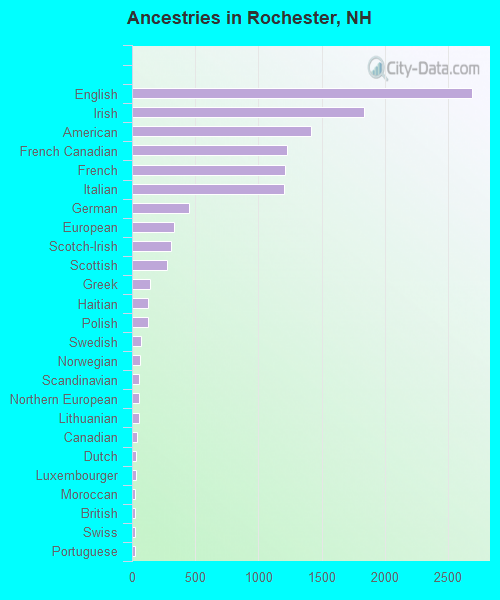
First ancestries reported:
English: 2,690 (19.6%)
Irish: 1,835 (13.4%)
American: 1,417 (10.3%)
French Canadian: 1,227 (8.9%)
French: 1,213 (8.8%)
Italian: 1,206 (8.8%)
German: 451 (3.3%)
European: 330 (2.4%)
Scotch-Irish: 306 (2.2%)
Scottish: 279 (2.0%)
Greek: 146 (1.1%)
Haitian: 128 (0.9%)
Polish: 124 (0.9%)
Swedish: 68 (0.5%)
Norwegian: 62 (0.5%)
Scandinavian: 57 (0.4%)
Northern European: 55 (0.4%)
Lithuanian: 53 (0.4%)
Canadian: 37 (0.3%)
Dutch: 31 (0.2%)
Luxembourger: 29 (0.2%)
Moroccan: 27 (0.2%)
British: 27 (0.2%)
Swiss: 26 (0.2%)
Portuguese: 25 (0.2%)
Celtic: 19 (0.1%)
Cajun: 14 (0.1%)
Eastern European: 14 (0.1%)
Finnish: 12 (0.09%)
Welsh: 10 (0.07%)
Armenian: 9 (0.07%) Most common places of birth for foreign-born residents (%): Canada Rochester:
11.5% (102)New Hampshire:
9.1% (7,618)
Indonesia Rochester:
9.6% (85)New Hampshire:
0.6% (460)
Nepal Rochester:
9.6% (85)New Hampshire:
2.5% (2,112)
Dominican Republic Rochester:
9.3% (83)New Hampshire:
7.0% (5,842)
Cambodia Rochester:
8.4% (75)New Hampshire:
0.5% (419)
China, excluding Hong Kong and Taiwan Rochester:
5.2% (46)New Hampshire:
4.5% (3,775)
Australia Rochester:
5.2% (46)New Hampshire:
0.3% (283)
France Rochester:
4.9% (44)New Hampshire:
0.8% (705)
Korea Rochester:
4.6% (41)New Hampshire:
2.7% (2,211)
Russia Rochester:
4.5% (40)New Hampshire:
1.6% (1,351)
Ireland Rochester:
2.9% (26)New Hampshire:
0.9% (728)
Laos Rochester:
2.8% (25)New Hampshire:
0.6% (512)
Morocco Rochester:
2.8% (25)New Hampshire:
0.5% (385)
Greece Rochester:
2.4% (21)New Hampshire:
0.9% (719)
Japan Rochester:
2.1% (19)New Hampshire:
0.9% (729)
Germany Rochester:
2.1% (19)New Hampshire:
3.3% (2,742)
Costa Rica Rochester:
1.8% (16)New Hampshire:
0.1% (82)
Norway Rochester:
1.6% (14)New Hampshire:
0.1% (124)
Place of birth for U.S.-born residents:
This state: 16,715Other state: 14,458Northeast: 9,091Midwest: 978South: 2,440West: 2,122 91.9% of Rochester residents lived in the same house 1 years ago.
Out of people who lived in different houses, 29.2% lived in this county.
Out of people who lived in different counties, 41.2% lived in New Hampshire.
Rochester:
91.9%State average:
89.8%
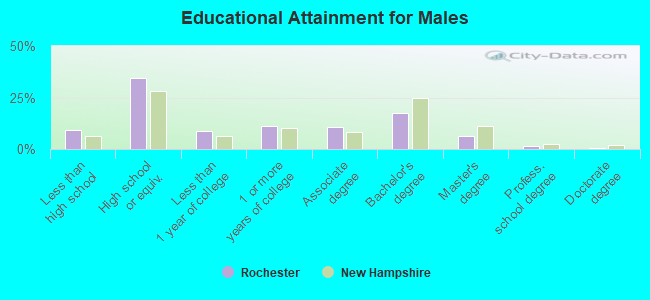
Education attainment for males 25 years and older:
No schooling: 62Nursery to 4th grade: 235th and 6th grade: 07th and 8th grade: 1539th grade: 25710th grade: 34111th grade: 11612th grade, no diploma: 88High school graduate (or equivalency): 3,913Less than 1 year of college: 986Some college more than 1 year, no degree: 1,279Associate degree: 1,240Bachelor's degree: 1,984Master's degree: 692Professional school degree: 142Doctorate degree: 81
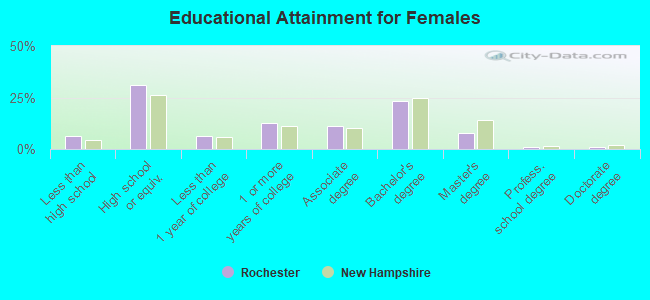
Education attainment for females 25 years and older:
No schooling: 59Nursery to 4th grade: 185th and 6th grade: 07th and 8th grade: 2419th grade: 10110th grade: 13011th grade: 8912th grade, no diploma: 155High school graduate (or equivalency): 3,771Less than 1 year of college: 779Some college more than 1 year, no degree: 1,521Associate degree: 1,345Bachelor's degree: 2,837Master's degree: 946Professional school degree: 129Doctorate degree: 97
Housing units in structures:
One, detached: 7,199One, attached: 476Two: 9713 or 4: 1,1475 to 9: 63110 to 19: 58420 to 49: 74450 or more: 418Mobile homes: 2,371Median worth of mobile homes: $115,746
Housing units lacking complete plumbing facilities in 2022: 1.7%Housing units lacking complete kitchen facilities in 2022: 0.6%House/condo owner moved in on average 11 years ago
Renter moved in on average 4 years ago
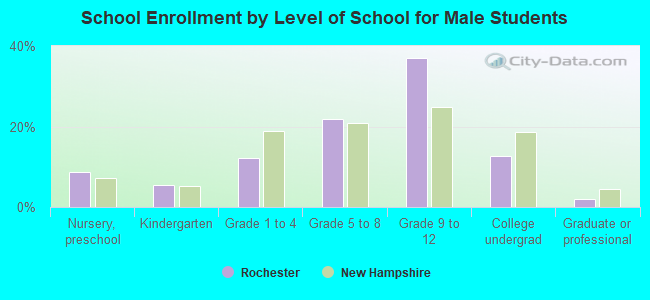
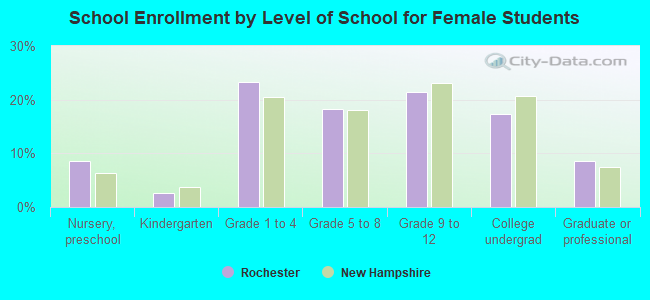
Private vs. public school enrollment:
Students in private schools in grades 1 to 8 (elementary and middle school): 230 Here:
9.4%New Hampshire:
11.4%
Students in private schools in grades 9 to 12 (high school): 157 Here:
7.7%New Hampshire:
14.0%
Students in private undergraduate colleges: 111 Here:
11.6%New Hampshire:
38.0%