Romeoville, IL (Illinois) Houses and Residents
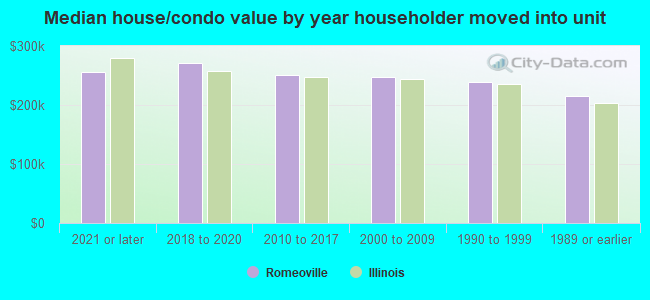
| Romeoville: | $248,168 |
| Illinois: | $251,600 |
Total population: 39,679 (Urban population: 20,984, Rural population: 158 (all nonfarm))
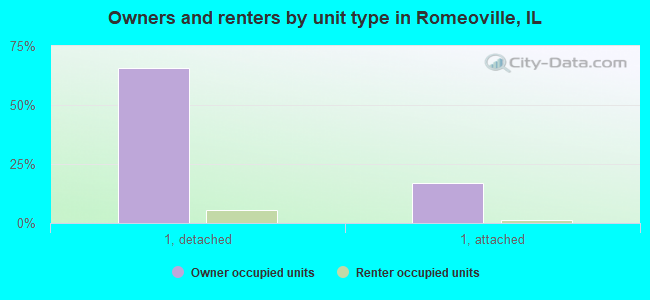
Houses: 12,939 (12,374 occupied: 10,449 owner occupied, 2,014 renter occupied)
| % of renters here: | 16% |
| State: | 33% |
Housing density: 891 houses/condos per square mile
Median price asked for vacant for-sale houses and condos in 2022: $222,102.
Median contract rent in 2022: $1,623 (lower quartile is $1,345, upper quartile is $1,959)
Median rent asked for vacant for-rent units in 2022: $1,851
Median gross rent in Romeoville, IL in 2022: $1,773
Housing units in Romeoville with a mortgage: 7,811 (433 second mortgage, 17 home equity loan, 328 both second mortgage and home equity loan)
Houses without a mortgage: 12
Median household income for houses/condos with a mortgage: $101,780
Median household income for apartments without a mortgage: $73,408
Median monthly housing costs: $1,592
Compare current foreclosures in Romeoville, IL:
| Photo | Address | Area | Beds / Baths | Price | Details |
|---|---|---|---|---|---|

|
#1
Ponderosa Dr
Romeoville, IL 60446
|
1,786 sq. feet
|
2 baths 3 beds |
show details | |

|
#2
John Kirkham Dr
Romeoville, IL 60446
|
1,360 sq. feet
|
1 baths 3 beds |
show details | |

|
#3
W Birchwood Dr
Romeoville, IL 60446
|
1,116 sq. feet
|
1 baths 3 beds |
show details | |

|
#4
Glen Ave
Romeoville, IL 60446
|
1,008 sq. feet
|
1 baths 3 beds |
show details | |

|
#5
Azalea Cir
Romeoville, IL 60446
|
1,104 sq. feet
|
1 baths 2 beds |
show details | |

|
#6
S Stone Brook Dr
Romeoville, IL 60446
|
- sq. feet
|
- baths - beds |
show details | |

|
#7
Williamsburg Ct
Romeoville, IL 60446
|
- sq. feet
|
- baths - beds |
show details | |

|
#8
W Ludington Cir
Romeoville, IL 60446
|
- sq. feet
|
- baths - beds |
show details | |

|
#9
N Sleepy Hollow Ln
Romeoville, IL 60446
|
- sq. feet
|
- baths - beds |
show details | |

|
#10
S Dollinger Dr
Romeoville, IL 60446
|
- sq. feet
|
- baths - beds |
show details |
| Photo | Address | Area | Beds / Baths | Price | Details |
|---|---|---|---|---|---|

|
#11
Highpoint Dr Apt 104
Romeoville, IL 60446
|
- sq. feet
|
- baths - beds |
show details | |

|
#12
Raleigh Trl
Romeoville, IL 60446
|
- sq. feet
|
- baths - beds |
show details | |

|
#13
S Weber Rd # Unit815
Romeoville, IL 60446
|
- sq. feet
|
- baths - beds |
show details | |

|
#14
S Stone Brook Dr
Romeoville, IL 60446
|
- sq. feet
|
- baths - beds |
show details | |
|
|
#15
Highpoint Dr # 204
Romeoville, IL 60446
|
- sq. feet
|
- baths - beds |
show details | |

|
#16
S Oak Creek Ln
Romeoville, IL 60446
|
- sq. feet
|
- baths - beds |
show details | |

|
#17
Easton Ln Apt 207
Romeoville, IL 60446
|
- sq. feet
|
- baths - beds |
show details | |

|
#18
Highpoint Dr Apt 101
Romeoville, IL 60446
|
- sq. feet
|
- baths - beds |
show details | |

|
#19
W Stillwater Ct
Romeoville, IL 60446
|
- sq. feet
|
- baths - beds |
show details | |

|
#20
Santa Fe Rd Apt 204
Romeoville, IL 60446
|
- sq. feet
|
- baths - beds |
show details |
| Photo | Address | Area | Beds / Baths | Price | Details |
|---|---|---|---|---|---|

|
#21
Highpoint Dr Apt 104
Romeoville, IL 60446
|
- sq. feet
|
- baths - beds |
show details | |

|
#22
N Weber Rd # 103
Romeoville, IL 60446
|
- sq. feet
|
- baths - beds |
show details | |

|
#23
Highpoint Dr Apt 106
Romeoville, IL 60446
|
- sq. feet
|
- baths - beds |
show details | |

|
#24
Highpoint Dr Apt 207
Romeoville, IL 60446
|
- sq. feet
|
- baths - beds |
show details | |

|
#25
Mews Ln, Unit 201
Romeoville, IL 60446
|
- sq. feet
|
- baths - beds |
show details | |

|
#26
N Weber Rd # 107
Romeoville, IL 60446
|
- sq. feet
|
- baths - beds |
show details | |

|
#27
W Alder Creek Dr
Romeoville, IL 60446
|
- sq. feet
|
- baths - beds |
show details | |

|
#28
Lily Ln Apt E
Romeoville, IL 60446
|
- sq. feet
|
- baths - beds |
show details | |

|
#29
S Dollinger Dr
Romeoville, IL 60446
|
- sq. feet
|
- baths - beds |
show details | |

|
#30
Santa Fe Rd Apt 103
Romeoville, IL 60446
|
- sq. feet
|
- baths - beds |
show details |
| Photo | Address | Area | Beds / Baths | Price | Details |
|---|---|---|---|---|---|

|
#31
Highpoint Dr Apt 201
Romeoville, IL 60446
|
- sq. feet
|
- baths - beds |
show details | |

|
#32
N Grand Blvd
Romeoville, IL 60446
|
- sq. feet
|
- baths - beds |
show details | |

|
#33
Heritage Pkwy
Romeoville, IL 60446
|
- sq. feet
|
- baths - beds |
show details | |

|
#34
N Weber Rd # 135
Romeoville, IL 60446
|
- sq. feet
|
- baths - beds |
show details | |

|
#35
Fremont Ave
Romeoville, IL 60446
|
- sq. feet
|
- baths - beds |
show details | |

|
#36
Edward Dr
Romeoville, IL 60446
|
- sq. feet
|
- baths - beds |
show details | |

|
#37
Healy Ave
Romeoville, IL 60446
|
- sq. feet
|
- baths - beds |
show details | |

|
#38
Kenyon Ave
Romeoville, IL 60446
|
- sq. feet
|
- baths - beds |
show details | |

|
#39
S Shannon Dr
Romeoville, IL 60446
|
- sq. feet
|
- baths - beds |
show details | |

|
#40
W Alder Creek Dr
Romeoville, IL 60446
|
- sq. feet
|
- baths - beds |
show details |
| Photo | Address | Area | Beds / Baths | Price | Details |
|---|---|---|---|---|---|

|
#41
Hudson Ave
Romeoville, IL 60446
|
- sq. feet
|
- baths - beds |
show details | |

|
#42
Belmont Dr
Romeoville, IL 60446
|
- sq. feet
|
- baths - beds |
show details | |

|
#43
W Alder Creek Dr
Romeoville, IL 60446
|
- sq. feet
|
- baths - beds |
show details | |

|
#44
Honeytree Dr
Romeoville, IL 60446
|
- sq. feet
|
- baths - beds |
show details | |

|
#45
Larsen Cir
Romeoville, IL 60446
|
- sq. feet
|
- baths - beds |
show details | |

|
#46
Kathleen Dr
Romeoville, IL 60446
|
- sq. feet
|
- baths - beds |
show details | |

|
#47
S Alder Creek Dr
Romeoville, IL 60446
|
- sq. feet
|
- baths - beds |
show details | |

|
#48
Edward Dr
Romeoville, IL 60446
|
- sq. feet
|
- baths - beds |
show details | |

|
#49
Wedgewood Cir
Romeoville, IL 60446
|
- sq. feet
|
- baths - beds |
show details | |

|
Check over 1 million property listings on Foreclosure.com!
|
browse all offers | |||

Latest news about housing in Romeoville, IL collected exclusively by city-data.com from local newspapers, TV, and radio stations

 | Lisle vs Romeoville new house purchase (6 replies) |
| Affordable Homes near Naperville? (~$150k) (8 replies) |
| Moving to SW Chicago (5 replies) |
| Advice on apartment complexes around Plainfield, Romeoville & other towns nearby (1 reply) |
| Moving to IL with GF, looking for good apartments. (4 replies) |
| Suburbs of Suburbs (32 replies) |

Median year apartment built: 1997
Household type by relationship:
Households: 40,131- Male householders: 6,246 (768 living alone), Female householders: 5,954 (1,523 living alone)
7,197 spouses (7,169 opposite-sex spouses), 968 unmarried partners, (938 opposite-sex unmarried partners), 14,674 children (13,824 natural, 274 adopted, 574 stepchildren), 1,191 grandchildren, 475 brothers or sisters, 1,019 parents, 0 foster children, 645 other relatives, 948 non-relatives
- In group quarters: 804
Size of family households: 2,469 2-persons, 2,118 3-persons, 2,509 4-persons, 1,370 5-persons, 518 6-persons, 273 7-or-more-persons.
Size of nonfamily households: 2,355 1-person, 573 2-persons, 79 3-persons, 7 4-persons.
6,491 married couples with children.
1,575 single-parent households (548 men, 1,027 women).
58.8% of residents of Romeoville speak English at home.
26.9% of residents speak Spanish at home (61% speak English very well, 22% speak English well, 14% speak English not well, 3% don't speak English at all).
6.7% of residents speak other Indo-European language at home (56% speak English very well, 34% speak English well, 5% speak English not well, 4% don't speak English at all).
4.2% of residents speak Asian or Pacific Island language at home (63% speak English very well, 26% speak English well, 8% speak English not well, 3% don't speak English at all).
4.8% of residents speak other language at home (76% speak English very well, 17% speak English well, 4% speak English not well, 2% don't speak English at all).
Foreign born population: 9,328 (23.2%)
(54.0% of them are naturalized citizens)
| Here: | 6.3 |
| State: | 6.4 |
| Here: | 4.8 |
| State: | 4.1 |
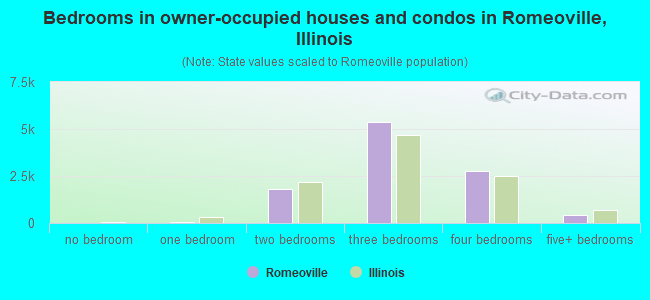
- Bedrooms in owner-occupied houses and condos in Romeoville, Illinois
- 12no bedroom
- 311 bedroom
- 1,8062 bedrooms
- 5,3883 bedrooms
- 2,7924 bedrooms
- 4215+ bedrooms
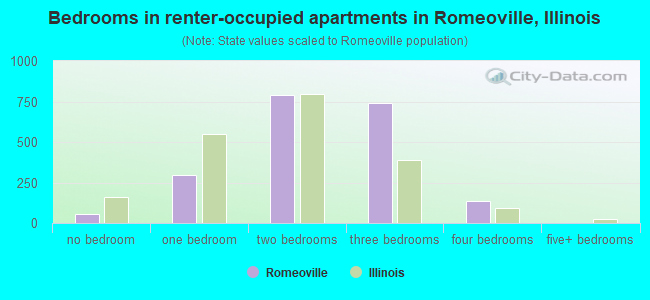
- Bedrooms in renter-occupied apartments in Romeoville, Illinois
- 53no bedroom
- 2991 bedroom
- 7902 bedrooms
- 7403 bedrooms
- 1334 bedrooms
- 05+ bedrooms
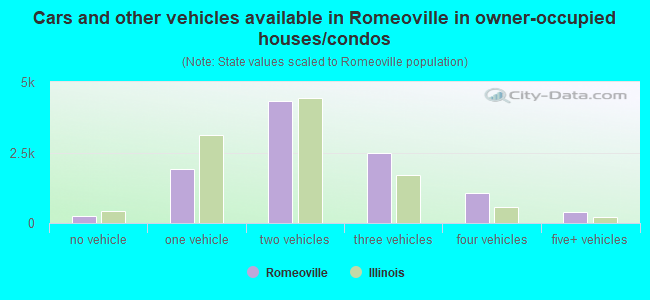
- Cars and other vehicles available in Romeoville in owner-occupied houses/condos
- 265no vehicle
- 1,9271 vehicle
- 4,3352 vehicles
- 2,4753 vehicles
- 1,0544 vehicles
- 3935+ vehicles
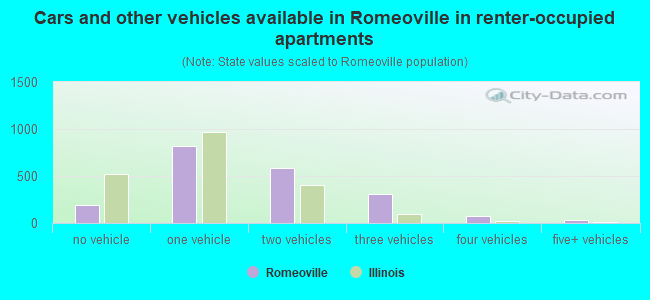
- Cars and other vehicles available in Romeoville in renter-occupied apartments
- 193no vehicle
- 8161 vehicle
- 5862 vehicles
- 3133 vehicles
- 744 vehicles
- 335+ vehicles
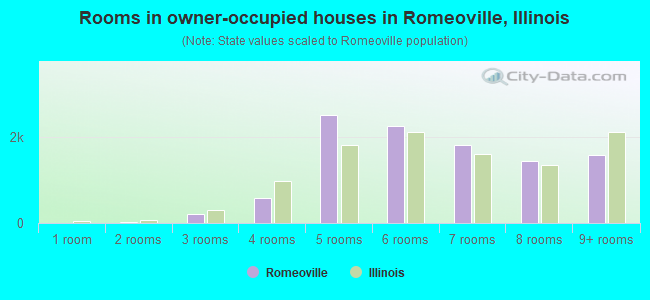
- Rooms in owner-occupied houses in Romeoville, Illinois
- 01 room
- 122 rooms
- 2033 rooms
- 5844 rooms
- 2,5235 rooms
- 2,2656 rooms
- 1,8167 rooms
- 1,4498 rooms
- 1,5979+ rooms
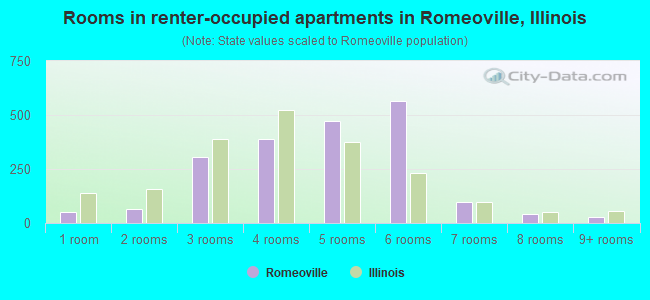
- Rooms in renter-occupied apartments in Romeoville, Illinois
- 531 room
- 642 rooms
- 3053 rooms
- 3884 rooms
- 4725 rooms
- 5666 rooms
- 987 rooms
- 408 rooms
- 289+ rooms
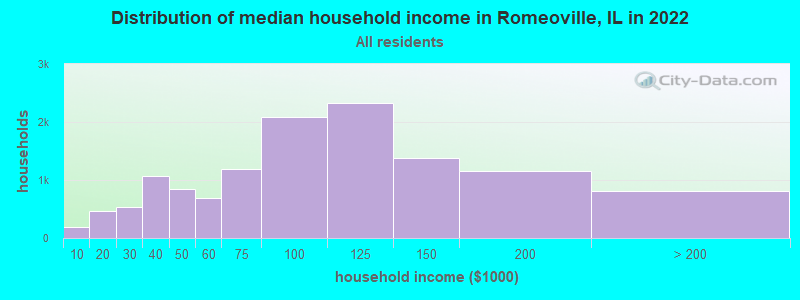
Romeoville, IL household income distribution

- 195Less than $10,000
- 459$10,000 to $19,999
- 529$20,000 to $29,999
- 1,069$30,000 to $39,999
- 850$40,000 to $49,999
- 683$50,000 to $59,999
- 1,190$60,000 to $74,999
- 2,087$75,000 to $99,999
- 2,323$100,000 to $124,999
- 1,371$125,000 to $149,999
- 1,158$150,000 to $199,999
- 806$200,000 or more
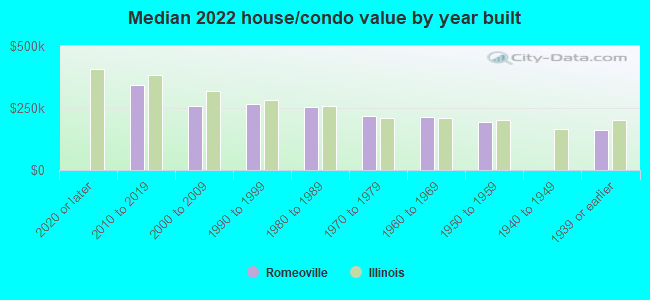
Home value of owner - occupied houses in 2022 in Romeoville, IL
-
- 139Less than $10,000
- 7$15,000 to $19,999
- 54$20,000 to $24,999
- 30$25,000 to $29,999
- 36$30,000 to $34,999
- 2$60,000 to $69,999
- 71$80,000 to $89,999
- 23$90,000 to $99,999
- 35$100,000 to $124,999
- 194$125,000 to $149,999
- 1,031$150,000 to $174,999
- 1,043$175,000 to $199,999
- 2,679$200,000 to $249,999
- 2,451$250,000 to $299,999
- 1,744$300,000 to $399,999
- 229$400,000 to $499,999
- 21$500,000 to $749,999
- 9$1,000,000 to $1,499,999
- 14$2,000,000 or more
Rent paid by renters in 2022 in Romeoville, IL
-
- 13$650 to $699
- 32$700 to $749
- 34$800 to $899
- 71$900 to $999
- 170$1,000 to $1,249
- 442$1,250 to $1,499
- 956$1,500 to $1,999
- 235$2,000 to $2,499
- 8$2,500 to $2,999
- 17$3,000 to $3,499
- 25$3,500 or more
- 69No cash rent
Percentage of workers working in this county: 60.3%
Number of people working at home: 2,079 (9.9% of all workers)
Travel time to work (commute)
- Less than 5 minutes: 197
- 5 to 9 minutes: 1,380
- 10 to 14 minutes: 2,149
- 15 to 19 minutes: 2,135
- 20 to 24 minutes: 1,708
- 25 to 29 minutes: 1,710
- 30 to 34 minutes: 3,242
- 35 to 39 minutes: 845
- 40 to 44 minutes: 896
- 45 to 59 minutes: 2,048
- 60 to 89 minutes: 1,819
- 90 or more minutes: 438
Means of transportation to work:
- Drove a car alone: 17,889 (77.7%)
- Carpooled: 2,061 (8.9%)
- Bus: 94 (0.4%)
- Subway or elevated rail: 7 (0.0%)
- Long-distance train or commuter rail: 24 (0.1%)
- Taxi: 386 (1.7%)
- Walked: 121 (0.5%)
- Worked at home: 2,079 (9.0%)
- Unemployment by race in 2022
- Unemployment rate for White non-Hispanic residents
- 3.0%Males
- 4.2%Females
- Unemployment rate for Black residents
- 4.5%Males
- 6.8%Females
- Unemployment rate for American Indian and Alaska Native residents
- 15.1%Females
- Unemployment rate for Asian residents
- 8.6%Males
- 2.2%Females
- Unemployment rate for other race residents
- 3.6%Males
- 3.6%Females
- Unemployment rate for two or more race residents
- 4.7%Males
- 4.9%Females
- Unemployment rate for Hispanic or Latino residents
- 3.6%Males
- 3.3%Females
- Year of entry for the foreign-born population in Romeoville, Illinois
- 3,1512010 or later
- 1,8822000 to 2009
- 2,2721990 to 1999
- 4881980 to 1989
- 2701970 to 1979
- 340Before 1970
First ancestries reported:
- Polish: 1,678 (8.1%)
- Italian: 793 (3.8%)
- German: 774 (3.8%)
- Irish: 727 (3.5%)
- American: 712 (3.5%)
- African: 355 (1.7%)
- Ukrainian: 283 (1.4%)
- English: 282 (1.4%)
- Egyptian: 277 (1.3%)
- Moroccan: 237 (1.1%)
- Ghanaian: 227 (1.1%)
- Lithuanian: 153 (0.7%)
- Yugoslavian: 131 (0.6%)
- Swedish: 99 (0.5%)
- European: 92 (0.4%)
- Czech: 87 (0.4%)
- Arab: 62 (0.3%)
- French: 62 (0.3%)
- Brazilian: 60 (0.3%)
- Hungarian: 56 (0.3%)
- Croatian: 53 (0.3%)
- Greek: 50 (0.2%)
- Czechoslovakian: 46 (0.2%)
- Ethiopian: 41 (0.2%)
- Northern European: 30 (0.1%)
- Macedonian: 27 (0.1%)
- Haitian: 27 (0.1%)
- Canadian: 24 (0.1%)
- Liberian: 20 (0.10%)
- Slovene: 18 (0.09%)
- Nigerian: 15 (0.07%)
- Romanian: 14 (0.07%)
- Albanian: 13 (0.06%)
- Bulgarian: 12 (0.06%)
- Scotch-Irish: 10 (0.05%)
- Scottish: 10 (0.05%)
- Slovak: 10 (0.05%)
- Dutch: 10 (0.05%)
- Norwegian: 8 (0.04%)
- French Canadian: 7 (0.03%)
- British: 5 (0.02%)
- Jamaican: 5 (0.02%)
- Palestinian: 4 (0.02%)
- Estonian: 3 (0.01%)
- Serbian: 2 (0.01%)
Most common places of birth for foreign-born residents (%):
| Romeoville: | 42.3% (3,599) |
| Illinois: | 34.7% (626,958) |
| Romeoville: | 11.8% (1,008) |
| Illinois: | 5.2% (93,003) |
| Romeoville: | 7.0% (592) |
| Illinois: | 6.9% (124,474) |
| Romeoville: | 2.9% (243) |
| Illinois: | 9.2% (166,409) |
| Romeoville: | 2.7% (233) |
| Illinois: | 1.6% (29,519) |
| Romeoville: | 2.7% (229) |
| Illinois: | 0.3% (5,762) |
| Romeoville: | 2.6% (223) |
| Illinois: | 0.2% (3,781) |
| Romeoville: | 2.5% (213) |
| Illinois: | 1.6% (29,316) |
| Romeoville: | 2.3% (194) |
| Illinois: | 0.9% (16,844) |
| Romeoville: | 2.2% (188) |
| Illinois: | 0.4% (7,043) |
| Romeoville: | 1.7% (144) |
| Illinois: | 0.1% (1,549) |
| Romeoville: | 1.5% (129) |
| Illinois: | 1.3% (22,793) |
| Romeoville: | 1.5% (128) |
| Illinois: | 4.1% (74,364) |
Place of birth for U.S.-born residents:
- This state: 26,305
- Other state: 3,747
- Northeast: 685
- Midwest: 965
- South: 1,104
- West: 1,092
91.7% of Romeoville residents lived in the same house 1 years ago.
Out of people who lived in different houses, 32.4% lived in this county.
Out of people who lived in different counties, 79.5% lived in Illinois.
| Romeoville: | 91.7% |
| State average: | 88.3% |
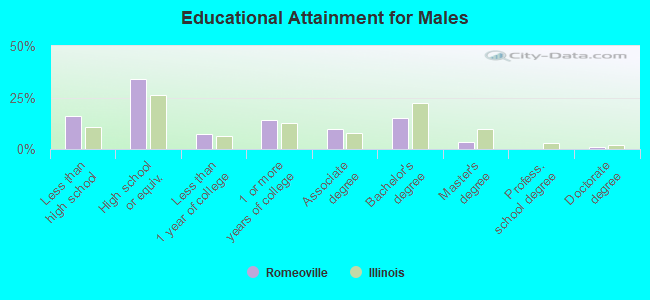
Education attainment for males 25 years and older:
- No schooling: 704
- Nursery to 4th grade: 0
- 5th and 6th grade: 198
- 7th and 8th grade: 149
- 9th grade: 67
- 10th grade: 254
- 11th grade: 173
- 12th grade, no diploma: 457
- High school graduate (or equivalency): 4,333
- Less than 1 year of college: 924
- Some college more than 1 year, no degree: 1,761
- Associate degree: 1,233
- Bachelor's degree: 1,892
- Master's degree: 410
- Professional school degree: 10
- Doctorate degree: 106
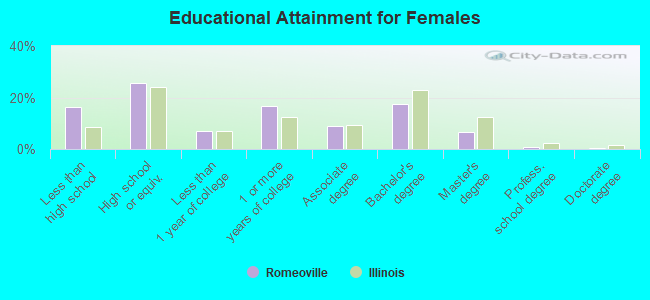
Education attainment for females 25 years and older:
- No schooling: 733
- Nursery to 4th grade: 160
- 5th and 6th grade: 122
- 7th and 8th grade: 174
- 9th grade: 105
- 10th grade: 143
- 11th grade: 99
- 12th grade, no diploma: 602
- High school graduate (or equivalency): 3,403
- Less than 1 year of college: 941
- Some college more than 1 year, no degree: 2,211
- Associate degree: 1,208
- Bachelor's degree: 2,322
- Master's degree: 871
- Professional school degree: 117
- Doctorate degree: 55


Housing units in structures:
- One, detached: 9,146
- One, attached: 2,375
- Two: 102
- 3 or 4: 202
- 5 to 9: 396
- 10 to 19: 279
- 20 to 49: 183
- 50 or more: 252
Housing units lacking complete kitchen facilities in 2022: 0.9%
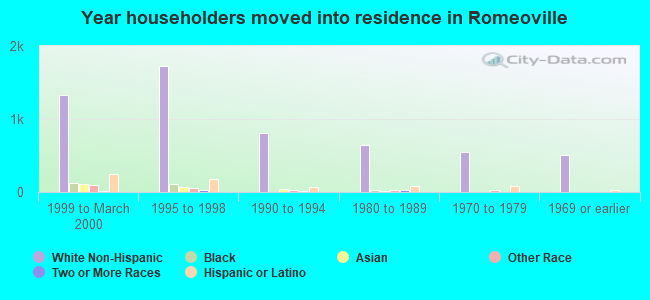
House/condo owner moved in on average 11 years ago
Renter moved in on average 3 years ago
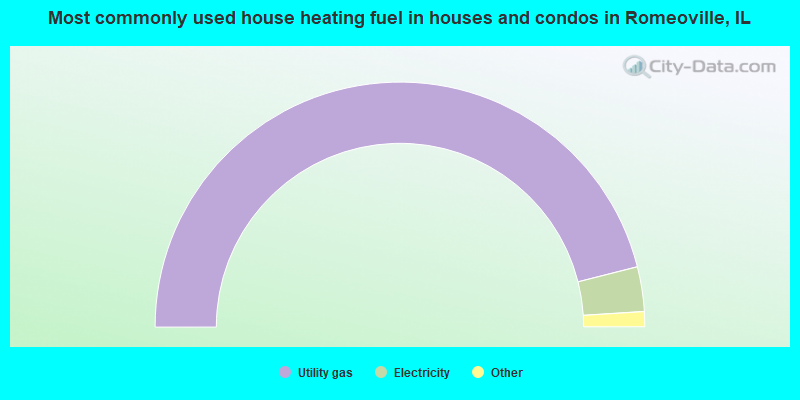
- 92.1%Utility gas
- 5.9%Electricity
- 1.2%Bottled, tank, or LP gas
- 0.4%Fuel oil, kerosene, etc.
- 0.2%No fuel used
- 0.2%Other fuel

- 80.9%Utility gas
- 16.4%Electricity
- 2.7%Bottled, tank, or LP gas
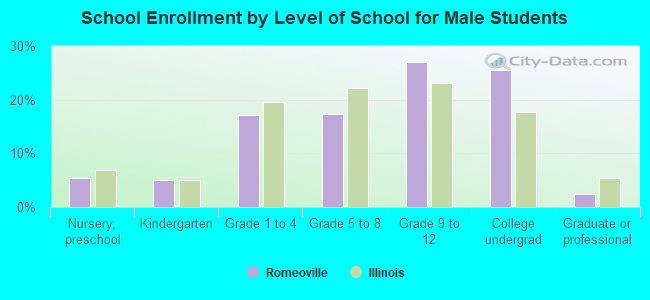
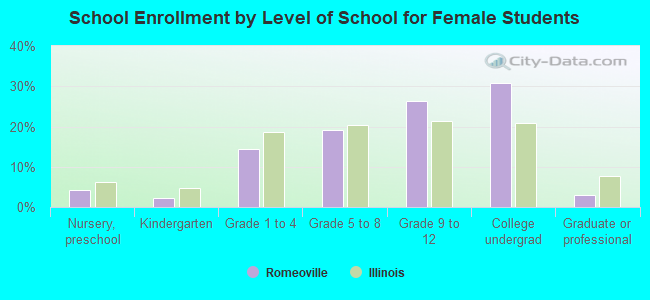
Private vs. public school enrollment:
| Here: | 6.2% |
| Illinois: | 13.3% |
| Here: | 6.1% |
| Illinois: | 9.9% |
| Here: | 31.3% |
| Illinois: | 27.4% |