Salmon Creek, WA (Washington) Houses and Residents
Estimated median house or condo value in 2022: $537,569 (it was $160,200 in 2000 )
Salmon Creek:
$537,569Washington:
$569,500
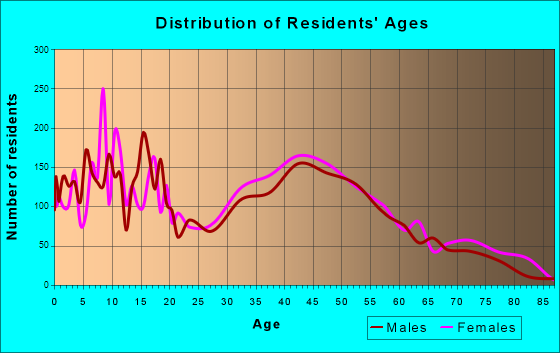
Lower value quartile - upper value quartile: $422,712 - $671,182Total population: 19,686 (Urban population: 16,730, Rural population: 0)
Houses: 8,520 (8,377 occupied: 6,196 owner occupied, 2,175 renter occupied )
% of renters here:
26%State:
36%
Housing density: 1,359 houses/condos per square mile
Median price asked for vacant for-sale houses and condos in 2022: $469,974.
Median contract rent in 2022: $1,334 (lower quartile is $1,094, upper quartile is $1,862)
Median rent asked for vacant for-rent units in 2022: $14,513
Median gross rent in Salmon Creek, WA in 2022: $1,483
Housing units in Salmon Creek with a mortgage: 4,288 (454 second mortgage, 0 home equity loan, 448 both second mortgage and home equity loan )Houses without a mortgage: 29
Median household income for houses/condos with a mortgage: $125,534
Median household income for apartments without a mortgage: $74,789
Median monthly housing costs: $1,627
Data:
Median house or condo value ($)
Median house or condo value ($ change since 2000)
Median house or condo value ($) - White
Median house or condo value ($) - Black or African American
Median house or condo value ($) - Asian
Median house or condo value ($) - Hispanic or Latino
Median house or condo value ($) - American Indian and Alaska Native
Median house or condo value ($) - Multirace
Median house or condo value ($) - Other Race
Median price asked for mobile homes ($)
Household density (households per square mile)
Mean house or condo value by units in structure - 1, detached ($)
Mean house or condo value by units in structure - 1, attached ($)
Mean house or condo value by units in structure - 2 ($)
Mean house or condo value by units in structure by units in structure - 3 or 4 ($)
Mean house or condo value by units in structure - 5 or more ($)
Mean house or condo value by units in structure - Boat, RV, van, etc. ($)
Mean house or condo value by units in structure - Mobile home ($)
Median contract rent ($)
Median contract rent - Lower quartile ($)
Median contract rent - Upper quartile ($)
Median gross rent ($)
Urban houses (%)
Rural houses (%)
Houses occupied (%)
Houses occupied (% change since 2000)
Houses owner occupied (%)
Houses owner occupied (% change since 2000)
Houses renter occupied (%)
Houses renter occupied (% change since 2000)
Vacant housing units - For rent (%)
Vacant housing units - For rent (% change since 2000)
Vacant housing units - For sale only (%)
Vacant housing units - For sale only (% change since 2000)
Vacant housing units - Rented or sold, not occupied (%)
Vacant housing units - Rented or sold, not occupied (% change since 2000)
Vacant housing units - For seasonal, recreational, or occasional use (%)
Vacant housing units - For seasonal, recreational, or occasional use (% change since 2000)
Vacant housing units - For migrant workers (%)
Vacant housing units - For migrant workers (% change since 2000)
Vacant housing units - Other vacant (%)
Vacant housing units - Other vacant (% change since 2000)
Median monthly housing costs ($)
Median household income for houses/condos with a mortgage ($)
Median household income for houses/condos without a mortgage ($)
Median household income ($)
Median household income ($) - White
Median household income ($) - Black or African American
Median household income ($) - Asian
Median household income ($) - Hispanic or Latino
Median household income ($) - American Indian and Alaska Native
Median household income ($) - Multirace
Median household income ($) - Other Race
Mortgage status - with mortgage (%)
Mortgage status - with second mortgage (%)
Mortgage status - with home equity loan (%)
Mortgage status - with both second mortgage and home equity loan (%)
Mortgage status - without a mortgage (%)
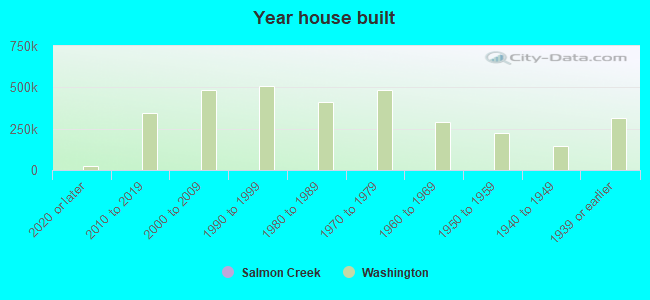
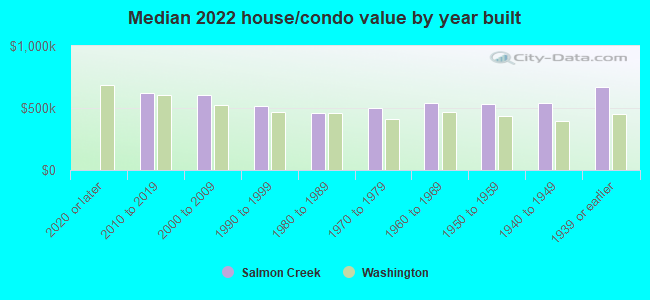
Median year house/condo built
Median year apartment built
Household type by relationship - Male householder living alone (%)
Household type by relationship - Male householder not living alone (%)
Household type by relationship - Female householder living alone (%)
Household type by relationship - Female householder not living alone (%)
Household type by relationship - Opposite-Sex spouse (%)
Household type by relationship - Same-Sex spouse (%)
Household type by relationship - Opposite-Sex unmarried partner (%)
Household type by relationship - Same-Sex unmarried partner (%)
Household type by relationship - In group quarters (%)
Size of family households - 2-person household (%)
Size of family households - 3-person household (%)
Size of family households - 4-person household (%)
Size of family households - 5-person household (%)
Size of family households - 6-person household (%)
Size of family households - 7-or-more-person household (%)
Size of nonfamily households - 1-person household (%)
Size of nonfamily households - 2-person household (%)
Size of nonfamily households - 3-person household (%)
Size of nonfamily households - 4-person household (%)
Size of nonfamily households - 5-person household (%)
Size of nonfamily households - 6-person household (%)
Size of nonfamily households - 7-or-moreperson household (%)
Year house built - Built 2010 or later (%)
Year house built - Built 2000 to 2009 (%)
Year house built - Built 1990 to 1999 (%)
Year house built - Built 1980 to 1989 (%)
Year house built - Built 1970 to 1979 (%)
Year house built - Built 1960 to 1969 (%)
Year house built - Built 1950 to 1959 (%)
Year house built - Built 1940 to 1949 (%)
Year house built - Built 1939 or earlier (%)
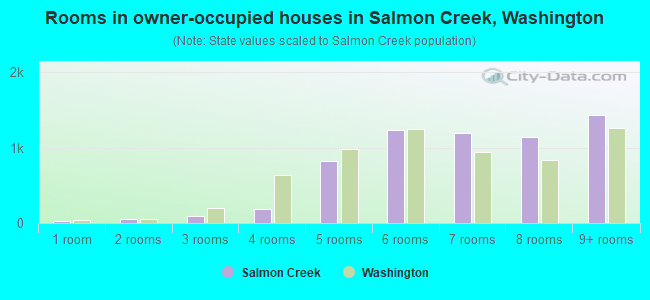
Median number of rooms in houses and condos
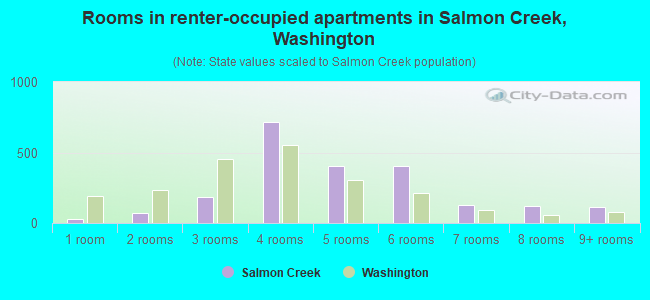
Median number of rooms in apartments
Median number of bedrooms in owner occupied houses
Mean number of bedrooms in owner occupied houses
Median number of bedrooms in renter occupied houses
Mean number of bedrooms in renter occupied houses
Median number of vehichles in owner occupied houses
Mean number of vehichles in owner occupied houses
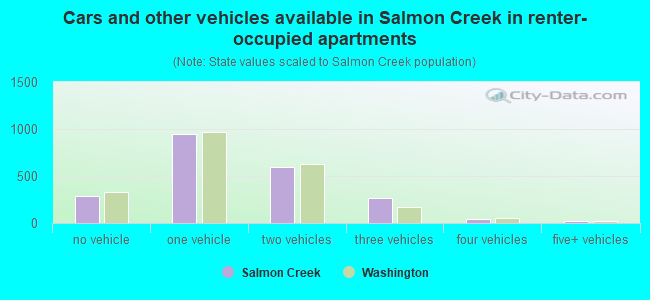
Median number of vehichles in renter occupied houses
Mean number of vehichles in renter occupied houses
Rooms in owner-occupied houses - 1 room (%)
Rooms in owner-occupied houses - 2 rooms (%)
Rooms in owner-occupied houses - 3 rooms (%)
Rooms in owner-occupied houses - 4 rooms (%)
Rooms in owner-occupied houses - 5 rooms (%)
Rooms in owner-occupied houses - 6 rooms (%)
Rooms in owner-occupied houses - 7 rooms (%)
Rooms in owner-occupied houses - 8 rooms (%)
Rooms in owner-occupied houses - 9+ rooms (%)
Rooms in renter-occupied houses - 1 room (%)
Rooms in renter-occupied houses - 2 rooms (%)
Rooms in renter-occupied houses - 3 rooms (%)
Rooms in renter-occupied houses - 4 rooms (%)
Rooms in renter-occupied houses - 5 rooms (%)
Rooms in renter-occupied houses - 6 rooms (%)
Rooms in renter-occupied houses - 7 rooms (%)
Rooms in renter-occupied houses - 8 rooms (%)
Rooms in renter-occupied houses - 9+ rooms (%)
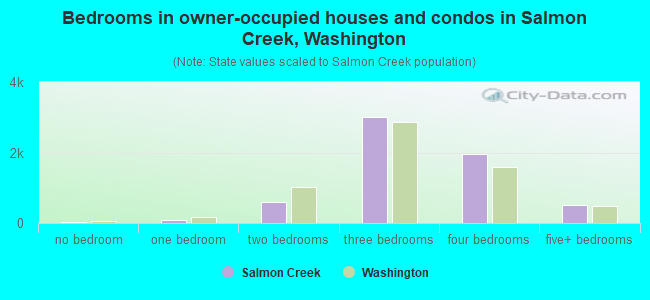
Bedrooms in owner-occupied houses - no bedrooms (%)
Bedrooms in owner-occupied houses - 1 bedroom (%)
Bedrooms in owner-occupied houses - 2 bedrooms (%)
Bedrooms in owner-occupied houses - 3 bedrooms (%)
Bedrooms in owner-occupied houses - 4 bedrooms (%)
Bedrooms in owner-occupied houses - 5+ bedrooms (%)
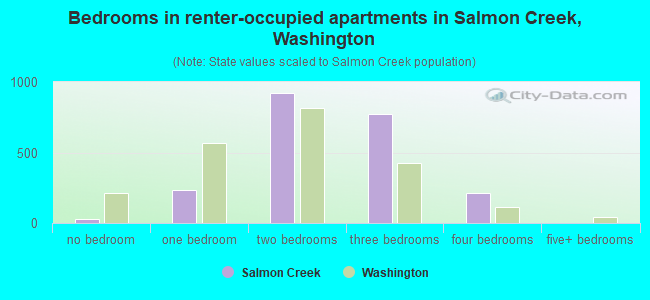
Bedrooms in renter-occupied houses - no bedrooms (%)
Bedrooms in renter-occupied houses - 1 bedroom (%)
Bedrooms in renter-occupied houses - 2 bedrooms (%)
Bedrooms in renter-occupied houses - 3 bedrooms (%)
Bedrooms in renter-occupied houses - 4 bedrooms (%)
Bedrooms in renter-occupied houses - 5+ bedrooms (%)
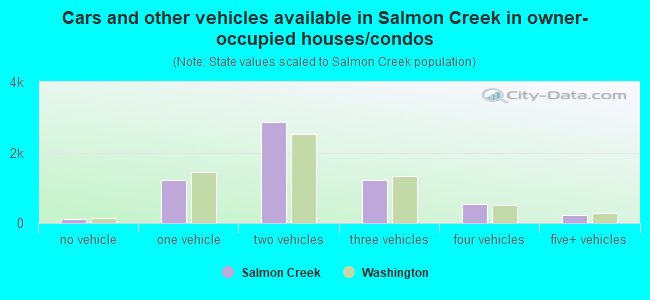
Vehicles available in owner-occupied houses - no vehicle available (%)
Vehicles available in owner-occupied houses - 1 vehicle available(%)
Vehicles available in owner-occupied houses - 2 Vehicles available (%)
Vehicles available in owner-occupied houses - 3 Vehicles available (%)
Vehicles available in owner-occupied houses - 4 Vehicles available (%)
Vehicles available in owner-occupied houses - 5+ Vehicles available (%)
Vehicles available in renter-occupied houses - no vehicle available (%)
Vehicles available in renter-occupied houses - 1 vehicle available (%)
Vehicles available in renter-occupied houses - 2 Vehicles available (%)
Vehicles available in renter-occupied houses - 3 Vehicles available (%)
Vehicles available in renter-occupied houses - 4 Vehicles available (%)
Vehicles available in renter-occupied houses - 5+ Vehicles available (%)
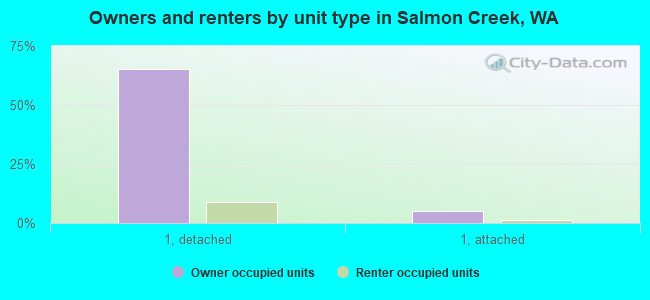
Housing units in structures - 1, detached (%)
Housing units in structures - 1, attached (%)
Housing units in structures - 2 (%)
Housing units in structures - 3 or 4 (%)
Housing units in structures - 5 to 9 (%)
Housing units in structures - 10 to 19 (%)
Housing units in structures - 20 to 49 (%)
Housing units in structures - 50 or more (%)
Housing units in structures - Mobile home (%)
Housing units in structures - Boat, RV, van, etc. (%)
Housing units in structures - Owners - 1, detached (%)
Housing units in structures - Owners - 1, attached (%)
Housing units in structures - Owners - 2 (%)
Housing units in structures - Owners - 3 or 4 (%)
Housing units in structures - Owners - 5 to 9 (%)
Housing units in structures - Owners - 10 to 19 (%)
Housing units in structures - Owners - 20 to 49 (%)
Housing units in structures - Owners - 50 or more (%)
Housing units in structures - Owners - Mobile home (%)
Housing units in structures - Owners - Boat, RV, van, etc. (%)
Housing units in structures - Renters - 1, detached (%)
Housing units in structures - Renters - 1, attached (%)
Housing units in structures - Renters - 2 (%)
Housing units in structures - Renters - 3 or 4 (%)
Housing units in structures - Renters - 5 to 9 (%)
Housing units in structures - Renters - 10 to 19 (%)
Housing units in structures - Renters - 20 to 49 (%)
Housing units in structures - Renters - 50 or more (%)
Housing units in structures - Renters - Mobile home (%)
Housing units in structures - Renters - Boat, RV, van, etc. (%)
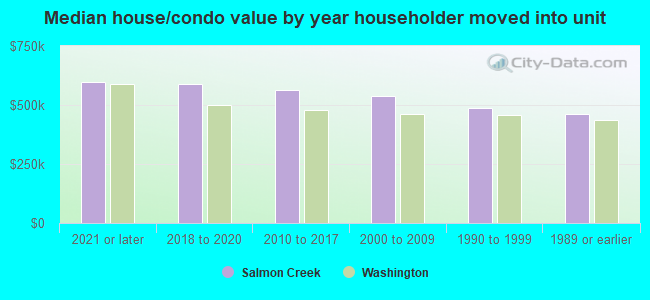
House/condo owner moved in on average (years ago)
Renter moved in on average (years ago)
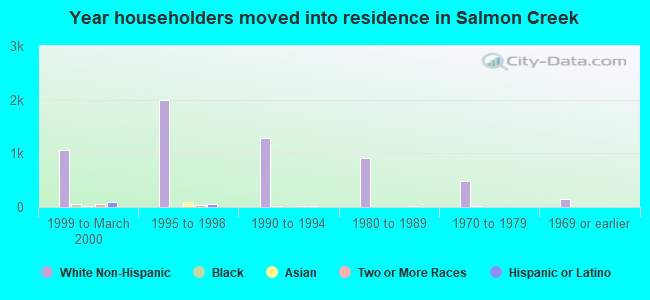
Year householder moved into unit - Moved in 1999 to March 2000 (%)
Year householder moved into unit - Moved in 1999 to March 2000 (%) - White
Year householder moved into unit - Moved in 1999 to March 2000 (%) - Black or African American
Year householder moved into unit - Moved in 1999 to March 2000 (%) - Asian
Year householder moved into unit - Moved in 1999 to March 2000 (%) - Hispanic or Latino
Year householder moved into unit - Moved in 1999 to March 2000 (%) - American Indian and Alaska Native
Year householder moved into unit - Moved in 1999 to March 2000 (%) - Multirace
Year householder moved into unit - Moved in 1999 to March 2000 (%) - Other Race
Year householder moved into unit - Moved in 1995 to 1998 (%)
Year householder moved into unit - Moved in 1995 to 1998 (%) - White
Year householder moved into unit - Moved in 1995 to 1998 (%) - Black or African American
Year householder moved into unit - Moved in 1995 to 1998 (%) - Asian
Year householder moved into unit - Moved in 1995 to 1998 (%) - Hispanic or Latino
Year householder moved into unit - Moved in 1995 to 1998 (%) - American Indian and Alaska Native
Year householder moved into unit - Moved in 1995 to 1998 (%) - Multirace
Year householder moved into unit - Moved in 1995 to 1998 (%) - Other Race
Year householder moved into unit - Moved in 1990 to 1994 (%)
Year householder moved into unit - Moved in 1990 to 1994 (%) - White
Year householder moved into unit - Moved in 1990 to 1994 (%) - Black or African American
Year householder moved into unit - Moved in 1990 to 1994 (%) - Asian
Year householder moved into unit - Moved in 1990 to 1994 (%) - Hispanic or Latino
Year householder moved into unit - Moved in 1990 to 1994 (%) - American Indian and Alaska Native
Year householder moved into unit - Moved in 1990 to 1994 (%) - Multirace
Year householder moved into unit - Moved in 1990 to 1994 (%) - Other Race
Year householder moved into unit - Moved in 1980 to 1989 (%)
Year householder moved into unit - Moved in 1980 to 1989 (%) - White
Year householder moved into unit - Moved in 1980 to 1989 (%) - Black or African American
Year householder moved into unit - Moved in 1980 to 1989 (%) - Asian
Year householder moved into unit - Moved in 1980 to 1989 (%) - Hispanic or Latino
Year householder moved into unit - Moved in 1980 to 1989 (%) - American Indian and Alaska Native
Year householder moved into unit - Moved in 1980 to 1989 (%) - Multirace
Year householder moved into unit - Moved in 1980 to 1989 (%) - Other Race
Year householder moved into unit - Moved in 1970 to 1979 (%)
Year householder moved into unit - Moved in 1970 to 1979 (%) - White
Year householder moved into unit - Moved in 1970 to 1979 (%) - Black or African American
Year householder moved into unit - Moved in 1970 to 1979 (%) - Asian
Year householder moved into unit - Moved in 1970 to 1979 (%) - Hispanic or Latino
Year householder moved into unit - Moved in 1970 to 1979 (%) - American Indian and Alaska Native
Year householder moved into unit - Moved in 1970 to 1979 (%) - Multirace
Year householder moved into unit - Moved in 1970 to 1979 (%) - Other Race
Year householder moved into unit - Moved in 1969 or earlier (%)
Year householder moved into unit - Moved in 1969 or earlier (%) - White
Year householder moved into unit - Moved in 1969 or earlier (%) - Black or African American
Year householder moved into unit - Moved in 1969 or earlier (%) - Asian
Year householder moved into unit - Moved in 1969 or earlier (%) - Hispanic or Latino
Year householder moved into unit - Moved in 1969 or earlier (%) - American Indian and Alaska Native
Year householder moved into unit - Moved in 1969 or earlier (%) - Multirace
Year householder moved into unit - Moved in 1969 or earlier (%) - Other Race
Housing units lacking complete plumbing facilities (%)
Housing units lacking complete kitchen facilities (%)
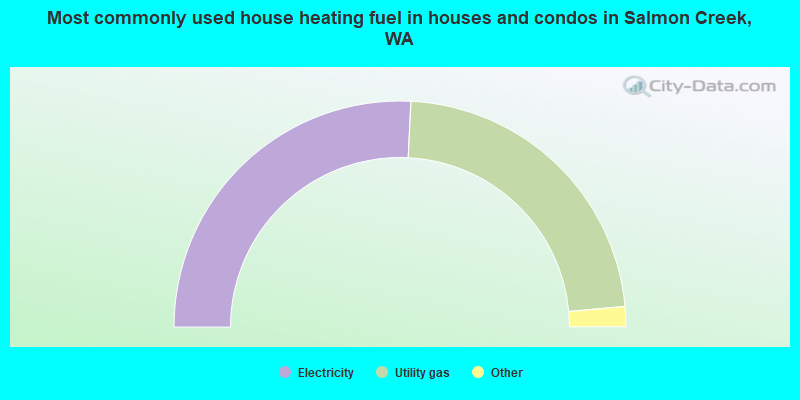
House heating fuel used in houses and condos - Utility gas (%)
House heating fuel used in houses and condos - Bottled, tank, or LP gas (%)
House heating fuel used in houses and condos - Electricity (%)
House heating fuel used in houses and condos - Fuel oil, kerosene, etc. (%)
House heating fuel used in houses and condos - Coal or coke (%)
House heating fuel used in houses and condos - Wood (%)
House heating fuel used in houses and condos - Solar energy (%)
House heating fuel used in houses and condos - Other fuel (%)
House heating fuel used in houses and condos - No fuel used (%)
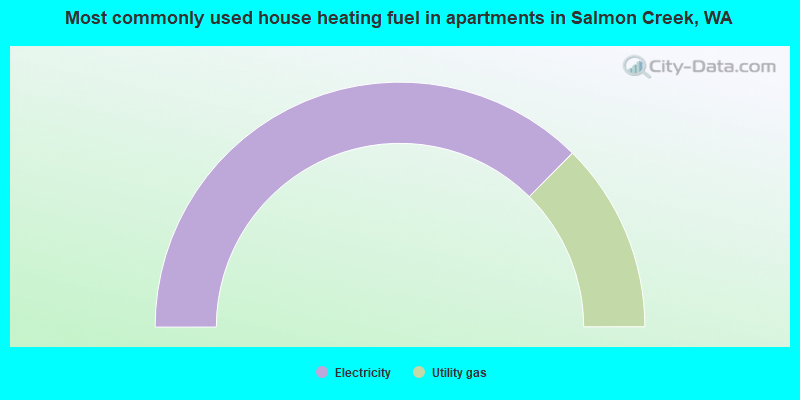
House heating fuel used in apartments - Utility gas (%)
House heating fuel used in apartments - Bottled, tank, or LP gas (%)
House heating fuel used in apartments - Electricity (%)
House heating fuel used in apartments - Fuel oil, kerosene, etc. (%)
House heating fuel used in apartments - Coal or coke (%)
House heating fuel used in apartments - Wood (%)
House heating fuel used in apartments - Solar energy (%)
House heating fuel used in apartments - Other fuel (%)
House heating fuel used in apartments - No fuel used (%)
Median year house/condo built: 1991Median year apartment built: 1980Household type by relationship:
Households: 20,823
Male householders: 4,070 (625 living alone ), Female householders: 4,099 (1,299 living alone )4,499 spouses (4,473 opposite-sex spouses ), 535 unmarried partners , (519 opposite-sex unmarried partners ), 5,732 children (5,472 natural , 161 adopted , 98 stepchildren ), 287 grandchildren , 164 brothers or sisters , 255 parents , 57 foster children , 148 other relatives , 882 non-relatives In group quarters: 90
Size of family households: 2,768 2-persons , 1,009 3-persons , 1,153 4-persons , 503 5-persons , 100 6-persons , 78 7-or-more-persons .
Size of nonfamily households: 2,107 1-person , 429 2-persons , 128 3-persons , 10 4-persons , 29 5-persons .
3,031 married couples with children. single-parent households (284 men , 496 women ).
87.9% of residents of Salmon Creek speak English at home. of residents speak Spanish at home (81% speak English very well , 13% speak English well , 6% speak English not well ).of residents speak other Indo-European language at home (83% speak English very well , 10% speak English well , 3% speak English not well , 4% don't speak English at all ).of residents speak Asian or Pacific Island language at home (78% speak English very well , 4% speak English not well , 18% don't speak English at all ).of residents speak other language at home (100% speak English very well ).
Foreign born population: 1,820 (8.7%)of them are naturalized citizens )
Median number of rooms in houses and condos:
Median number of rooms in apartments
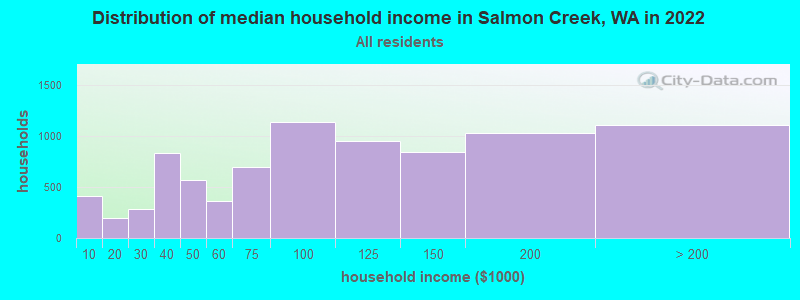
Salmon Creek, WA household income distribution 410 Less than $10,000199 $10,000 to $19,999285 $20,000 to $29,999830 $30,000 to $39,999569 $40,000 to $49,999360 $50,000 to $59,999698 $60,000 to $74,9991,138 $75,000 to $99,999953 $100,000 to $124,999848 $125,000 to $149,9991,031 $150,000 to $199,9991,110 $200,000 or more
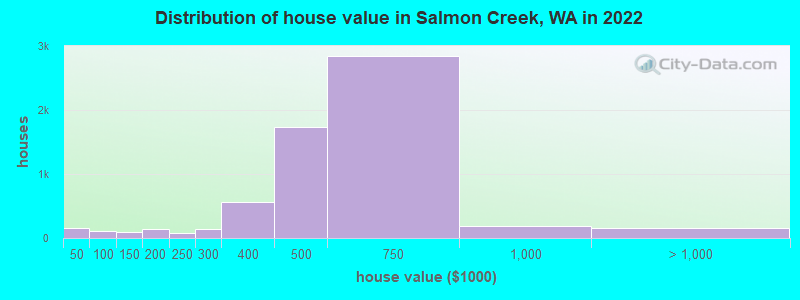
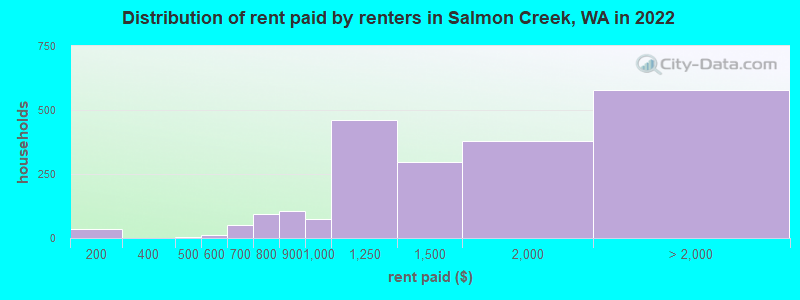
Home value of owner - occupied houses in 2022 in Salmon Creek, WA 93 Less than $10,00048 $25,000 to $29,9998 $30,000 to $34,99913 $50,000 to $59,99926 $60,000 to $69,99916 $70,000 to $79,99943 $80,000 to $89,9996 $90,000 to $99,99913 $100,000 to $124,99986 $125,000 to $149,99951 $150,000 to $174,99995 $175,000 to $199,99982 $200,000 to $249,999133 $250,000 to $299,999563 $300,000 to $399,9991,737 $400,000 to $499,9992,845 $500,000 to $749,999187 $750,000 to $999,99944 $1,000,000 to $1,499,999116 $2,000,000 or moreRent paid by renters in 2022 in Salmon Creek, WA 34 $150 to $1995 $450 to $49911 $550 to $59943 $600 to $6495 $650 to $69922 $700 to $74969 $750 to $799105 $800 to $89974 $900 to $999461 $1,000 to $1,249296 $1,250 to $1,499377 $1,500 to $1,999355 $2,000 to $2,4995 $2,500 to $2,99931 $3,000 to $3,499183 No cash rent
Percentage of workers working in this county: 79.2%Number of people working at home: 2,517 (25.5% of all workers )
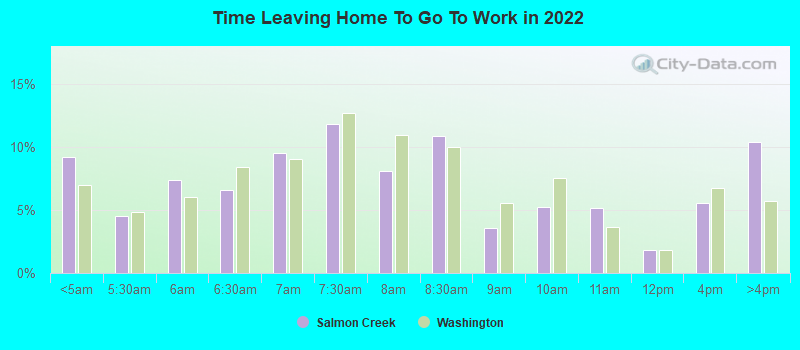
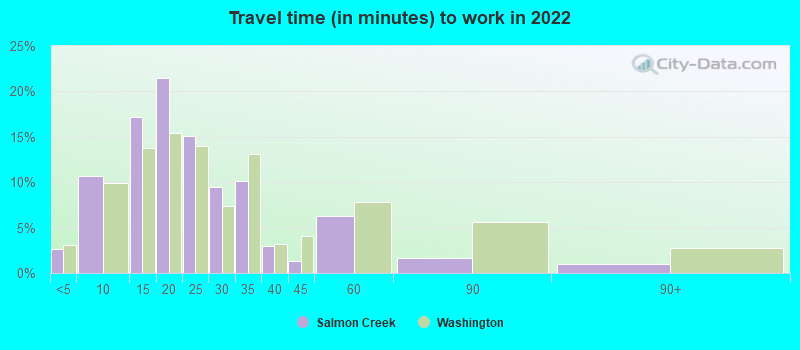
Travel time to work (commute)
Less than 5 minutes: 1505 to 9 minutes: 79510 to 14 minutes: 1,16015 to 19 minutes: 1,46020 to 24 minutes: 1,21625 to 29 minutes: 34230 to 34 minutes: 1,06735 to 39 minutes: 22240 to 44 minutes: 24745 to 59 minutes: 46460 to 89 minutes: 19690 or more minutes: 187
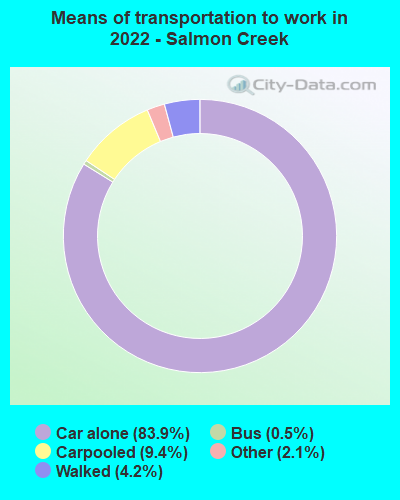
Means of transportation to work:
Drove a car alone: 5,207 (60.7%)Carpooled: 612 (7.1%)Bus : 21 (0.2%)Taxi: 78 (0.9%)Walked: 321 (3.7%)Worked at home: 2,517 (29.3%)
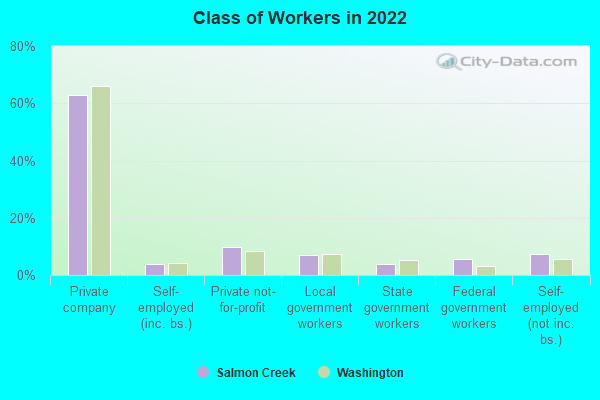
Unemployment by race in 2022
Unemployment rate for White non-Hispanic residents 2.9% Males1.8% FemalesUnemployment rate for two or more race residents 14.0% MalesUnemployment rate for Hispanic or Latino residents 3.7% Males
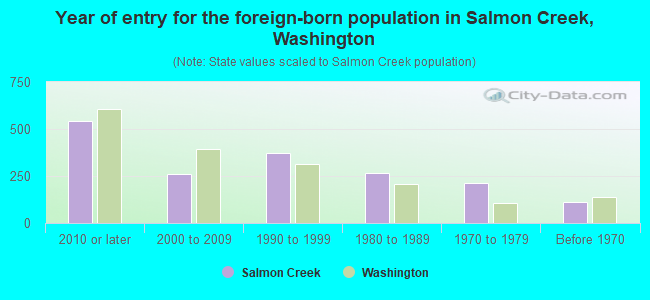
Year of entry for the foreign-born population in Salmon Creek, Washington
544 2010 or later 258 2000 to 2009 374 1990 to 1999 267 1980 to 1989 212 1970 to 1979 111 Before 1970
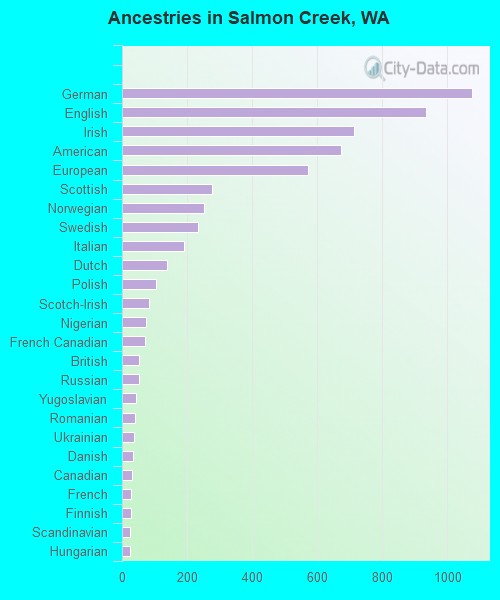
First ancestries reported:
German: 1,074 (12.4%)
English: 934 (10.8%)
Irish: 713 (8.2%)
American: 672 (7.7%)
European: 571 (6.6%)
Scottish: 278 (3.2%)
Norwegian: 253 (2.9%)
Swedish: 232 (2.7%)
Italian: 190 (2.2%)
Dutch: 138 (1.6%)
Polish: 103 (1.2%)
Scotch-Irish: 82 (0.9%)
Nigerian: 73 (0.8%)
French Canadian: 70 (0.8%)
British: 52 (0.6%)
Russian: 52 (0.6%)
Yugoslavian: 42 (0.5%)
Romanian: 40 (0.5%)
Ukrainian: 36 (0.4%)
Danish: 34 (0.4%)
Canadian: 30 (0.3%)
French: 29 (0.3%)
Finnish: 27 (0.3%)
Scandinavian: 25 (0.3%)
Hungarian: 24 (0.3%)
Eastern European: 18 (0.2%)
Slovak: 13 (0.1%)
Czech: 12 (0.1%)
Portuguese: 7 (0.08%)
Greek: 7 (0.08%)
Swiss: 7 (0.08%)
Slavic: 4 (0.05%)
Lebanese: 2 (0.02%)
Northern European: 1 (0.01%) Most common places of birth for foreign-born residents (%): Mexico Salmon Creek:
21.2% (415)Washington:
21.1% (241,655)
China, excluding Hong Kong and Taiwan Salmon Creek:
10.5% (206)Washington:
7.4% (84,470)
Canada Salmon Creek:
8.6% (168)Washington:
4.1% (47,238)
Vietnam Salmon Creek:
8.2% (160)Washington:
5.4% (62,003)
Philippines Salmon Creek:
5.8% (113)Washington:
6.3% (71,661)
Bahamas Salmon Creek:
4.7% (92)Washington:
0.0% (164)
Ukraine Salmon Creek:
4.5% (88)Washington:
3.1% (35,872)
Taiwan Salmon Creek:
3.8% (75)Washington:
1.5% (16,607)
Uruguay Salmon Creek:
3.5% (68)Washington:
0.0% (396)
El Salvador Salmon Creek:
3.4% (66)Washington:
1.2% (13,745)
Russia Salmon Creek:
3.3% (65)Washington:
1.9% (21,540)
Cambodia Salmon Creek:
2.7% (52)Washington:
1.0% (10,993)
Germany Salmon Creek:
2.2% (44)Washington:
1.6% (17,761)
Korea Salmon Creek:
1.5% (30)Washington:
4.3% (48,886)
Place of birth for U.S.-born residents:
This state: 6,877Other state: 11,944Northeast: 645Midwest: 2,025South: 1,016West: 8,185 89.2% of Salmon Creek residents lived in the same house 1 years ago.
Out of people who lived in different houses, 28.8% lived in this county.
Out of people who lived in different counties, 24.1% lived in Washington.
Salmon Creek:
89.2%State average:
85.2%
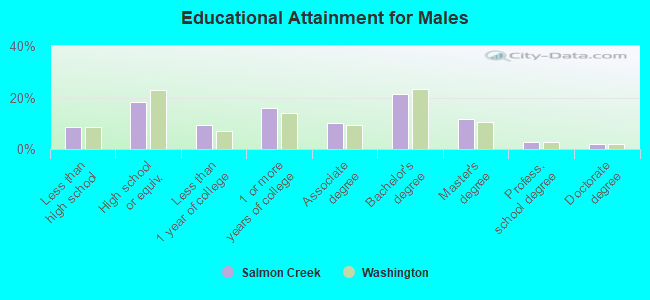
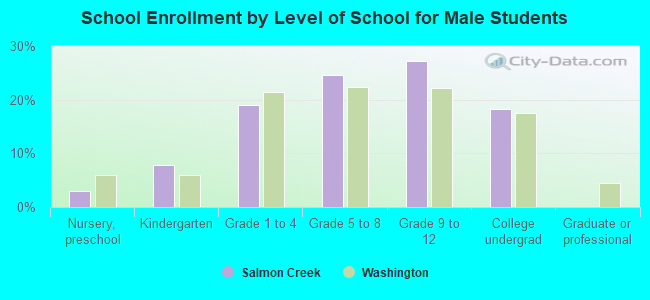
Education attainment for males 25 years and older:
No schooling: 10Nursery to 4th grade: 05th and 6th grade: 07th and 8th grade: 2149th grade: 1510th grade: 5011th grade: 8512th grade, no diploma: 258High school graduate (or equivalency): 1,365Less than 1 year of college: 692Some college more than 1 year, no degree: 1,186Associate degree: 757Bachelor's degree: 1,583Master's degree: 877Professional school degree: 200Doctorate degree: 139
Education attainment for females 25 years and older:
No schooling: 165Nursery to 4th grade: 05th and 6th grade: 07th and 8th grade: 3089th grade: 5210th grade: 6011th grade: 4612th grade, no diploma: 71High school graduate (or equivalency): 1,626Less than 1 year of college: 667Some college more than 1 year, no degree: 1,209Associate degree: 1,178Bachelor's degree: 1,669Master's degree: 851Professional school degree: 99Doctorate degree: 102
Housing units in structures:
One, detached: 6,428One, attached: 484Two: 993 or 4: 2105 to 9: 27310 to 19: 33220 to 49: 21750 or more: 174Mobile homes: 299Housing units lacking complete plumbing facilities in 2022: 0.2%Housing units lacking complete kitchen facilities in 2022: 0.2%House/condo owner moved in on average 13 years ago
Renter moved in on average 6 years ago
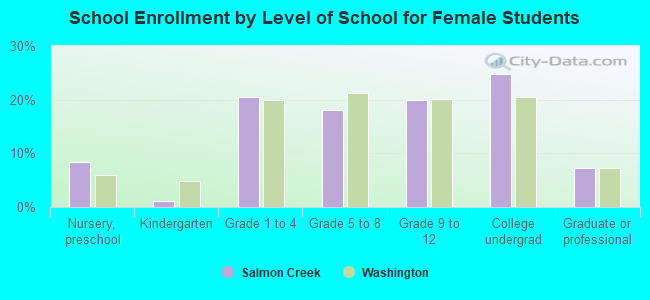
Private vs. public school enrollment:
Students in private schools in grades 1 to 8 (elementary and middle school): 120 Here:
6.7%Washington:
12.4%
Students in private schools in grades 9 to 12 (high school): 128 Here:
12.8%Washington:
9.2%
Students in private undergraduate colleges: 143 Here:
15.1%Washington:
16.5%