San Angelo, TX (Texas) Houses and Residents
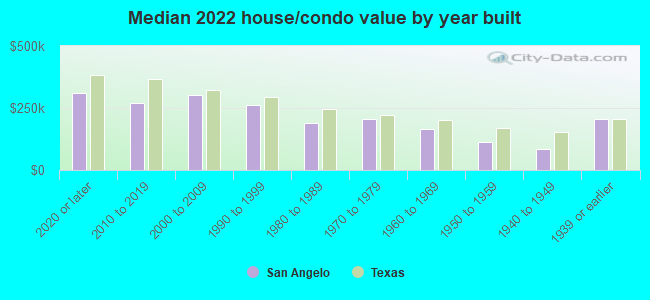
| San Angelo: | $188,600 |
| Texas: | $275,400 |
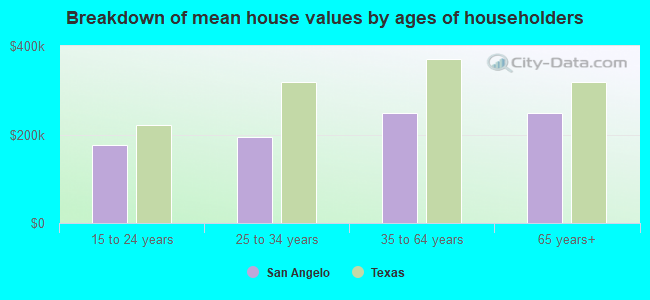
Mean price in 2022:
Detached houses: $228,294
Here: $228,294 State: $369,058 Townhouses or other attached units: $190,217
Here: $190,217 State: $327,631 In 2-unit structures: $226,227
Here: $226,227 State: $374,947 In 3-to-4-unit structures: $174,044
Here: $174,044 State: $209,652 In 5-or-more-unit structures: $166,501
Here: $166,501 State: $413,944 Mobile homes: $65,388
Here: $65,388 State: $124,413
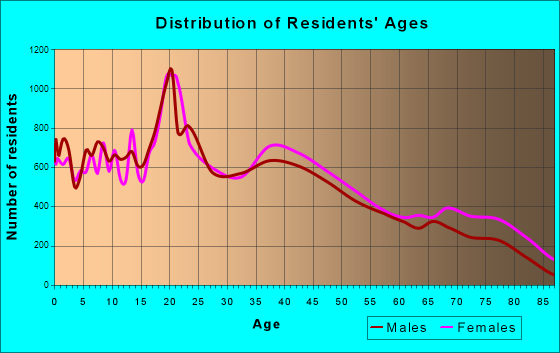
Total population: 98,975 (Urban population: 86,660, Rural population: 1,949 (all nonfarm))
Houses: 45,574 (40,516 occupied: 24,853 owner occupied, 15,663 renter occupied)
| % of renters here: | 39% |
| State: | 38% |
Housing density: 815 houses/condos per square mile
Median price asked for vacant for-sale houses and condos in 2022: $104,121.
Median contract rent in 2022: $925 (lower quartile is $725, upper quartile is $1,219)
Median rent asked for vacant for-rent units in 2022: $1,722
Median gross rent in San Angelo, TX in 2022: $1,123
Housing units in San Angelo with a mortgage: 12,867 (299 second mortgage, 0 home equity loan, 212 both second mortgage and home equity loan)
Houses without a mortgage: 204
Median household income for houses/condos with a mortgage: $87,675
Median household income for apartments without a mortgage: $56,076
Median monthly housing costs: $1,082
Compare current foreclosures in San Angelo, TX:
| Photo | Address | Area | Beds / Baths | Price | Details |
|---|---|---|---|---|---|

|
#1
Nottingham Trl
San Angelo, TX 76901
|
1,268 sq. feet
|
3 baths 4 beds |
show details | |

|
#2
North St
San Angelo, TX 76901
|
1,408 sq. feet
|
2 baths 3 beds |
show details | |

|
#3
Woodland Cir
San Angelo, TX 76904
|
1,982 sq. feet
|
3 baths 3 beds |
show details | |

|
#4
S Madison St
San Angelo, TX 76901
|
2,129 sq. feet
|
2 baths 4 beds |
show details | |

|
#5
Elk Run
San Angelo, TX 76901
|
- sq. feet
|
2 baths 3 beds |
show details | |

|
#6
Forest Park Ave
San Angelo, TX 76901
|
1,212 sq. feet
|
- baths - beds |
show details | |

|
#7
Coleman St
San Angelo, TX 76901
|
1,272 sq. feet
|
- baths - beds |
show details | |

|
#8
Alma Jo Dr
San Angelo, TX 76905
|
1,372 sq. feet
|
- baths - beds |
show details | |

|
#9
Hummingbird Ln
San Angelo, TX 76904
|
1,620 sq. feet
|
- baths - beds |
show details | |

|
#10
N Poe St
San Angelo, TX 76903
|
- sq. feet
|
- baths - beds |
show details |
| Photo | Address | Area | Beds / Baths | Price | Details |
|---|---|---|---|---|---|

|
#11
Leopard Ln
San Angelo, TX 76901
|
- sq. feet
|
- baths - beds |
show details | |

|
#12
Beaty Rd
San Angelo, TX 76904
|
1,540 sq. feet
|
- baths - beds |
show details | |

|
#13
Pulliam St
San Angelo, TX 76905
|
- sq. feet
|
- baths - beds |
show details | |

|
#14
Bobby Jones Road
San Angelo, TX 76904
|
- sq. feet
|
- baths - beds |
show details | |

|
#15
Kenwood Dr
San Angelo, TX 76903
|
1,860 sq. feet
|
- baths - beds |
show details | |

|
#16
S Monroe St
San Angelo, TX 76901
|
1,294 sq. feet
|
- baths - beds |
show details | |

|
#17
Kansas Ave
San Angelo, TX 76904
|
1,535 sq. feet
|
- baths - beds |
show details | |

|
#18
E 10th St
San Angelo, TX 76903
|
624 sq. feet
|
- baths - beds |
show details | |

|
#19
Westover Ter
San Angelo, TX 76904
|
1,625 sq. feet
|
- baths - beds |
show details | |

|
#20
E 9th St
San Angelo, TX 76903
|
840 sq. feet
|
- baths - beds |
show details |
| Photo | Address | Area | Beds / Baths | Price | Details |
|---|---|---|---|---|---|

|
#21
Pulliam St Apt 6
San Angelo, TX 76905
|
- sq. feet
|
- baths - beds |
show details | |

|
#22
Oriole Dr
San Angelo, TX 76903
|
1,774 sq. feet
|
- baths - beds |
show details | |

|
#23
N Fm 2288
San Angelo, TX 76901
|
- sq. feet
|
- baths - beds |
show details | |

|
#24
W Loop 306, Apt 10603
San Angelo, TX 76904
|
- sq. feet
|
- baths - beds |
show details | |

|
#25
W Avenue M
San Angelo, TX 76903
|
1,064 sq. feet
|
- baths - beds |
show details | |

|
#26
S Jackson St
San Angelo, TX 76901
|
1,472 sq. feet
|
- baths - beds |
show details | |

|
#27
W Avenue J
San Angelo, TX 76901
|
2,008 sq. feet
|
- baths - beds |
show details | |

|
#28
Briargrove Ln
San Angelo, TX 76904
|
2,365 sq. feet
|
- baths - beds |
show details | |

|
#29
W Avenue C
San Angelo, TX 76903
|
- sq. feet
|
- baths - beds |
show details | |

|
#30
E Parkway St
San Angelo, TX 76901
|
2,730 sq. feet
|
- baths - beds |
show details |
| Photo | Address | Area | Beds / Baths | Price | Details |
|---|---|---|---|---|---|

|
#31
Clare Dr
San Angelo, TX 76904
|
1,656 sq. feet
|
- baths - beds |
show details | |

|
#32
Grey Wolf Ln
San Angelo, TX 76901
|
- sq. feet
|
- baths - beds |
show details | |

|
#33
A And M Ave
San Angelo, TX 76904
|
- sq. feet
|
- baths - beds |
show details | |

|
#34
E 24th St
San Angelo, TX 76903
|
1,291 sq. feet
|
- baths - beds |
show details | |

|
#35
Coke St
San Angelo, TX 76903
|
1,008 sq. feet
|
- baths - beds |
show details | |

|
#36
Maple Ln
San Angelo, TX 76901
|
- sq. feet
|
- baths - beds |
show details | |

|
#37
Executive Dr
San Angelo, TX 76904
|
- sq. feet
|
- baths - beds |
show details | |

|
#38
Patrick St
San Angelo, TX 76904
|
2,739 sq. feet
|
- baths - beds |
show details | |

|
#39
Linda Lee Dr
San Angelo, TX 76905
|
1,158 sq. feet
|
- baths - beds |
show details | |

|
#40
Bryan St
San Angelo, TX 76903
|
1,310 sq. feet
|
- baths - beds |
show details |
| Photo | Address | Area | Beds / Baths | Price | Details |
|---|---|---|---|---|---|

|
#41
Reece Rd
San Angelo, TX 76904
|
- sq. feet
|
- baths - beds |
show details | |

|
#42
Club House Ln
San Angelo, TX 76904
|
- sq. feet
|
- baths - beds |
show details | |

|
#43
Wrangler Ln
San Angelo, TX 76904
|
1,738 sq. feet
|
- baths - beds |
show details | |

|
#44
Rice Ave
San Angelo, TX 76904
|
1,415 sq. feet
|
- baths - beds |
show details | |

|
#45
Hillcrest Dr
San Angelo, TX 76904
|
2,439 sq. feet
|
- baths - beds |
show details | |

|
#46
Scout St
San Angelo, TX 76903
|
- sq. feet
|
- baths - beds |
show details | |

|
#47
Lyndhurst Dr
San Angelo, TX 76901
|
1,826 sq. feet
|
- baths - beds |
show details | |

|
#48
Raney St
San Angelo, TX 76901
|
1,312 sq. feet
|
- baths - beds |
show details | |

|
#49
S Country Club Rd
San Angelo, TX 76904
|
2,749 sq. feet
|
- baths - beds |
show details | |

|
Check over 1 million property listings on Foreclosure.com!
|
browse all offers | |||


 | Why are San Angelo homes so expensive? (11 replies) |
| San Angelo Cheap Apartments for Single Mom? (2 replies) |
| Apartments in San Angelo, TX (7 replies) |
| Alternative Housing-Friendly Counties in the Hill Country and Central Texas (9 replies) |
| Homeschool Family in Search of Texas Location (18 replies) |
| What does anyone know about San Angelo (27 replies) |
Median year apartment built: 1980
Household type by relationship:
Households: 99,871- Male householders: 19,774 (5,433 living alone), Female householders: 20,742 (5,589 living alone)
18,174 spouses (17,945 opposite-sex spouses), 3,244 unmarried partners, (3,116 opposite-sex unmarried partners), 26,210 children (24,732 natural, 320 adopted, 1,158 stepchildren), 3,370 grandchildren, 669 brothers or sisters, 879 parents, 249 foster children, 1,353 other relatives, 1,780 non-relatives
- In group quarters: 3,427
Size of family households: 14,462 2-persons, 3,754 3-persons, 4,783 4-persons, 2,207 5-persons, 1,203 6-persons, 274 7-or-more-persons.
Size of nonfamily households: 11,022 1-person, 2,420 2-persons, 76 3-persons, 315 4-persons.
12,606 married couples with children.
6,870 single-parent households (1,687 men, 5,183 women).
74.8% of residents of San Angelo speak English at home.
23.6% of residents speak Spanish at home (75% speak English very well, 15% speak English well, 8% speak English not well, 3% don't speak English at all).
0.9% of residents speak other Indo-European language at home (91% speak English very well, 8% speak English well, 1% speak English not well).
0.7% of residents speak Asian or Pacific Island language at home (59% speak English very well, 32% speak English well, 9% speak English not well).
0.2% of residents speak other language at home (71% speak English very well, 29% speak English well).
Foreign born population: 6,053 (6.1%)
(54.2% of them are naturalized citizens)
| Here: | 5.9 |
| State: | 6.3 |
| Here: | 4.2 |
| State: | 4.0 |
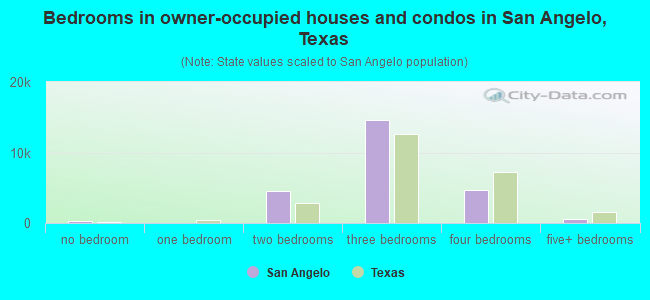
- Bedrooms in owner-occupied houses and condos in San Angelo, Texas
- 281no bedroom
- 131 bedroom
- 4,5242 bedrooms
- 14,6783 bedrooms
- 4,7284 bedrooms
- 6295+ bedrooms
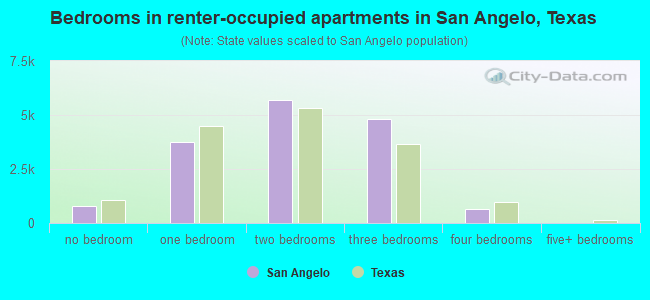
- Bedrooms in renter-occupied apartments in San Angelo, Texas
- 769no bedroom
- 3,7271 bedroom
- 5,7152 bedrooms
- 4,7933 bedrooms
- 6594 bedrooms
- 05+ bedrooms
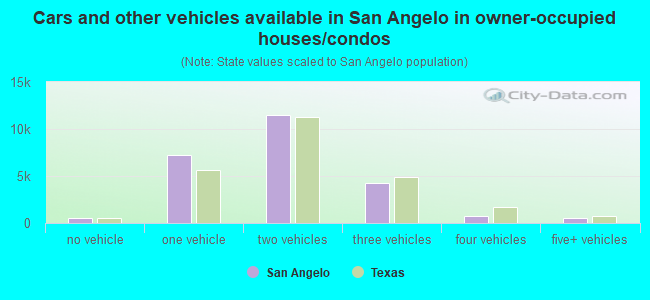
- Cars and other vehicles available in San Angelo in owner-occupied houses/condos
- 539no vehicle
- 7,2681 vehicle
- 11,5222 vehicles
- 4,2643 vehicles
- 7124 vehicles
- 5485+ vehicles
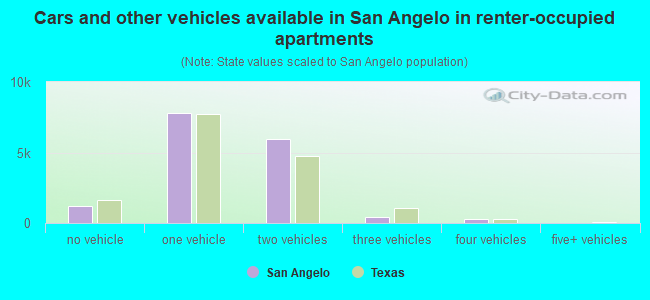
- Cars and other vehicles available in San Angelo in renter-occupied apartments
- 1,183no vehicle
- 7,7941 vehicle
- 5,9662 vehicles
- 4053 vehicles
- 3154 vehicles
- 05+ vehicles
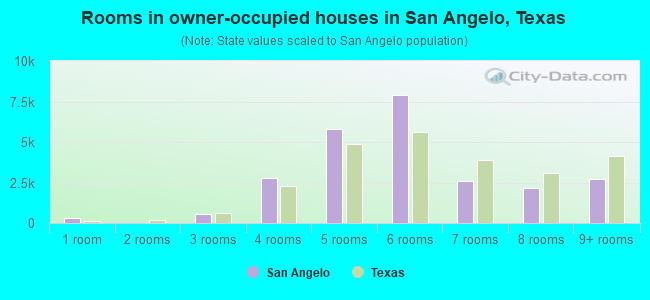
- Rooms in owner-occupied houses in San Angelo, Texas
- 2811 room
- 02 rooms
- 5633 rooms
- 2,8034 rooms
- 5,8335 rooms
- 7,9096 rooms
- 2,6037 rooms
- 2,1638 rooms
- 2,6989+ rooms
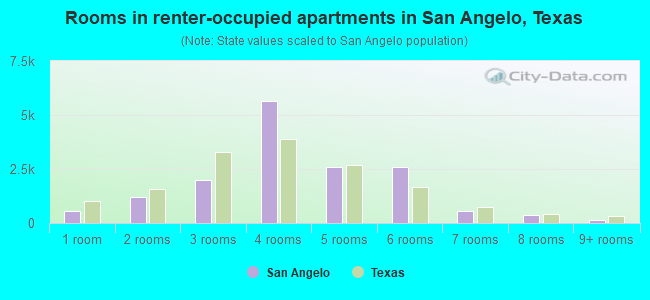
- Rooms in renter-occupied apartments in San Angelo, Texas
- 5721 room
- 1,1882 rooms
- 1,9843 rooms
- 5,6694 rooms
- 2,5865 rooms
- 2,5966 rooms
- 5387 rooms
- 3738 rooms
- 1579+ rooms
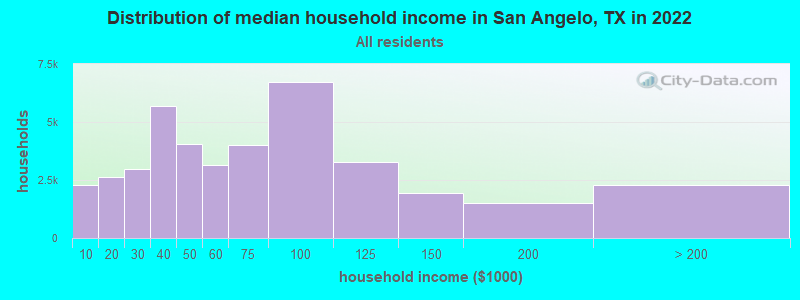
San Angelo, TX household income distribution

- 2,283Less than $10,000
- 2,646$10,000 to $19,999
- 2,977$20,000 to $29,999
- 5,685$30,000 to $39,999
- 4,049$40,000 to $49,999
- 3,167$50,000 to $59,999
- 3,989$60,000 to $74,999
- 6,707$75,000 to $99,999
- 3,257$100,000 to $124,999
- 1,959$125,000 to $149,999
- 1,520$150,000 to $199,999
- 2,277$200,000 or more
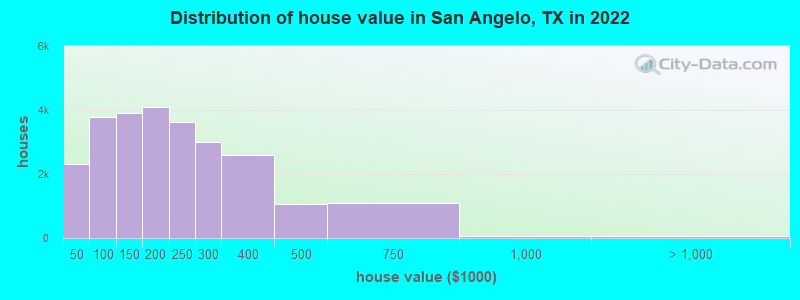
Home value of owner - occupied houses in 2022 in San Angelo, TX
-
- 672Less than $10,000
- 183$10,000 to $14,999
- 187$15,000 to $19,999
- 183$25,000 to $29,999
- 166$30,000 to $34,999
- 196$35,000 to $39,999
- 718$40,000 to $49,999
- 581$50,000 to $59,999
- 397$60,000 to $69,999
- 425$70,000 to $79,999
- 1,152$80,000 to $89,999
- 522$90,000 to $99,999
- 2,201$100,000 to $124,999
- 1,696$125,000 to $149,999
- 2,026$150,000 to $174,999
- 2,058$175,000 to $199,999
- 3,631$200,000 to $249,999
- 2,997$250,000 to $299,999
- 2,586$300,000 to $399,999
- 1,052$400,000 to $499,999
- 1,096$500,000 to $749,999
- 51$750,000 to $999,999
- 77$1,500,000 to $1,999,999
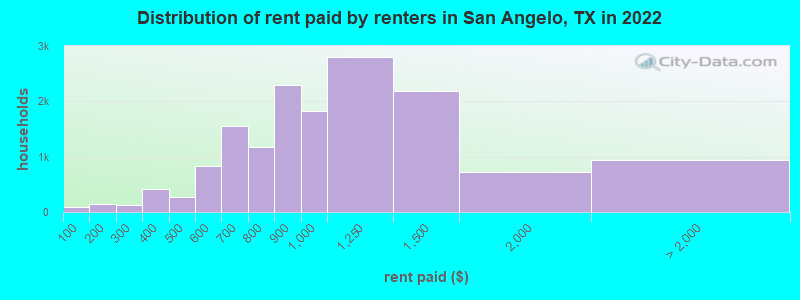
Rent paid by renters in 2022 in San Angelo, TX
-
- 94Less than $100
- 37$100 to $149
- 115$150 to $199
- 67$200 to $249
- 55$250 to $299
- 309$300 to $349
- 105$350 to $399
- 124$400 to $449
- 153$450 to $499
- 602$500 to $549
- 228$550 to $599
- 636$600 to $649
- 925$650 to $699
- 354$700 to $749
- 821$750 to $799
- 2,297$800 to $899
- 1,820$900 to $999
- 2,804$1,000 to $1,249
- 2,187$1,250 to $1,499
- 720$1,500 to $1,999
- 288$2,000 to $2,499
- 19$2,500 to $2,999
- 48$3,000 to $3,499
- 58$3,500 or more
- 521No cash rent
Percentage of workers working in this county: 93.6%
Number of people working at home: 3,927 (8.2% of all workers)
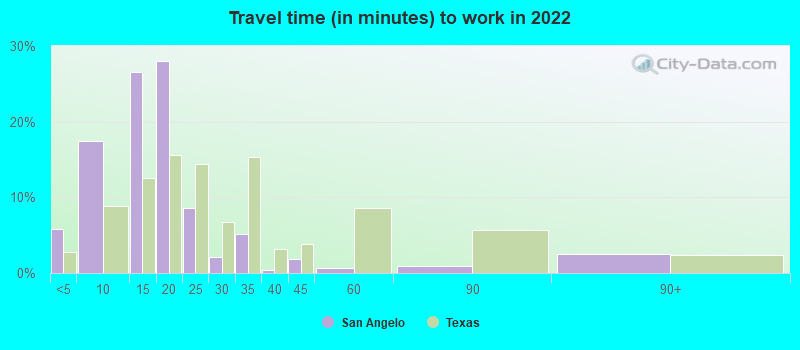
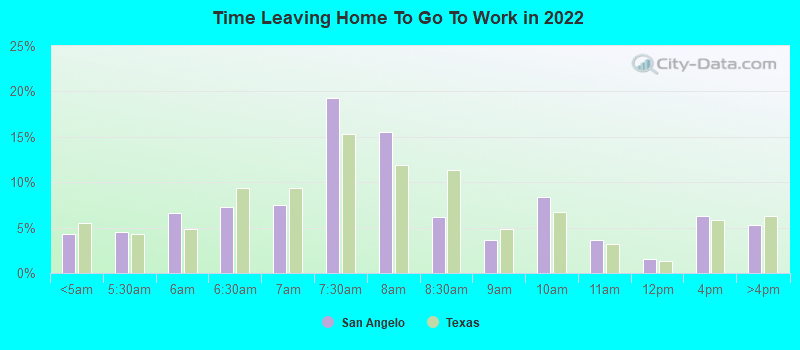
Travel time to work (commute)
- Less than 5 minutes: 2,694
- 5 to 9 minutes: 8,865
- 10 to 14 minutes: 12,584
- 15 to 19 minutes: 11,751
- 20 to 24 minutes: 2,643
- 25 to 29 minutes: 903
- 30 to 34 minutes: 665
- 35 to 39 minutes: 67
- 40 to 44 minutes: 636
- 45 to 59 minutes: 100
- 60 to 89 minutes: 881
- 90 or more minutes: 1,598
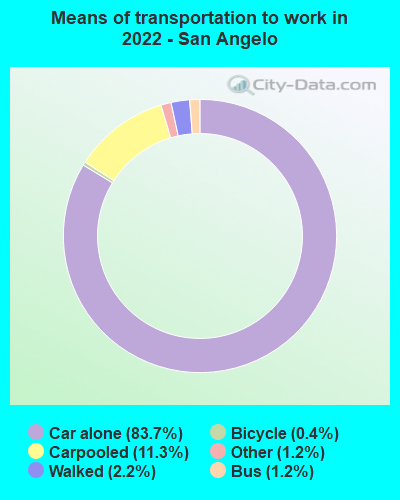
Means of transportation to work:
- Drove a car alone: 36,759 (76.2%)
- Carpooled: 4,971 (10.3%)
- Bus: 538 (1.1%)
- Taxi: 528 (1.1%)
- Bicycle: 160 (0.3%)
- Walked: 956 (2.0%)
- Worked at home: 4,303 (8.9%)
- Unemployment by race in 2022
- Unemployment rate for White non-Hispanic residents
- 2.7%Males
- 4.3%Females
- Unemployment rate for Black residents
- 0.3%Males
- 6.2%Females
- Unemployment rate for Asian residents
- 1.3%Females
- Unemployment rate for other race residents
- 0.7%Males
- 2.4%Females
- Unemployment rate for two or more race residents
- 2.3%Males
- 1.6%Females
- Unemployment rate for Hispanic or Latino residents
- 1.3%Males
- 1.0%Females
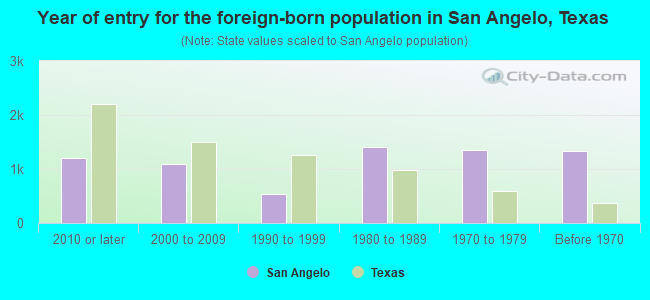
- Year of entry for the foreign-born population in San Angelo, Texas
- 1,2032010 or later
- 1,0992000 to 2009
- 5301990 to 1999
- 1,4021980 to 1989
- 1,3451970 to 1979
- 1,334Before 1970
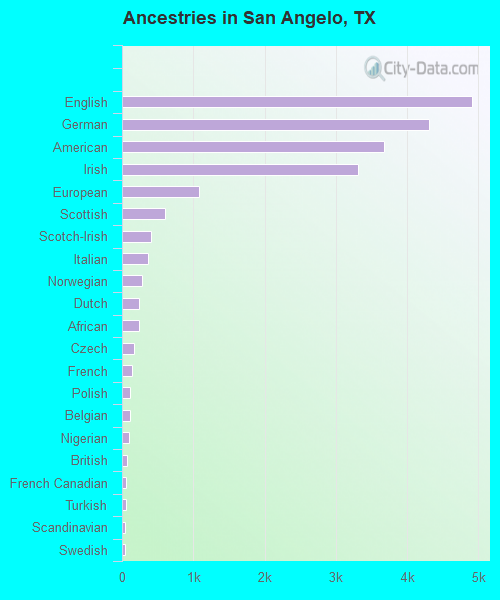
First ancestries reported:
- English: 4,903 (8.3%)
- German: 4,302 (7.3%)
- American: 3,677 (6.2%)
- Irish: 3,311 (5.6%)
- European: 1,078 (1.8%)
- Scottish: 598 (1.0%)
- Scotch-Irish: 401 (0.7%)
- Italian: 364 (0.6%)
- Norwegian: 279 (0.5%)
- Dutch: 238 (0.4%)
- African: 236 (0.4%)
- Czech: 169 (0.3%)
- French: 135 (0.2%)
- Polish: 113 (0.2%)
- Belgian: 110 (0.2%)
- Nigerian: 92 (0.2%)
- British: 77 (0.1%)
- French Canadian: 63 (0.1%)
- Turkish: 54 (0.09%)
- Scandinavian: 47 (0.08%)
- Swedish: 45 (0.08%)
- Haitian: 42 (0.07%)
- Swiss: 41 (0.07%)
- Czechoslovakian: 40 (0.07%)
- Jamaican: 40 (0.07%)
- Slavic: 37 (0.06%)
- Kenyan: 36 (0.06%)
- Welsh: 34 (0.06%)
- Portuguese: 32 (0.05%)
- British West Indian: 31 (0.05%)
- Iraqi: 30 (0.05%)
- Russian: 30 (0.05%)
- West Indian: 29 (0.05%)
- Austrian: 25 (0.04%)
- Cajun: 25 (0.04%)
- Finnish: 18 (0.03%)
- Ukrainian: 12 (0.02%)
- Yugoslavian: 12 (0.02%)
- Lebanese: 11 (0.02%)
- Pennsylvania German: 10 (0.02%)
- Brazilian: 7 (0.01%)
- Arab: 6 (0.01%)
- Northern European: 4 (0.01%)
Most common places of birth for foreign-born residents (%):
| San Angelo: | 65.3% (3,834) |
| Texas: | 48.4% (2,411,723) |
| San Angelo: | 3.7% (217) |
| Texas: | 1.5% (72,413) |
| San Angelo: | 2.7% (159) |
| Texas: | 2.1% (103,148) |
| San Angelo: | 2.6% (152) |
| Texas: | 1.1% (55,371) |
| San Angelo: | 2.1% (124) |
| Texas: | 1.2% (60,172) |
| San Angelo: | 2.0% (118) |
| Texas: | 0.3% (13,763) |
Place of birth for U.S.-born residents:
- This state: 69,277
- Other state: 23,671
- Northeast: 1,984
- Midwest: 3,506
- South: 8,622
- West: 9,559
83.2% of San Angelo residents lived in the same house 1 years ago.
Out of people who lived in different houses, 38.2% lived in this county.
Out of people who lived in different counties, 38.8% lived in Texas.
| San Angelo: | 83.2% |
| State average: | 85.7% |
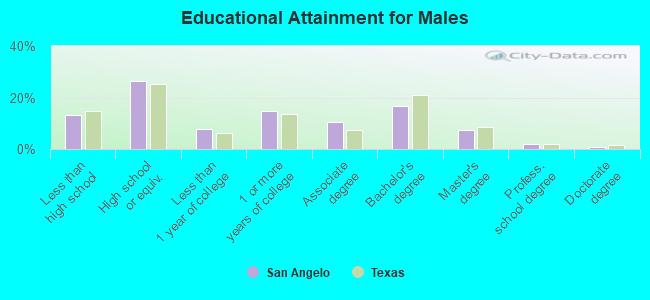
Education attainment for males 25 years and older:
- No schooling: 1,282
- Nursery to 4th grade: 235
- 5th and 6th grade: 191
- 7th and 8th grade: 40
- 9th grade: 458
- 10th grade: 127
- 11th grade: 578
- 12th grade, no diploma: 1,223
- High school graduate (or equivalency): 8,259
- Less than 1 year of college: 2,470
- Some college more than 1 year, no degree: 4,661
- Associate degree: 3,324
- Bachelor's degree: 5,264
- Master's degree: 2,247
- Professional school degree: 575
- Doctorate degree: 238
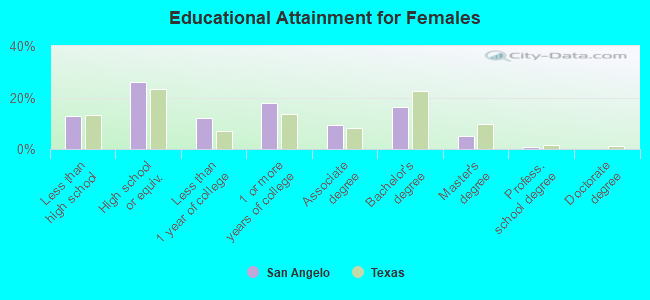
Education attainment for females 25 years and older:
- No schooling: 655
- Nursery to 4th grade: 116
- 5th and 6th grade: 454
- 7th and 8th grade: 629
- 9th grade: 244
- 10th grade: 811
- 11th grade: 586
- 12th grade, no diploma: 773
- High school graduate (or equivalency): 8,606
- Less than 1 year of college: 3,974
- Some college more than 1 year, no degree: 5,969
- Associate degree: 3,033
- Bachelor's degree: 5,334
- Master's degree: 1,635
- Professional school degree: 242
- Doctorate degree: 0
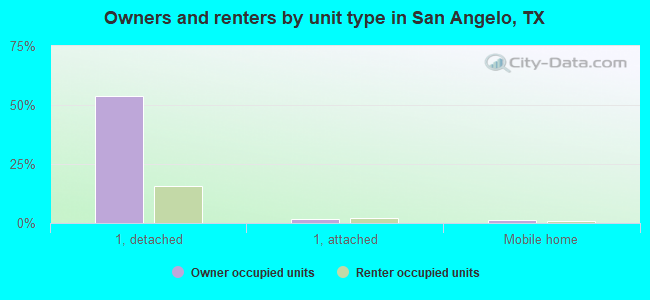
Housing units in structures:
- One, detached: 32,521
- One, attached: 2,023
- Two: 53
- 3 or 4: 935
- 5 to 9: 2,120
- 10 to 19: 2,586
- 20 to 49: 1,132
- 50 or more: 2,951
- Mobile homes: 1,253
Median worth of mobile homes: $9,999
Housing units lacking complete kitchen facilities in 2022: 3.6%
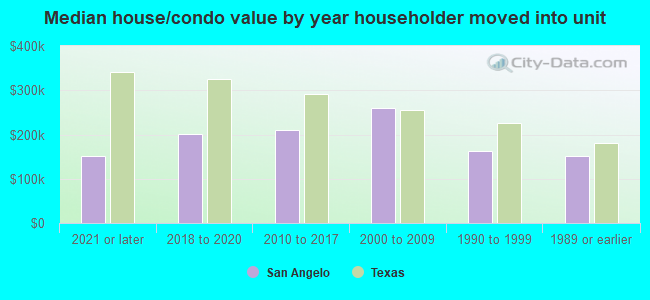
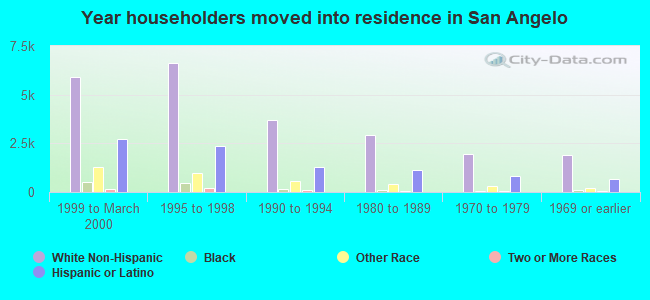
House/condo owner moved in on average 9 years ago
Renter moved in on average 1 years ago
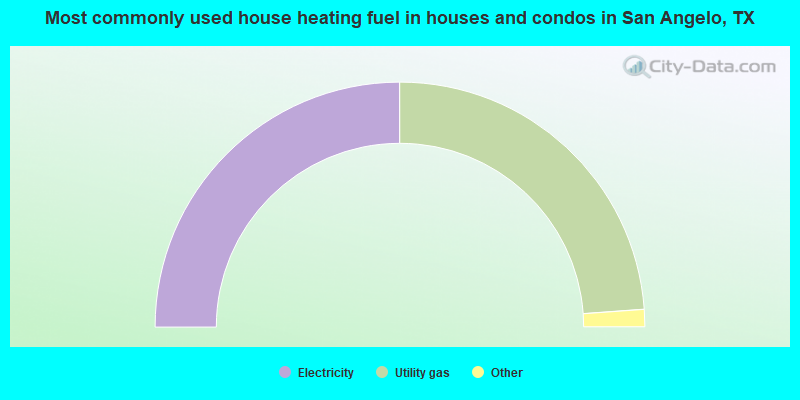
- 50.0%Electricity
- 47.8%Utility gas
- 1.9%Bottled, tank, or LP gas
- 0.2%Other fuel
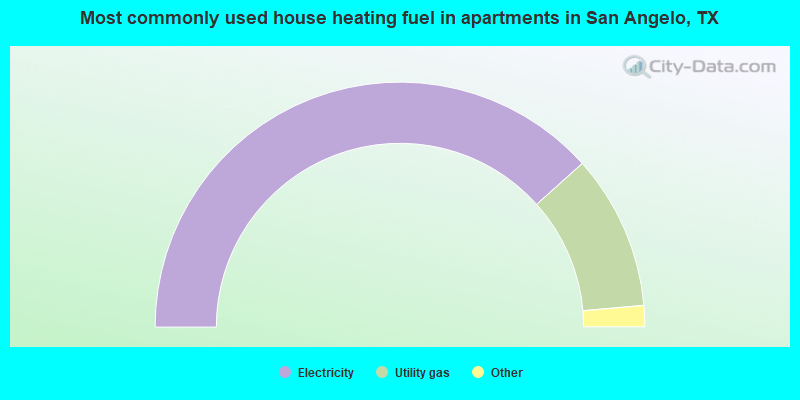
- 76.8%Electricity
- 20.5%Utility gas
- 1.5%Bottled, tank, or LP gas
- 0.7%No fuel used
- 0.4%Other fuel
- 0.2%Solar energy
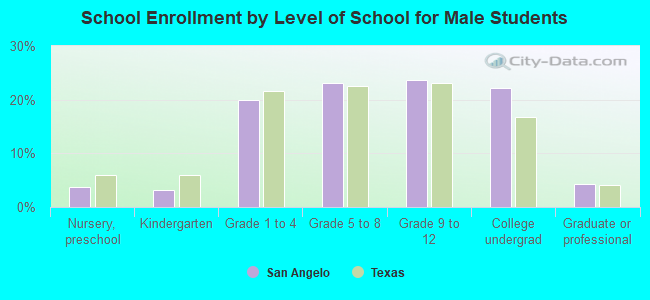
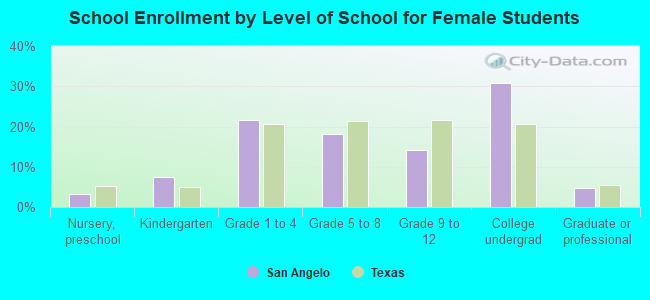
Private vs. public school enrollment:
| Here: | 9.8% |
| Texas: | 8.8% |
| Here: | 5.9% |
| Texas: | 8.0% |
| Here: | 8.4% |
| Texas: | 16.2% |