Housing density: 1,997 houses/condos per square mile
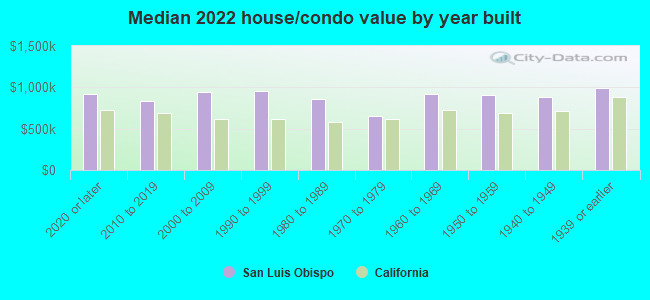
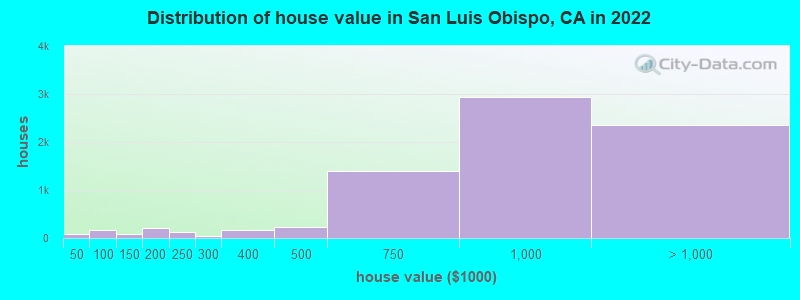
Median price asked for vacant for-sale houses and condos in 2022: $721,592.
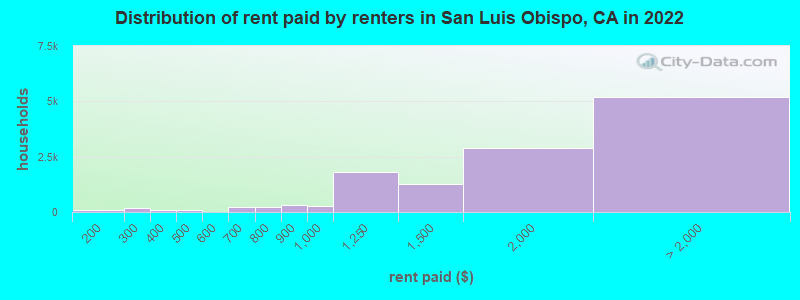
Median contract rent in 2022: $1,795 (lower quartile is $1,241, upper quartile is over $2,000)
Median rent asked for vacant for-rent units in 2022: $2,241
Median gross rent in San Luis Obispo, CA in 2022: $1,898
Housing units in San Luis Obispo with a mortgage: 4,475 (399 second mortgage, 20 home equity loan, 387 both second mortgage and home equity loan) Houses without a mortgage: 100
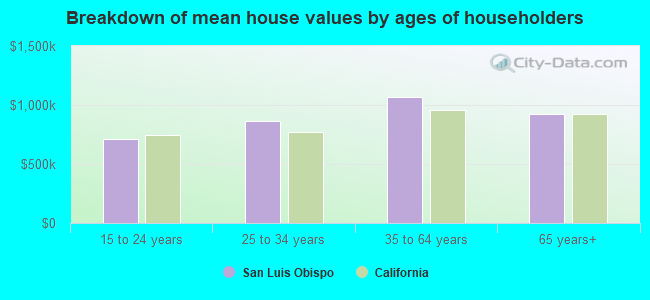
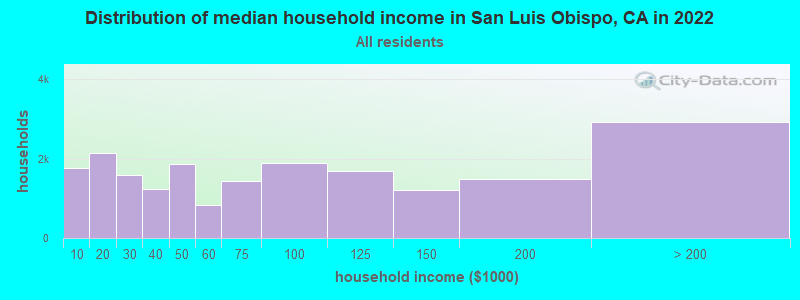
Median household income for houses/condos with a mortgage: $149,122
Median household income for apartments without a mortgage: $86,537
Median monthly housing costs: $1,805
Compare current foreclosures near San Luis Obispo, CA:
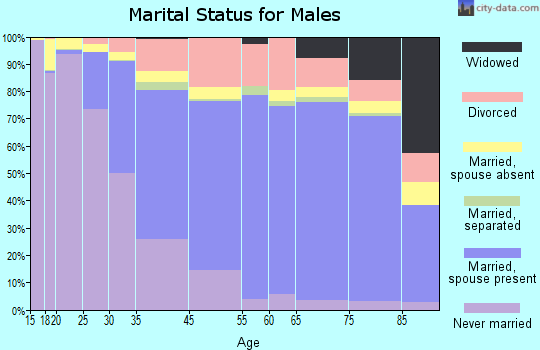
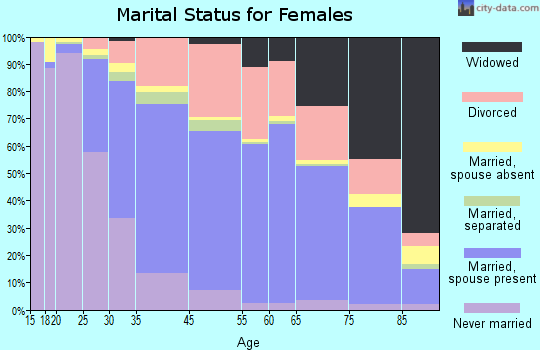
3,453 married couples with children.
1,023 single-parent households (355 men, 668 women).
81.6% of residents of San Luis Obispo speak English at home.
10.1% of residents speak Spanish at home (77% speak English very well, 9% speak English well, 11% speak English not well, 3% don't speak English at all).
3.5% of residents speak other Indo-European language at home (87% speak English very well, 7% speak English well, 4% speak English not well, 1% don't speak English at all).
3.2% of residents speak Asian or Pacific Island language at home (77% speak English very well, 15% speak English well, 7% speak English not well, 1% don't speak English at all).
0.8% of residents speak other language at home (92% speak English very well, 8% speak English well).
Foreign born population: 3,992 (8.4%)
(57.8% of them are naturalized citizens)
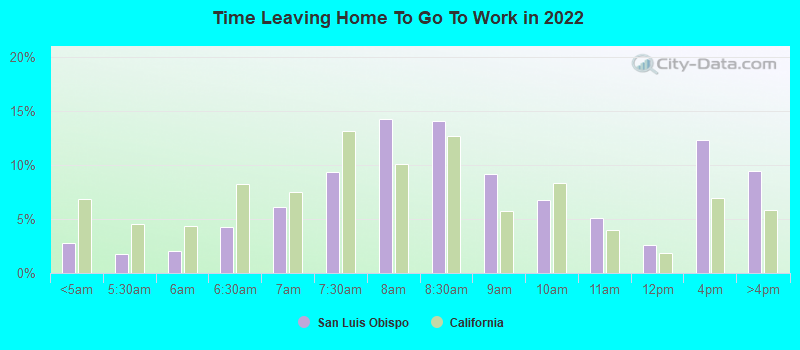
Percentage of workers working in this county: 93.8% Number of people working at home: 4,349 (17.4% of all workers)
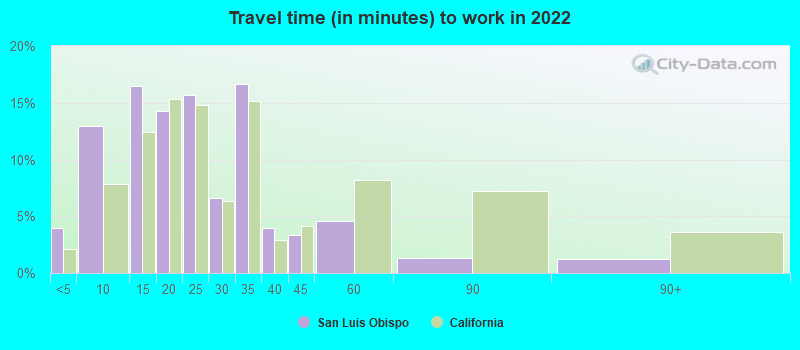
Travel time to work (commute)
Less than 5 minutes: 1,293
5 to 9 minutes: 4,889
10 to 14 minutes: 6,057
15 to 19 minutes: 3,294
20 to 24 minutes: 1,921
25 to 29 minutes: 574
30 to 34 minutes: 947
35 to 39 minutes: 527
40 to 44 minutes: 415
45 to 59 minutes: 422
60 to 89 minutes: 104
90 or more minutes: 240
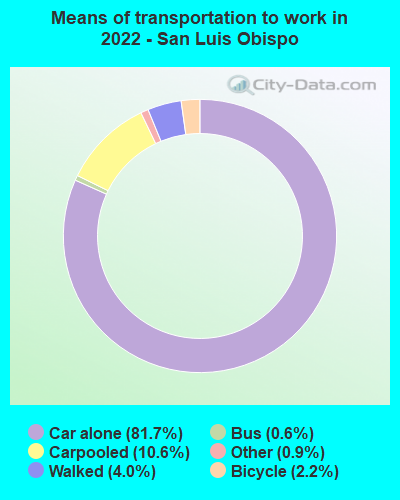
Means of transportation to work:
Drove a car alone: 28,705 (73.0%)
Carpooled: 3,479 (8.8%)
Bus: 184 (0.5%)
Long-distance train or commuter rail: 10 (0.0%)
Taxi: 309 (0.8%)
Bicycle: 812 (2.1%)
Walked: 1,231 (3.1%)
Worked at home: 4,349 (11.1%)
Unemployment by race in 2022
Unemployment rate for White non-Hispanic residents
4.7%Males
7.6%Females
Unemployment rate for Asian residents
2.3%Males
8.2%Females
Unemployment rate for other race residents
20.3%Males
8.8%Females
Unemployment rate for two or more race residents
5.6%Males
Unemployment rate for Hispanic or Latino residents
6.6%Males
3.0%Females
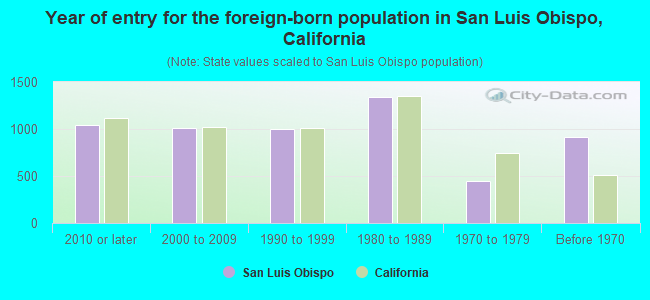
Year of entry for the foreign-born population in San Luis Obispo, California
1,0442010 or later
1,0062000 to 2009
1,0021990 to 1999
1,3391980 to 1989
4491970 to 1979
920Before 1970
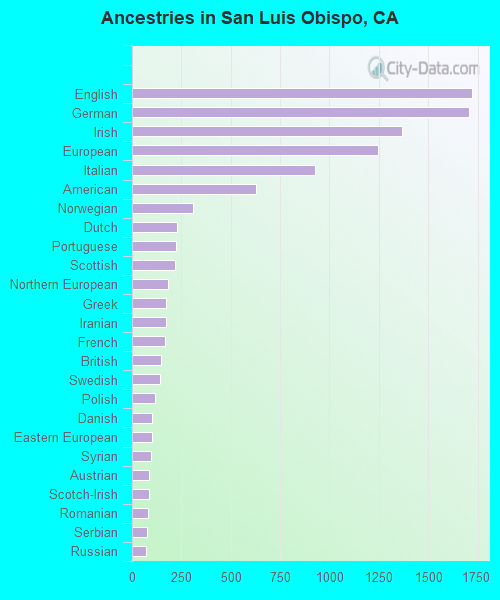
First ancestries reported:
English: 1,722 (8.6%)
German: 1,705 (8.5%)
Irish: 1,370 (6.8%)
European: 1,245 (6.2%)
Italian: 929 (4.6%)
American: 629 (3.1%)
Norwegian: 308 (1.5%)
Dutch: 227 (1.1%)
Portuguese: 225 (1.1%)
Scottish: 220 (1.1%)
Northern European: 182 (0.9%)
Greek: 172 (0.9%)
Iranian: 171 (0.9%)
French: 167 (0.8%)
British: 147 (0.7%)
Swedish: 142 (0.7%)
Polish: 119 (0.6%)
Danish: 100 (0.5%)
Eastern European: 100 (0.5%)
Syrian: 97 (0.5%)
Austrian: 86 (0.4%)
Scotch-Irish: 86 (0.4%)
Romanian: 81 (0.4%)
Serbian: 76 (0.4%)
Russian: 72 (0.4%)
Scandinavian: 68 (0.3%)
Brazilian: 67 (0.3%)
African: 65 (0.3%)
Czech: 64 (0.3%)
Canadian: 61 (0.3%)
Croatian: 58 (0.3%)
Ukrainian: 55 (0.3%)
Palestinian: 50 (0.2%)
Arab: 48 (0.2%)
Jordanian: 47 (0.2%)
Hungarian: 43 (0.2%)
Turkish: 42 (0.2%)
Australian: 33 (0.2%)
Swiss: 32 (0.2%)
Yugoslavian: 28 (0.1%)
Lebanese: 25 (0.1%)
Welsh: 24 (0.1%)
Czechoslovakian: 19 (0.09%)
Israeli: 17 (0.08%)
Slovak: 16 (0.08%)
Basque: 14 (0.07%)
Slovene: 13 (0.06%)
Finnish: 11 (0.05%)
Celtic: 9 (0.04%)
Ethiopian: 9 (0.04%)
Bulgarian: 8 (0.04%)
Armenian: 8 (0.04%)
Egyptian: 7 (0.03%)
French Canadian: 5 (0.02%)
Most common places of birth for foreign-born residents (%):
Mexico
San Luis Obispo:
26.7% (1,020)
California:
37.2% (3,881,193)
Germany
San Luis Obispo:
10.3% (394)
California:
0.7% (73,304)
Canada
San Luis Obispo:
6.8% (261)
California:
1.2% (127,477)
Philippines
San Luis Obispo:
5.1% (193)
California:
7.8% (818,297)
China, excluding Hong Kong and Taiwan
San Luis Obispo:
4.9% (188)
California:
6.6% (684,672)
India
San Luis Obispo:
4.0% (151)
California:
5.2% (539,184)
Korea
San Luis Obispo:
2.4% (92)
California:
3.0% (315,248)
France
San Luis Obispo:
2.3% (86)
California:
0.4% (40,224)
Guatemala
San Luis Obispo:
2.0% (78)
California:
2.8% (290,436)
United Kingdom, excluding England and Scotland
San Luis Obispo:
1.8% (68)
California:
0.6% (60,582)
Syria
San Luis Obispo:
1.8% (68)
California:
0.3% (30,949)
El Salvador
San Luis Obispo:
1.8% (67)
California:
4.2% (440,287)
Jordan
San Luis Obispo:
1.8% (67)
California:
0.2% (16,384)
Italy
San Luis Obispo:
1.7% (64)
California:
0.3% (31,439)
Place of birth for U.S.-born residents:
This state: 32,719
Other state: 10,081
Northeast: 1,930
Midwest: 2,615
South: 2,088
West: 3,533
65.6% of San Luis Obispo residents lived in the same house 1 years ago. Out of people who lived in different houses, 38.5% lived in this county. Out of people who lived in different counties, 87.1% lived in California.
San Luis Obispo:
65.6%
State average:
88.9%
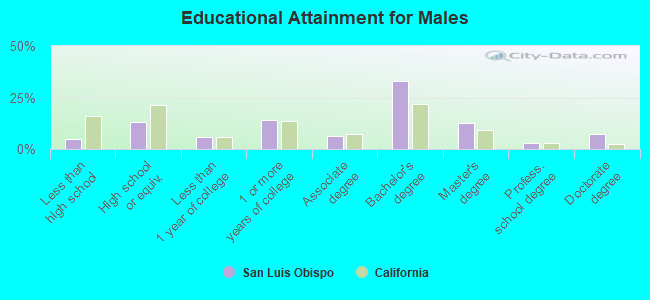
Education attainment for males 25 years and older:
No schooling: 84
Nursery to 4th grade: 78
5th and 6th grade: 54
7th and 8th grade: 118
9th grade: 0
10th grade: 21
11th grade: 3
12th grade, no diploma: 224
High school graduate (or equivalency): 1,547
Less than 1 year of college: 695
Some college more than 1 year, no degree: 1,641
Associate degree: 740
Bachelor's degree: 3,837
Master's degree: 1,488
Professional school degree: 314
Doctorate degree: 861
Education attainment for females 25 years and older:
No schooling: 98
Nursery to 4th grade: 32
5th and 6th grade: 39
7th and 8th grade: 102
9th grade: 27
10th grade: 9
11th grade: 39
12th grade, no diploma: 134
High school graduate (or equivalency): 1,258
Less than 1 year of college: 902
Some college more than 1 year, no degree: 1,810
Associate degree: 1,137
Bachelor's degree: 4,424
Master's degree: 2,023
Professional school degree: 553
Doctorate degree: 413
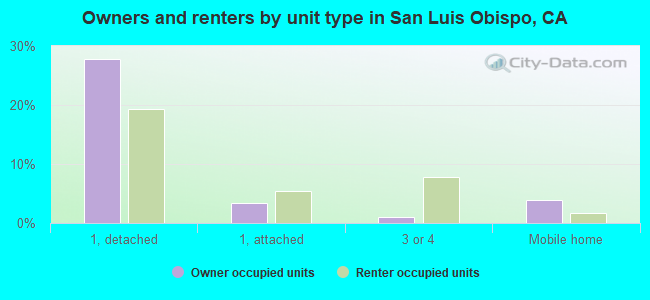
Housing units in structures:
One, detached: 9,669
One, attached: 1,914
Two: 1,112
3 or 4: 1,944
5 to 9: 1,444
10 to 19: 1,482
20 to 49: 1,750
50 or more: 781
Mobile homes: 1,188
Median worth of mobile homes: $223,667
Housing units lacking complete plumbing facilities in 2022: 0.2%
Housing units lacking complete kitchen facilities in 2022: 3.1%
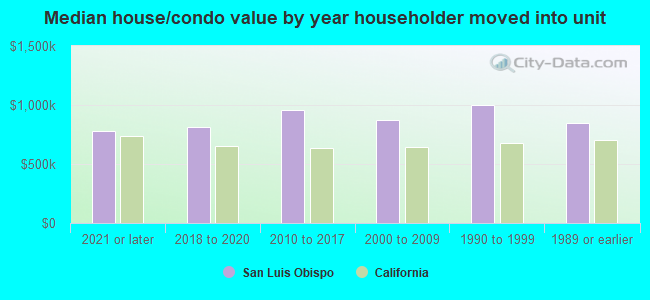
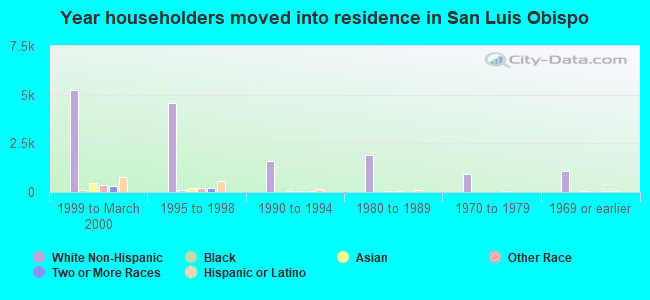
House/condo owner moved in on average 12 years ago