San Marcos, TX (Texas) Houses and Residents
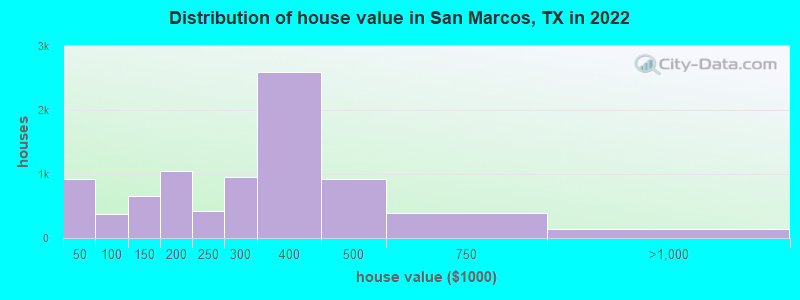
Estimated median house or condo value in 2022: $285,400 (it was $76,000 in 2000 )
San Marcos:
$285,400Texas:
$275,400
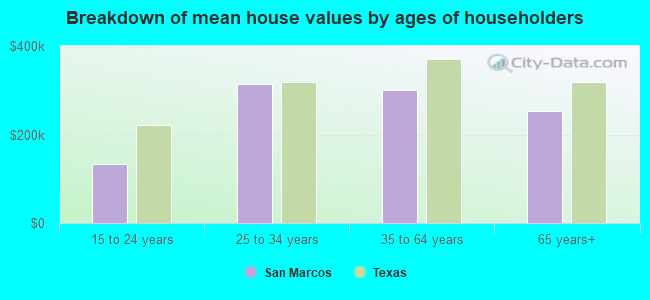
Lower value quartile - upper value quartile: $159,900 - $382,700Mean price in 2022: Detached houses: $316,037 Here:
$316,037State:
$369,058
Townhouses or other attached units: $258,322 Here:
$258,322State:
$327,631
In 2-unit structures: $277,340 Here:
$277,340State:
$374,947
In 5-or-more-unit structures: $245,185 Here:
$245,185State:
$413,944
Mobile homes: $36,157 Here:
$36,157State:
$124,413
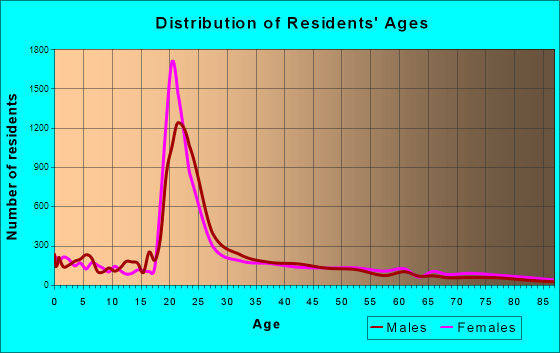
Total population: 58,892 (Urban population: 33,827 (all inside urban clusters), Rural population: 178 (8 farm, 170 nonfarm ))
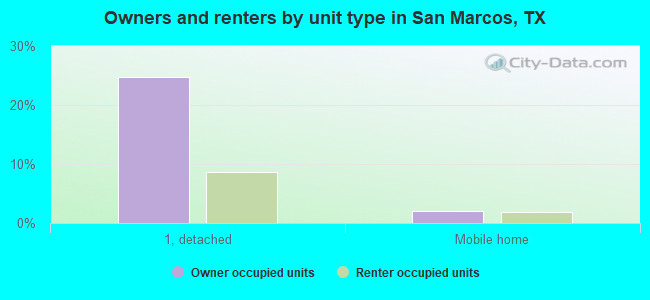
Houses: 31,332 (29,541 occupied: 10,295 owner occupied, 19,246 renter occupied )
% of renters here:
65%State:
38%
Housing density: 1,721 houses/condos per square mile
Median price asked for vacant for-sale houses and condos in 2022: $334,743.
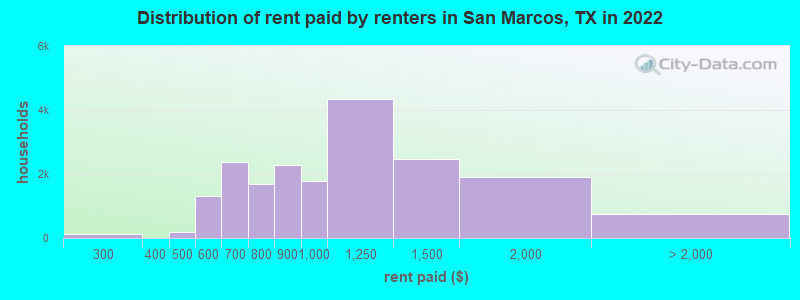
Median contract rent in 2022: $987 (lower quartile is $738, upper quartile is $1,269)
Median rent asked for vacant for-rent units in 2022: $891
Median gross rent in San Marcos, TX in 2022: $1,112
Housing units in San Marcos with a mortgage: 5,883 (136 second mortgage, 0 home equity loan, 88 both second mortgage and home equity loan )Houses without a mortgage: 36
Median household income for houses/condos with a mortgage: $106,229
Median household income for apartments without a mortgage: $78,176
Median monthly housing costs: $1,128
Data:
Median house or condo value ($)
Median house or condo value ($ change since 2000)
Median house or condo value ($) - White
Median house or condo value ($) - Black or African American
Median house or condo value ($) - Asian
Median house or condo value ($) - Hispanic or Latino
Median house or condo value ($) - American Indian and Alaska Native
Median house or condo value ($) - Multirace
Median house or condo value ($) - Other Race
Median price asked for mobile homes ($)
Household density (households per square mile)
Mean house or condo value by units in structure - 1, detached ($)
Mean house or condo value by units in structure - 1, attached ($)
Mean house or condo value by units in structure - 2 ($)
Mean house or condo value by units in structure by units in structure - 3 or 4 ($)
Mean house or condo value by units in structure - 5 or more ($)
Mean house or condo value by units in structure - Boat, RV, van, etc. ($)
Mean house or condo value by units in structure - Mobile home ($)
Median contract rent ($)
Median contract rent - Lower quartile ($)
Median contract rent - Upper quartile ($)
Median gross rent ($)
Urban houses (%)
Rural houses (%)
Houses occupied (%)
Houses occupied (% change since 2000)
Houses owner occupied (%)
Houses owner occupied (% change since 2000)
Houses renter occupied (%)
Houses renter occupied (% change since 2000)
Vacant housing units - For rent (%)
Vacant housing units - For rent (% change since 2000)
Vacant housing units - For sale only (%)
Vacant housing units - For sale only (% change since 2000)
Vacant housing units - Rented or sold, not occupied (%)
Vacant housing units - Rented or sold, not occupied (% change since 2000)
Vacant housing units - For seasonal, recreational, or occasional use (%)
Vacant housing units - For seasonal, recreational, or occasional use (% change since 2000)
Vacant housing units - For migrant workers (%)
Vacant housing units - For migrant workers (% change since 2000)
Vacant housing units - Other vacant (%)
Vacant housing units - Other vacant (% change since 2000)
Median monthly housing costs ($)
Median household income for houses/condos with a mortgage ($)
Median household income for houses/condos without a mortgage ($)
Median household income ($)
Median household income ($) - White
Median household income ($) - Black or African American
Median household income ($) - Asian
Median household income ($) - Hispanic or Latino
Median household income ($) - American Indian and Alaska Native
Median household income ($) - Multirace
Median household income ($) - Other Race
Mortgage status - with mortgage (%)
Mortgage status - with second mortgage (%)
Mortgage status - with home equity loan (%)
Mortgage status - with both second mortgage and home equity loan (%)
Mortgage status - without a mortgage (%)
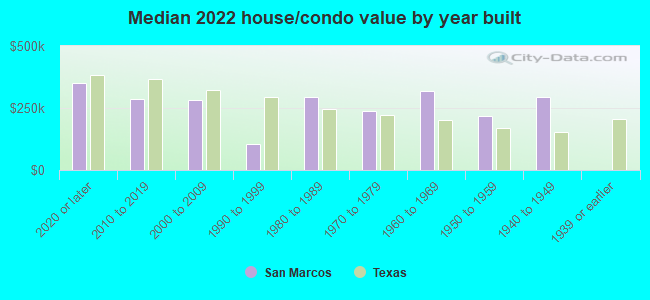
Median year house/condo built
Median year apartment built
Household type by relationship - Male householder living alone (%)
Household type by relationship - Male householder not living alone (%)
Household type by relationship - Female householder living alone (%)
Household type by relationship - Female householder not living alone (%)
Household type by relationship - Opposite-Sex spouse (%)
Household type by relationship - Same-Sex spouse (%)
Household type by relationship - Opposite-Sex unmarried partner (%)
Household type by relationship - Same-Sex unmarried partner (%)
Household type by relationship - In group quarters (%)
Size of family households - 2-person household (%)
Size of family households - 3-person household (%)
Size of family households - 4-person household (%)
Size of family households - 5-person household (%)
Size of family households - 6-person household (%)
Size of family households - 7-or-more-person household (%)
Size of nonfamily households - 1-person household (%)
Size of nonfamily households - 2-person household (%)
Size of nonfamily households - 3-person household (%)
Size of nonfamily households - 4-person household (%)
Size of nonfamily households - 5-person household (%)
Size of nonfamily households - 6-person household (%)
Size of nonfamily households - 7-or-moreperson household (%)
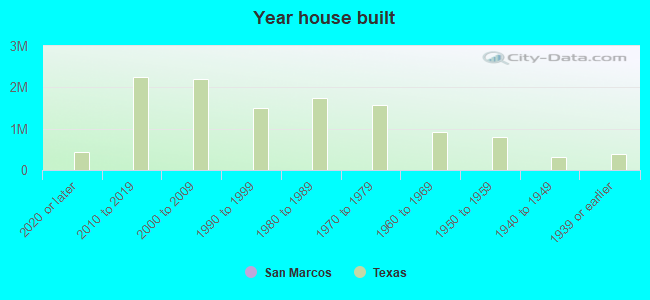
Year house built - Built 2010 or later (%)
Year house built - Built 2000 to 2009 (%)
Year house built - Built 1990 to 1999 (%)
Year house built - Built 1980 to 1989 (%)
Year house built - Built 1970 to 1979 (%)
Year house built - Built 1960 to 1969 (%)
Year house built - Built 1950 to 1959 (%)
Year house built - Built 1940 to 1949 (%)
Year house built - Built 1939 or earlier (%)
Median number of rooms in houses and condos
Median number of rooms in apartments
Median number of bedrooms in owner occupied houses
Mean number of bedrooms in owner occupied houses
Median number of bedrooms in renter occupied houses
Mean number of bedrooms in renter occupied houses
Median number of vehichles in owner occupied houses
Mean number of vehichles in owner occupied houses
Median number of vehichles in renter occupied houses
Mean number of vehichles in renter occupied houses
Rooms in owner-occupied houses - 1 room (%)
Rooms in owner-occupied houses - 2 rooms (%)
Rooms in owner-occupied houses - 3 rooms (%)
Rooms in owner-occupied houses - 4 rooms (%)
Rooms in owner-occupied houses - 5 rooms (%)
Rooms in owner-occupied houses - 6 rooms (%)
Rooms in owner-occupied houses - 7 rooms (%)
Rooms in owner-occupied houses - 8 rooms (%)
Rooms in owner-occupied houses - 9+ rooms (%)
Rooms in renter-occupied houses - 1 room (%)
Rooms in renter-occupied houses - 2 rooms (%)
Rooms in renter-occupied houses - 3 rooms (%)
Rooms in renter-occupied houses - 4 rooms (%)
Rooms in renter-occupied houses - 5 rooms (%)
Rooms in renter-occupied houses - 6 rooms (%)
Rooms in renter-occupied houses - 7 rooms (%)
Rooms in renter-occupied houses - 8 rooms (%)
Rooms in renter-occupied houses - 9+ rooms (%)
Bedrooms in owner-occupied houses - no bedrooms (%)
Bedrooms in owner-occupied houses - 1 bedroom (%)
Bedrooms in owner-occupied houses - 2 bedrooms (%)
Bedrooms in owner-occupied houses - 3 bedrooms (%)
Bedrooms in owner-occupied houses - 4 bedrooms (%)
Bedrooms in owner-occupied houses - 5+ bedrooms (%)
Bedrooms in renter-occupied houses - no bedrooms (%)
Bedrooms in renter-occupied houses - 1 bedroom (%)
Bedrooms in renter-occupied houses - 2 bedrooms (%)
Bedrooms in renter-occupied houses - 3 bedrooms (%)
Bedrooms in renter-occupied houses - 4 bedrooms (%)
Bedrooms in renter-occupied houses - 5+ bedrooms (%)
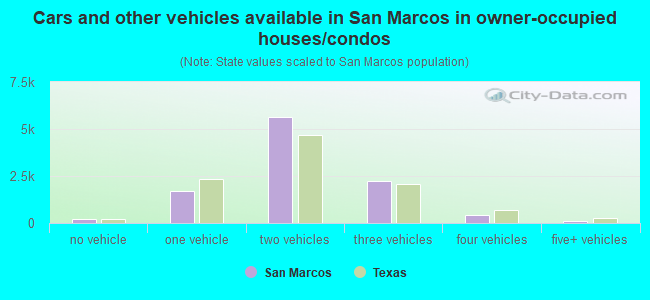
Vehicles available in owner-occupied houses - no vehicle available (%)
Vehicles available in owner-occupied houses - 1 vehicle available(%)
Vehicles available in owner-occupied houses - 2 Vehicles available (%)
Vehicles available in owner-occupied houses - 3 Vehicles available (%)
Vehicles available in owner-occupied houses - 4 Vehicles available (%)
Vehicles available in owner-occupied houses - 5+ Vehicles available (%)
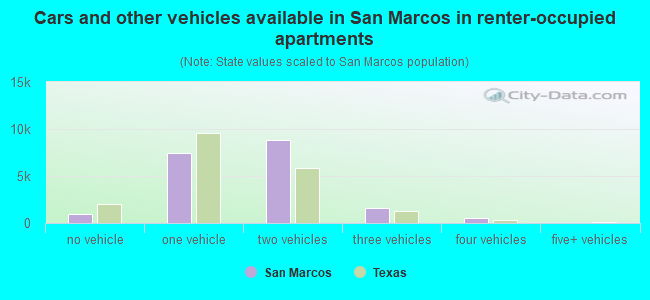
Vehicles available in renter-occupied houses - no vehicle available (%)
Vehicles available in renter-occupied houses - 1 vehicle available (%)
Vehicles available in renter-occupied houses - 2 Vehicles available (%)
Vehicles available in renter-occupied houses - 3 Vehicles available (%)
Vehicles available in renter-occupied houses - 4 Vehicles available (%)
Vehicles available in renter-occupied houses - 5+ Vehicles available (%)
Housing units in structures - 1, detached (%)
Housing units in structures - 1, attached (%)
Housing units in structures - 2 (%)
Housing units in structures - 3 or 4 (%)
Housing units in structures - 5 to 9 (%)
Housing units in structures - 10 to 19 (%)
Housing units in structures - 20 to 49 (%)
Housing units in structures - 50 or more (%)
Housing units in structures - Mobile home (%)
Housing units in structures - Boat, RV, van, etc. (%)
Housing units in structures - Owners - 1, detached (%)
Housing units in structures - Owners - 1, attached (%)
Housing units in structures - Owners - 2 (%)
Housing units in structures - Owners - 3 or 4 (%)
Housing units in structures - Owners - 5 to 9 (%)
Housing units in structures - Owners - 10 to 19 (%)
Housing units in structures - Owners - 20 to 49 (%)
Housing units in structures - Owners - 50 or more (%)
Housing units in structures - Owners - Mobile home (%)
Housing units in structures - Owners - Boat, RV, van, etc. (%)
Housing units in structures - Renters - 1, detached (%)
Housing units in structures - Renters - 1, attached (%)
Housing units in structures - Renters - 2 (%)
Housing units in structures - Renters - 3 or 4 (%)
Housing units in structures - Renters - 5 to 9 (%)
Housing units in structures - Renters - 10 to 19 (%)
Housing units in structures - Renters - 20 to 49 (%)
Housing units in structures - Renters - 50 or more (%)
Housing units in structures - Renters - Mobile home (%)
Housing units in structures - Renters - Boat, RV, van, etc. (%)
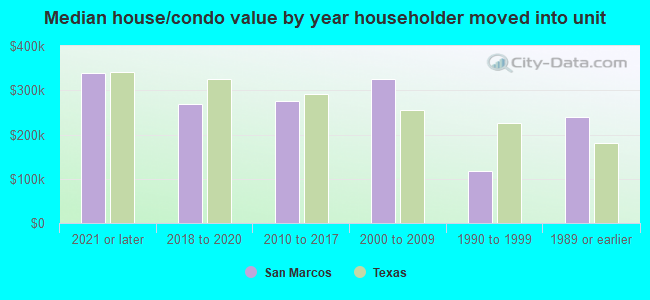
House/condo owner moved in on average (years ago)
Renter moved in on average (years ago)
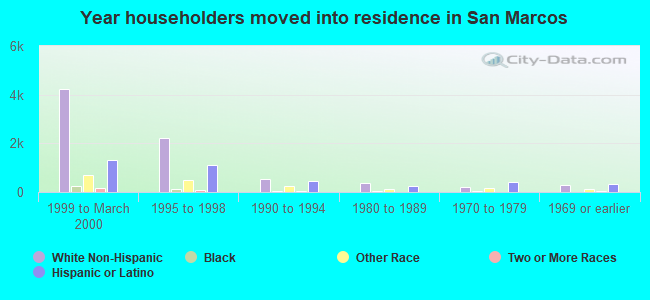
Year householder moved into unit - Moved in 1999 to March 2000 (%)
Year householder moved into unit - Moved in 1999 to March 2000 (%) - White
Year householder moved into unit - Moved in 1999 to March 2000 (%) - Black or African American
Year householder moved into unit - Moved in 1999 to March 2000 (%) - Asian
Year householder moved into unit - Moved in 1999 to March 2000 (%) - Hispanic or Latino
Year householder moved into unit - Moved in 1999 to March 2000 (%) - American Indian and Alaska Native
Year householder moved into unit - Moved in 1999 to March 2000 (%) - Multirace
Year householder moved into unit - Moved in 1999 to March 2000 (%) - Other Race
Year householder moved into unit - Moved in 1995 to 1998 (%)
Year householder moved into unit - Moved in 1995 to 1998 (%) - White
Year householder moved into unit - Moved in 1995 to 1998 (%) - Black or African American
Year householder moved into unit - Moved in 1995 to 1998 (%) - Asian
Year householder moved into unit - Moved in 1995 to 1998 (%) - Hispanic or Latino
Year householder moved into unit - Moved in 1995 to 1998 (%) - American Indian and Alaska Native
Year householder moved into unit - Moved in 1995 to 1998 (%) - Multirace
Year householder moved into unit - Moved in 1995 to 1998 (%) - Other Race
Year householder moved into unit - Moved in 1990 to 1994 (%)
Year householder moved into unit - Moved in 1990 to 1994 (%) - White
Year householder moved into unit - Moved in 1990 to 1994 (%) - Black or African American
Year householder moved into unit - Moved in 1990 to 1994 (%) - Asian
Year householder moved into unit - Moved in 1990 to 1994 (%) - Hispanic or Latino
Year householder moved into unit - Moved in 1990 to 1994 (%) - American Indian and Alaska Native
Year householder moved into unit - Moved in 1990 to 1994 (%) - Multirace
Year householder moved into unit - Moved in 1990 to 1994 (%) - Other Race
Year householder moved into unit - Moved in 1980 to 1989 (%)
Year householder moved into unit - Moved in 1980 to 1989 (%) - White
Year householder moved into unit - Moved in 1980 to 1989 (%) - Black or African American
Year householder moved into unit - Moved in 1980 to 1989 (%) - Asian
Year householder moved into unit - Moved in 1980 to 1989 (%) - Hispanic or Latino
Year householder moved into unit - Moved in 1980 to 1989 (%) - American Indian and Alaska Native
Year householder moved into unit - Moved in 1980 to 1989 (%) - Multirace
Year householder moved into unit - Moved in 1980 to 1989 (%) - Other Race
Year householder moved into unit - Moved in 1970 to 1979 (%)
Year householder moved into unit - Moved in 1970 to 1979 (%) - White
Year householder moved into unit - Moved in 1970 to 1979 (%) - Black or African American
Year householder moved into unit - Moved in 1970 to 1979 (%) - Asian
Year householder moved into unit - Moved in 1970 to 1979 (%) - Hispanic or Latino
Year householder moved into unit - Moved in 1970 to 1979 (%) - American Indian and Alaska Native
Year householder moved into unit - Moved in 1970 to 1979 (%) - Multirace
Year householder moved into unit - Moved in 1970 to 1979 (%) - Other Race
Year householder moved into unit - Moved in 1969 or earlier (%)
Year householder moved into unit - Moved in 1969 or earlier (%) - White
Year householder moved into unit - Moved in 1969 or earlier (%) - Black or African American
Year householder moved into unit - Moved in 1969 or earlier (%) - Asian
Year householder moved into unit - Moved in 1969 or earlier (%) - Hispanic or Latino
Year householder moved into unit - Moved in 1969 or earlier (%) - American Indian and Alaska Native
Year householder moved into unit - Moved in 1969 or earlier (%) - Multirace
Year householder moved into unit - Moved in 1969 or earlier (%) - Other Race
Housing units lacking complete plumbing facilities (%)
Housing units lacking complete kitchen facilities (%)
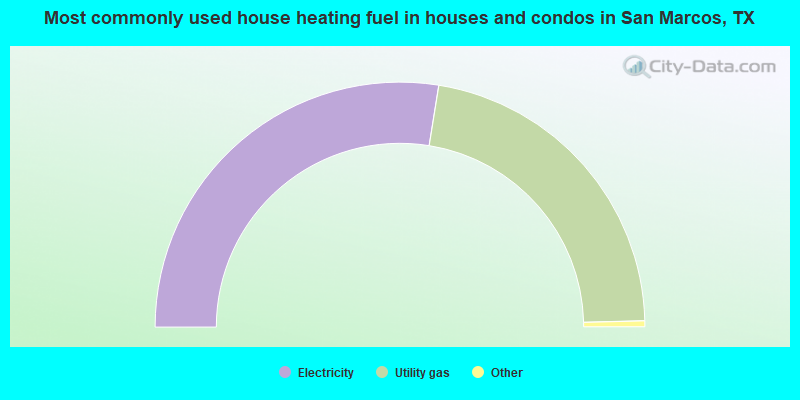
House heating fuel used in houses and condos - Utility gas (%)
House heating fuel used in houses and condos - Bottled, tank, or LP gas (%)
House heating fuel used in houses and condos - Electricity (%)
House heating fuel used in houses and condos - Fuel oil, kerosene, etc. (%)
House heating fuel used in houses and condos - Coal or coke (%)
House heating fuel used in houses and condos - Wood (%)
House heating fuel used in houses and condos - Solar energy (%)
House heating fuel used in houses and condos - Other fuel (%)
House heating fuel used in houses and condos - No fuel used (%)
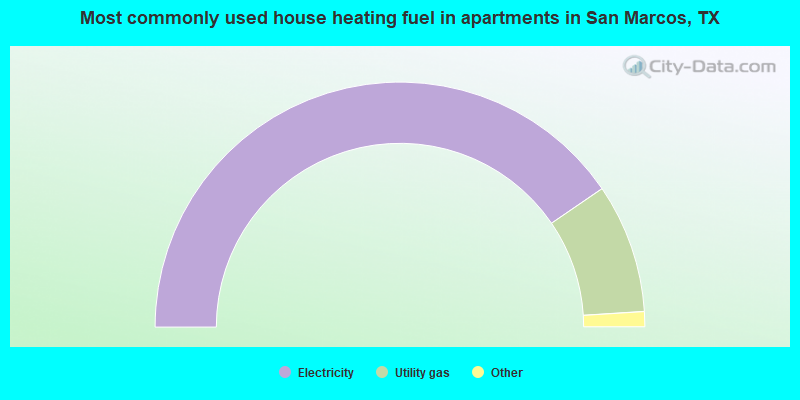
House heating fuel used in apartments - Utility gas (%)
House heating fuel used in apartments - Bottled, tank, or LP gas (%)
House heating fuel used in apartments - Electricity (%)
House heating fuel used in apartments - Fuel oil, kerosene, etc. (%)
House heating fuel used in apartments - Coal or coke (%)
House heating fuel used in apartments - Wood (%)
House heating fuel used in apartments - Solar energy (%)
House heating fuel used in apartments - Other fuel (%)
House heating fuel used in apartments - No fuel used (%)
Median year house/condo built: 2008Median year apartment built: 2001Household type by relationship:
Households: 70,308
Male householders: 11,539 (2,502 living alone ), Female householders: 18,002 (5,019 living alone )9,539 spouses (9,490 opposite-sex spouses ), 4,276 unmarried partners , (4,224 opposite-sex unmarried partners ), 10,659 children (10,355 natural , 193 adopted , 111 stepchildren ), 775 grandchildren , 541 brothers or sisters , 353 parents , 0 foster children , 604 other relatives , 6,856 non-relatives In group quarters: 7,164
Size of family households: 5,674 2-persons , 4,160 3-persons , 2,610 4-persons , 521 5-persons , 123 6-persons , 226 7-or-more-persons .
Size of nonfamily households: 7,521 1-person , 6,026 2-persons , 1,432 3-persons , 1,248 4-persons .
5,088 married couples with children. single-parent households (500 men , 1,619 women ).
70.8% of residents of San Marcos speak English at home. of residents speak Spanish at home (85% speak English very well , 8% speak English well , 5% speak English not well , 2% don't speak English at all ).of residents speak other Indo-European language at home (70% speak English very well , 21% speak English well , 9% speak English not well , 1% don't speak English at all ).of residents speak Asian or Pacific Island language at home (74% speak English very well , 22% speak English well , 2% speak English not well , 2% don't speak English at all ).of residents speak other language at home (77% speak English very well , 23% speak English well ).
Foreign born population: 6,556 (9.3%)of them are naturalized citizens )
Median number of rooms in houses and condos:
Median number of rooms in apartments
Owner-occupied Renter-occupied
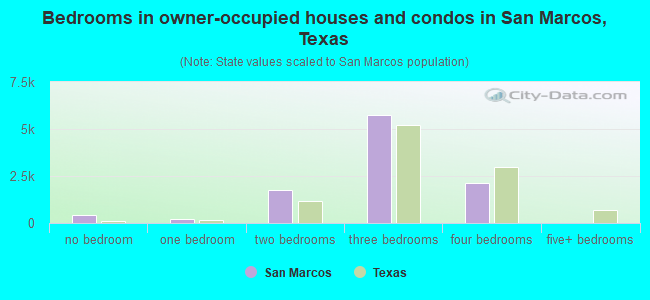
Bedrooms in owner-occupied houses and condos in San Marcos, Texas
448 no bedroom 216 1 bedroom 1,765 2 bedrooms 5,726 3 bedrooms 2,140 4 bedrooms 0 5+ bedrooms
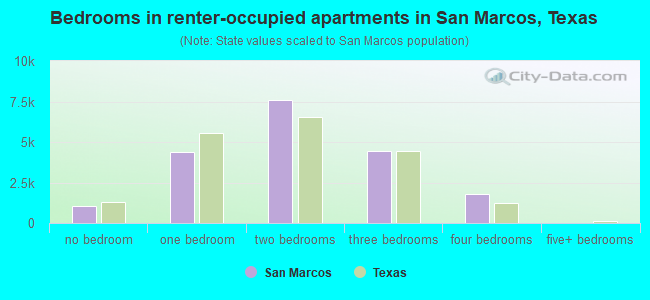
Bedrooms in renter-occupied apartments in San Marcos, Texas
1,062 no bedroom 4,359 1 bedroom 7,566 2 bedrooms 4,458 3 bedrooms 1,801 4 bedrooms 0 5+ bedrooms
Owner-occupied Renter-occupied
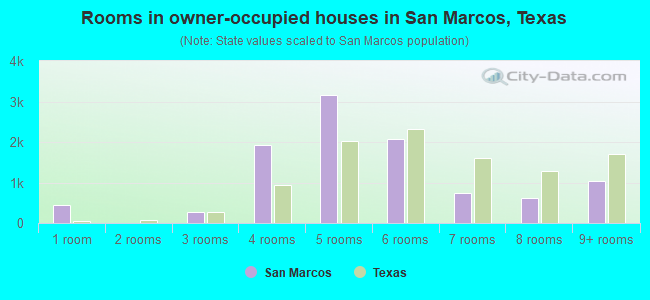
Rooms in owner-occupied houses in San Marcos, Texas
448 1 room 0 2 rooms 267 3 rooms 1,929 4 rooms 3,165 5 rooms 2,078 6 rooms 745 7 rooms 618 8 rooms 1,045 9+ rooms
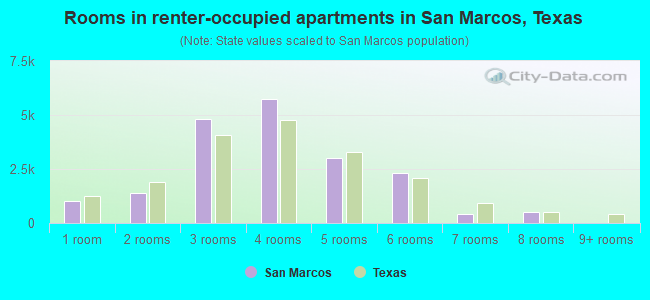
Rooms in renter-occupied apartments in San Marcos, Texas
1,022 1 room 1,387 2 rooms 4,804 3 rooms 5,738 4 rooms 3,027 5 rooms 2,333 6 rooms 423 7 rooms 512 8 rooms 0 9+ rooms
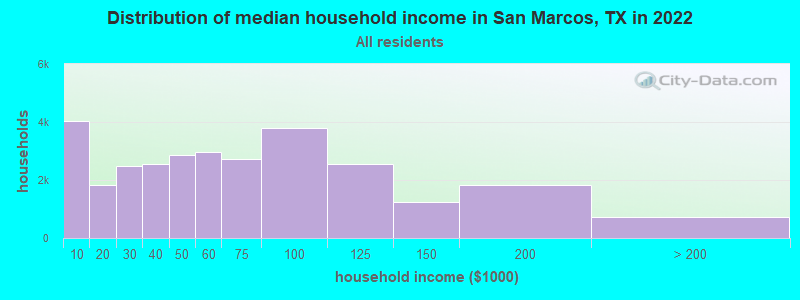
San Marcos, TX household income distribution 4,050 Less than $10,0001,813 $10,000 to $19,9992,481 $20,000 to $29,9992,544 $30,000 to $39,9992,851 $40,000 to $49,9992,950 $50,000 to $59,9992,707 $60,000 to $74,9993,792 $75,000 to $99,9992,562 $100,000 to $124,9991,240 $125,000 to $149,9991,832 $150,000 to $199,999719 $200,000 or more
Home value of owner - occupied houses in 2022 in San Marcos, TX 244 Less than $10,000264 $10,000 to $14,99998 $15,000 to $19,99955 $20,000 to $24,99932 $25,000 to $29,99912 $30,000 to $34,99996 $35,000 to $39,999119 $40,000 to $49,99991 $50,000 to $59,99951 $60,000 to $69,99956 $70,000 to $79,99916 $80,000 to $89,99941 $90,000 to $99,999501 $100,000 to $124,999155 $125,000 to $149,999740 $150,000 to $174,999309 $175,000 to $199,999414 $200,000 to $249,999950 $250,000 to $299,9992,589 $300,000 to $399,999917 $400,000 to $499,999385 $500,000 to $749,999132 $750,000 to $999,99912 $1,000,000 to $1,499,999Rent paid by renters in 2022 in San Marcos, TX 31 $150 to $19989 $200 to $24937 $250 to $299119 $400 to $44979 $450 to $499505 $500 to $549803 $550 to $5991,775 $600 to $649603 $650 to $699941 $700 to $749746 $750 to $7992,266 $800 to $8991,766 $900 to $9994,350 $1,000 to $1,2492,470 $1,250 to $1,4991,905 $1,500 to $1,999577 $2,000 to $2,499184 No cash rent
Percentage of workers working in this county: 65.5%Number of people working at home: 4,870 (11.5% of all workers )
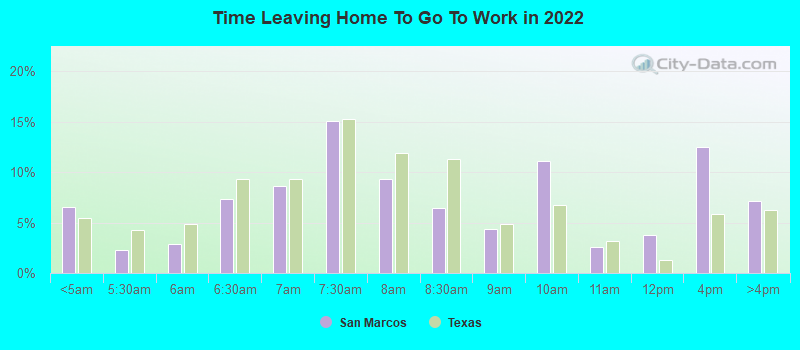
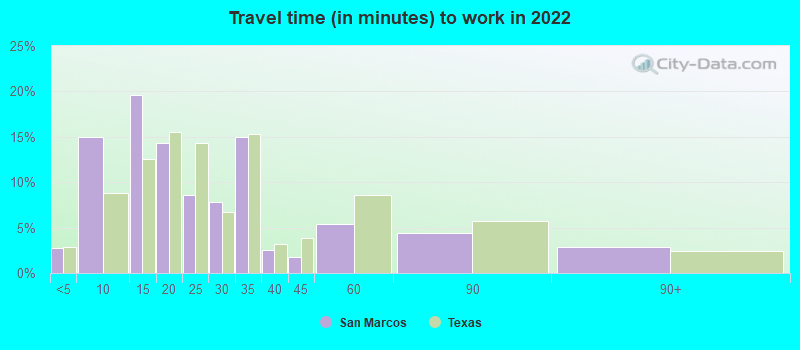
Travel time to work (commute)
Less than 5 minutes: 9075 to 9 minutes: 5,71010 to 14 minutes: 6,97915 to 19 minutes: 4,09220 to 24 minutes: 3,73425 to 29 minutes: 3,68430 to 34 minutes: 5,03935 to 39 minutes: 33640 to 44 minutes: 97745 to 59 minutes: 2,52360 to 89 minutes: 1,81290 or more minutes: 1,659
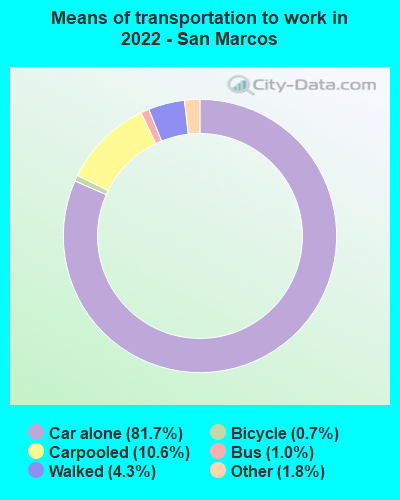
Means of transportation to work:
Drove a car alone: 32,799 (69.5%)Carpooled: 4,413 (9.4%)Bus : 206 (0.4%)Taxi: 905 (1.9%)Bicycle: 367 (0.8%)Walked: 1,303 (2.8%)Worked at home: 4,870 (10.3%)
Unemployment by race in 2022
Unemployment rate for White non-Hispanic residents 4.7% Males6.1% FemalesUnemployment rate for Black residents 0.9% Males10.1% FemalesUnemployment rate for Asian residents 1.3% Males3.5% FemalesUnemployment rate for other race residents 1.8% Males8.0% FemalesUnemployment rate for two or more race residents 4.6% Males17.9% FemalesUnemployment rate for Hispanic or Latino residents 4.7% Males2.3% Females
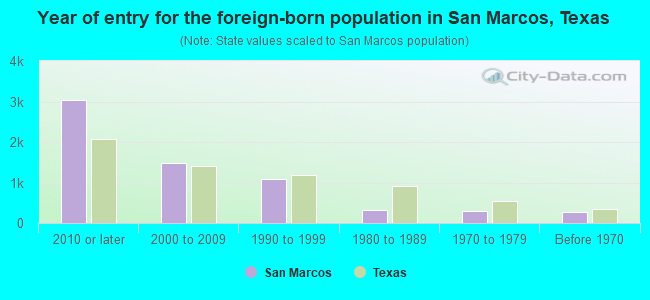
Year of entry for the foreign-born population in San Marcos, Texas
3,039 2010 or later 1,482 2000 to 2009 1,078 1990 to 1999 327 1980 to 1989 298 1970 to 1979 265 Before 1970
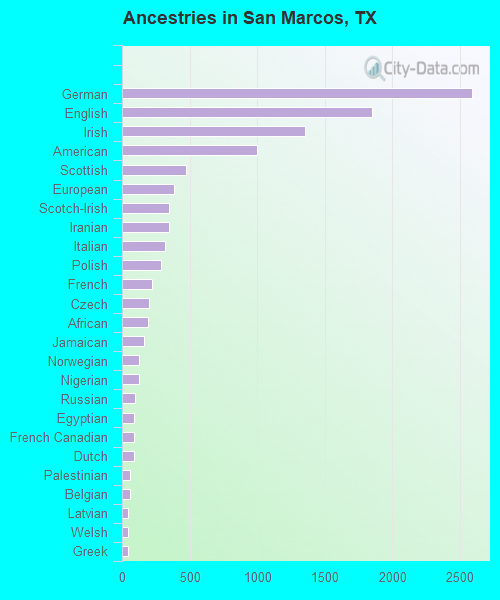
First ancestries reported:
German: 2,587 (7.4%)
English: 1,854 (5.3%)
Irish: 1,352 (3.9%)
American: 1,002 (2.9%)
Scottish: 471 (1.4%)
European: 382 (1.1%)
Scotch-Irish: 348 (1.0%)
Iranian: 347 (1.0%)
Italian: 319 (0.9%)
Polish: 287 (0.8%)
French: 219 (0.6%)
Czech: 203 (0.6%)
African: 190 (0.5%)
Jamaican: 166 (0.5%)
Norwegian: 126 (0.4%)
Nigerian: 124 (0.4%)
Russian: 95 (0.3%)
Egyptian: 89 (0.3%)
French Canadian: 89 (0.3%)
Dutch: 87 (0.3%)
Palestinian: 62 (0.2%)
Belgian: 57 (0.2%)
Latvian: 47 (0.1%)
Welsh: 47 (0.1%)
Greek: 45 (0.1%)
Eastern European: 42 (0.1%)
Swedish: 40 (0.1%)
Slovene: 39 (0.1%)
Brazilian: 37 (0.1%)
Northern European: 24 (0.07%)
Arab: 24 (0.07%)
Czechoslovakian: 20 (0.06%)
Portuguese: 19 (0.05%)
Hungarian: 18 (0.05%)
Pennsylvania German: 17 (0.05%)
Lebanese: 16 (0.05%)
Danish: 16 (0.05%)
Swiss: 14 (0.04%)
Ghanaian: 12 (0.03%)
Iraqi: 10 (0.03%)
Austrian: 10 (0.03%)
Scandinavian: 6 (0.02%)
Sierra Leonean: 6 (0.02%)
Ukrainian: 6 (0.02%)
British: 5 (0.01%)
West Indian: 4 (0.01%)
Most common places of birth for foreign-born residents (%): Mexico San Marcos:
30.9% (1,880)Texas:
48.4% (2,411,723)
Iran San Marcos:
11.6% (706)Texas:
0.6% (28,963)
El Salvador San Marcos:
9.6% (582)Texas:
4.5% (224,455)
Honduras San Marcos:
7.2% (439)Texas:
3.0% (147,182)
India San Marcos:
6.0% (365)Texas:
6.1% (306,347)
Philippines San Marcos:
4.5% (275)Texas:
2.1% (103,148)
Canada San Marcos:
3.1% (186)Texas:
1.1% (55,371)
Bolivia San Marcos:
2.8% (168)Texas:
0.1% (4,409)
Vietnam San Marcos:
2.2% (136)Texas:
3.7% (184,770)
Germany San Marcos:
1.7% (105)Texas:
0.8% (37,989)
Place of birth for U.S.-born residents:
This state: 51,125Other state: 11,027Northeast: 1,467Midwest: 3,324South: 3,564West: 2,672 69.2% of San Marcos residents lived in the same house 1 years ago.
Out of people who lived in different houses, 24.5% lived in this county.
Out of people who lived in different counties, 91.8% lived in Texas.
San Marcos:
69.2%State average:
85.7%
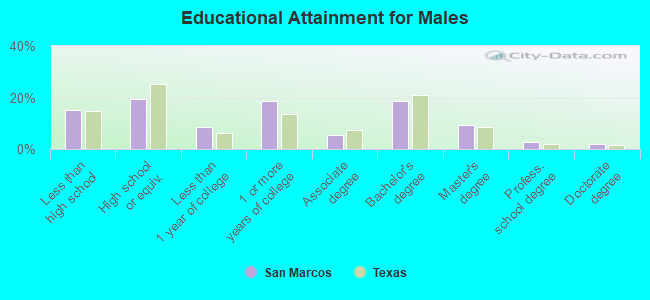
Education attainment for males 25 years and older:
No schooling: 1,162Nursery to 4th grade: 05th and 6th grade: 07th and 8th grade: 3439th grade: 010th grade: 011th grade: 52712th grade, no diploma: 621High school graduate (or equivalency): 3,437Less than 1 year of college: 1,538Some college more than 1 year, no degree: 3,292Associate degree: 990Bachelor's degree: 3,303Master's degree: 1,637Professional school degree: 477Doctorate degree: 328
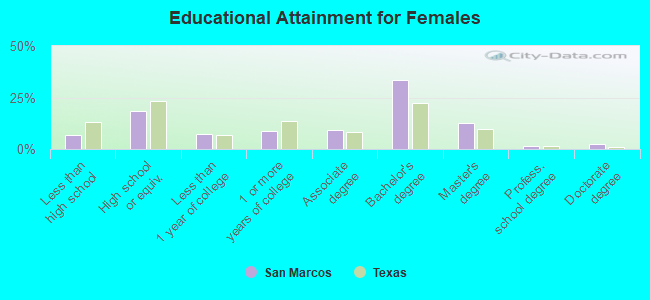
Education attainment for females 25 years and older:
No schooling: 409Nursery to 4th grade: 05th and 6th grade: 787th and 8th grade: 09th grade: 7910th grade: 011th grade: 26412th grade, no diploma: 391High school graduate (or equivalency): 3,281Less than 1 year of college: 1,330Some college more than 1 year, no degree: 1,520Associate degree: 1,643Bachelor's degree: 6,026Master's degree: 2,215Professional school degree: 220Doctorate degree: 425
Housing units in structures:
One, detached: 10,740One, attached: 694Two: 7843 or 4: 2,4955 to 9: 3,57010 to 19: 3,98520 to 49: 3,04250 or more: 4,440Mobile homes: 1,582Median worth of mobile homes: $41,118
Housing units lacking complete plumbing facilities in 2022: 0.2%Housing units lacking complete kitchen facilities in 2022: 0.2%House/condo owner moved in on average 4 years ago
Renter moved in on average 0 years ago
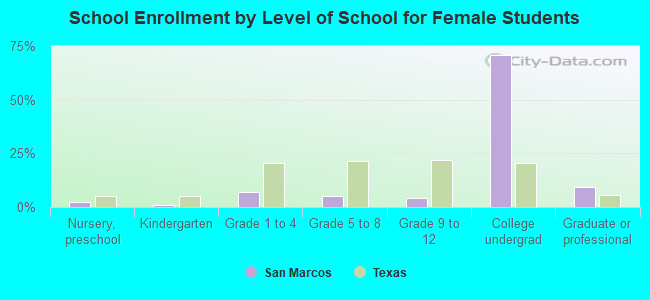
Private vs. public school enrollment:
Students in private schools in grades 1 to 8 (elementary and middle school): 251 Students in private schools in grades 9 to 12 (high school): 65 Students in private undergraduate colleges: 2,246