Saugus, MA (Massachusetts) Houses and Residents
Estimated median house or condo value in 2022: $589,480 (it was $201,100 in 2000 )
Saugus:
$589,480Massachusetts:
$534,700
Lower value quartile - upper value quartile: $448,445 - $716,512Mean price in 2022: Detached houses: $630,396 Here:
$630,396State:
$651,570
Townhouses or other attached units: $497,850 Here:
$497,850State:
$617,749
In 2-unit structures: $492,415 Here:
$492,415State:
$594,808
In 3-to-4-unit structures: $173,048 Here:
$173,048State:
$601,912
In 5-or-more-unit structures: $277,577 Here:
$277,577State:
$555,768
Mobile homes: $109,848 Here:
$109,848State:
$170,209
Total population: 26,628 (Urban population: 26,006, Rural population: 0)
Houses: 11,400 (10,874 occupied: 8,110 owner occupied, 2,794 renter occupied )
% of renters here:
26%State:
38%
Housing density: 1,038 houses/condos per square mile
Median price asked for vacant for-sale houses and condos in 2022: $704,937.
Median contract rent in 2022: $1,725 (lower quartile is $755, upper quartile is over $2,000)
Median rent asked for vacant for-rent units in 2022: $2,540
Median gross rent in Saugus, MA in 2022: $1,840
Housing units in Saugus with a mortgage: 5,200 (685 second mortgage, 7 home equity loan, 675 both second mortgage and home equity loan )Houses without a mortgage: 197
Median household income for houses/condos with a mortgage: $118,580
Median household income for apartments without a mortgage: $73,066
Median monthly housing costs: $1,903
Data:
Median house or condo value ($)
Median house or condo value ($ change since 2000)
Median house or condo value ($) - White
Median house or condo value ($) - Black or African American
Median house or condo value ($) - Asian
Median house or condo value ($) - Hispanic or Latino
Median house or condo value ($) - American Indian and Alaska Native
Median house or condo value ($) - Multirace
Median house or condo value ($) - Other Race
Median price asked for mobile homes ($)
Household density (households per square mile)
Mean house or condo value by units in structure - 1, detached ($)
Mean house or condo value by units in structure - 1, attached ($)
Mean house or condo value by units in structure - 2 ($)
Mean house or condo value by units in structure by units in structure - 3 or 4 ($)
Mean house or condo value by units in structure - 5 or more ($)
Mean house or condo value by units in structure - Boat, RV, van, etc. ($)
Mean house or condo value by units in structure - Mobile home ($)
Median contract rent ($)
Median contract rent - Lower quartile ($)
Median contract rent - Upper quartile ($)
Median gross rent ($)
Urban houses (%)
Rural houses (%)
Houses occupied (%)
Houses occupied (% change since 2000)
Houses owner occupied (%)
Houses owner occupied (% change since 2000)
Houses renter occupied (%)
Houses renter occupied (% change since 2000)
Vacant housing units - For rent (%)
Vacant housing units - For rent (% change since 2000)
Vacant housing units - For sale only (%)
Vacant housing units - For sale only (% change since 2000)
Vacant housing units - Rented or sold, not occupied (%)
Vacant housing units - Rented or sold, not occupied (% change since 2000)
Vacant housing units - For seasonal, recreational, or occasional use (%)
Vacant housing units - For seasonal, recreational, or occasional use (% change since 2000)
Vacant housing units - For migrant workers (%)
Vacant housing units - For migrant workers (% change since 2000)
Vacant housing units - Other vacant (%)
Vacant housing units - Other vacant (% change since 2000)
Median monthly housing costs ($)
Median household income for houses/condos with a mortgage ($)
Median household income for houses/condos without a mortgage ($)
Median household income ($)
Median household income ($) - White
Median household income ($) - Black or African American
Median household income ($) - Asian
Median household income ($) - Hispanic or Latino
Median household income ($) - American Indian and Alaska Native
Median household income ($) - Multirace
Median household income ($) - Other Race
Mortgage status - with mortgage (%)
Mortgage status - with second mortgage (%)
Mortgage status - with home equity loan (%)
Mortgage status - with both second mortgage and home equity loan (%)
Mortgage status - without a mortgage (%)
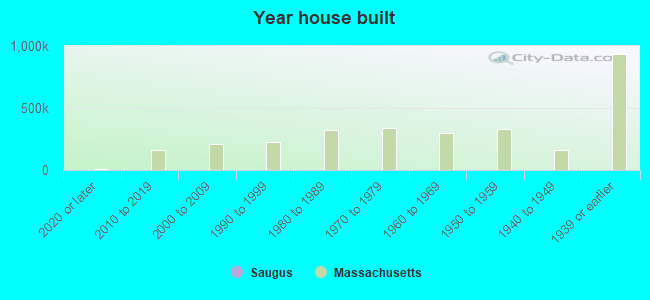
Median year house/condo built
Median year apartment built
Household type by relationship - Male householder living alone (%)
Household type by relationship - Male householder not living alone (%)
Household type by relationship - Female householder living alone (%)
Household type by relationship - Female householder not living alone (%)
Household type by relationship - Opposite-Sex spouse (%)
Household type by relationship - Same-Sex spouse (%)
Household type by relationship - Opposite-Sex unmarried partner (%)
Household type by relationship - Same-Sex unmarried partner (%)
Household type by relationship - In group quarters (%)
Size of family households - 2-person household (%)
Size of family households - 3-person household (%)
Size of family households - 4-person household (%)
Size of family households - 5-person household (%)
Size of family households - 6-person household (%)
Size of family households - 7-or-more-person household (%)
Size of nonfamily households - 1-person household (%)
Size of nonfamily households - 2-person household (%)
Size of nonfamily households - 3-person household (%)
Size of nonfamily households - 4-person household (%)
Size of nonfamily households - 5-person household (%)
Size of nonfamily households - 6-person household (%)
Size of nonfamily households - 7-or-moreperson household (%)
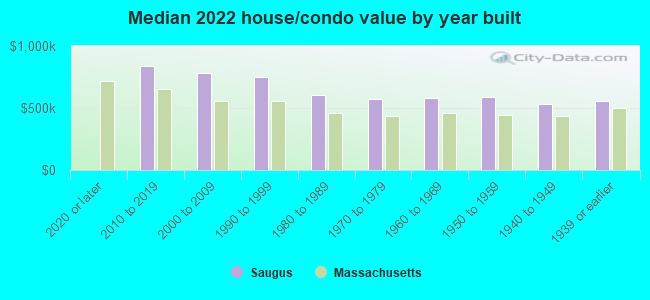
Year house built - Built 2010 or later (%)
Year house built - Built 2000 to 2009 (%)
Year house built - Built 1990 to 1999 (%)
Year house built - Built 1980 to 1989 (%)
Year house built - Built 1970 to 1979 (%)
Year house built - Built 1960 to 1969 (%)
Year house built - Built 1950 to 1959 (%)
Year house built - Built 1940 to 1949 (%)
Year house built - Built 1939 or earlier (%)
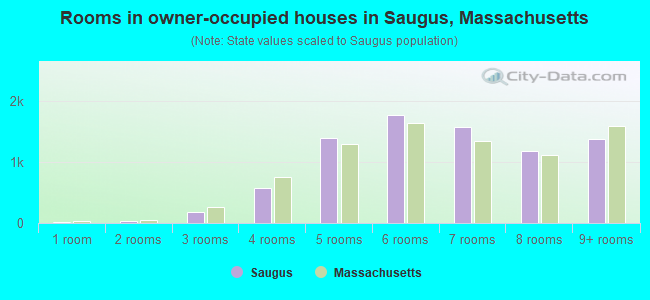
Median number of rooms in houses and condos
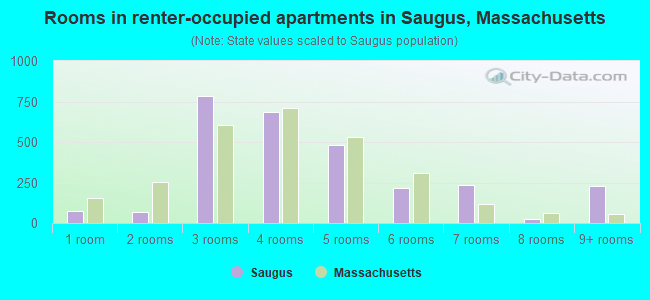
Median number of rooms in apartments
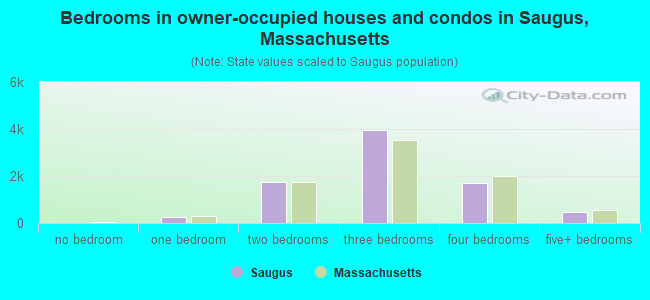
Median number of bedrooms in owner occupied houses
Mean number of bedrooms in owner occupied houses
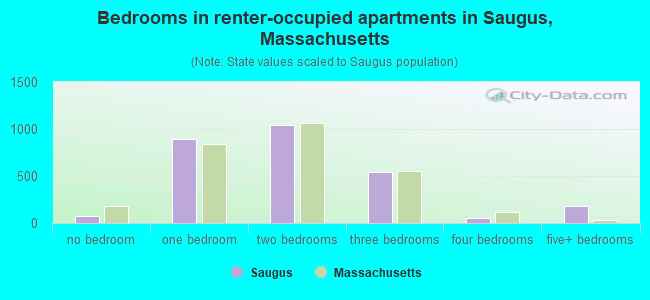
Median number of bedrooms in renter occupied houses
Mean number of bedrooms in renter occupied houses
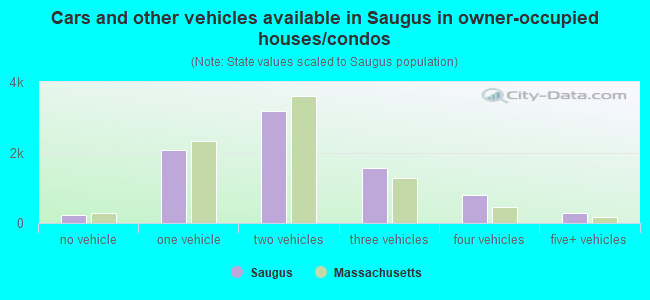
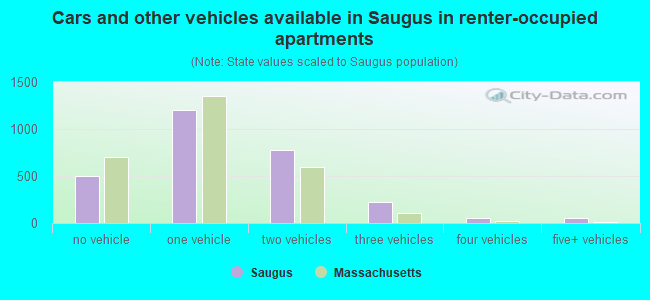
Median number of vehichles in owner occupied houses
Mean number of vehichles in owner occupied houses
Median number of vehichles in renter occupied houses
Mean number of vehichles in renter occupied houses
Rooms in owner-occupied houses - 1 room (%)
Rooms in owner-occupied houses - 2 rooms (%)
Rooms in owner-occupied houses - 3 rooms (%)
Rooms in owner-occupied houses - 4 rooms (%)
Rooms in owner-occupied houses - 5 rooms (%)
Rooms in owner-occupied houses - 6 rooms (%)
Rooms in owner-occupied houses - 7 rooms (%)
Rooms in owner-occupied houses - 8 rooms (%)
Rooms in owner-occupied houses - 9+ rooms (%)
Rooms in renter-occupied houses - 1 room (%)
Rooms in renter-occupied houses - 2 rooms (%)
Rooms in renter-occupied houses - 3 rooms (%)
Rooms in renter-occupied houses - 4 rooms (%)
Rooms in renter-occupied houses - 5 rooms (%)
Rooms in renter-occupied houses - 6 rooms (%)
Rooms in renter-occupied houses - 7 rooms (%)
Rooms in renter-occupied houses - 8 rooms (%)
Rooms in renter-occupied houses - 9+ rooms (%)
Bedrooms in owner-occupied houses - no bedrooms (%)
Bedrooms in owner-occupied houses - 1 bedroom (%)
Bedrooms in owner-occupied houses - 2 bedrooms (%)
Bedrooms in owner-occupied houses - 3 bedrooms (%)
Bedrooms in owner-occupied houses - 4 bedrooms (%)
Bedrooms in owner-occupied houses - 5+ bedrooms (%)
Bedrooms in renter-occupied houses - no bedrooms (%)
Bedrooms in renter-occupied houses - 1 bedroom (%)
Bedrooms in renter-occupied houses - 2 bedrooms (%)
Bedrooms in renter-occupied houses - 3 bedrooms (%)
Bedrooms in renter-occupied houses - 4 bedrooms (%)
Bedrooms in renter-occupied houses - 5+ bedrooms (%)
Vehicles available in owner-occupied houses - no vehicle available (%)
Vehicles available in owner-occupied houses - 1 vehicle available(%)
Vehicles available in owner-occupied houses - 2 Vehicles available (%)
Vehicles available in owner-occupied houses - 3 Vehicles available (%)
Vehicles available in owner-occupied houses - 4 Vehicles available (%)
Vehicles available in owner-occupied houses - 5+ Vehicles available (%)
Vehicles available in renter-occupied houses - no vehicle available (%)
Vehicles available in renter-occupied houses - 1 vehicle available (%)
Vehicles available in renter-occupied houses - 2 Vehicles available (%)
Vehicles available in renter-occupied houses - 3 Vehicles available (%)
Vehicles available in renter-occupied houses - 4 Vehicles available (%)
Vehicles available in renter-occupied houses - 5+ Vehicles available (%)
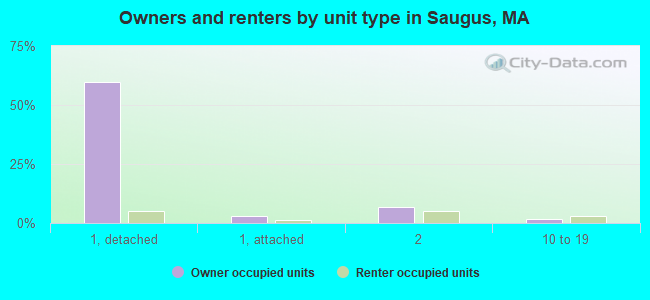
Housing units in structures - 1, detached (%)
Housing units in structures - 1, attached (%)
Housing units in structures - 2 (%)
Housing units in structures - 3 or 4 (%)
Housing units in structures - 5 to 9 (%)
Housing units in structures - 10 to 19 (%)
Housing units in structures - 20 to 49 (%)
Housing units in structures - 50 or more (%)
Housing units in structures - Mobile home (%)
Housing units in structures - Boat, RV, van, etc. (%)
Housing units in structures - Owners - 1, detached (%)
Housing units in structures - Owners - 1, attached (%)
Housing units in structures - Owners - 2 (%)
Housing units in structures - Owners - 3 or 4 (%)
Housing units in structures - Owners - 5 to 9 (%)
Housing units in structures - Owners - 10 to 19 (%)
Housing units in structures - Owners - 20 to 49 (%)
Housing units in structures - Owners - 50 or more (%)
Housing units in structures - Owners - Mobile home (%)
Housing units in structures - Owners - Boat, RV, van, etc. (%)
Housing units in structures - Renters - 1, detached (%)
Housing units in structures - Renters - 1, attached (%)
Housing units in structures - Renters - 2 (%)
Housing units in structures - Renters - 3 or 4 (%)
Housing units in structures - Renters - 5 to 9 (%)
Housing units in structures - Renters - 10 to 19 (%)
Housing units in structures - Renters - 20 to 49 (%)
Housing units in structures - Renters - 50 or more (%)
Housing units in structures - Renters - Mobile home (%)
Housing units in structures - Renters - Boat, RV, van, etc. (%)
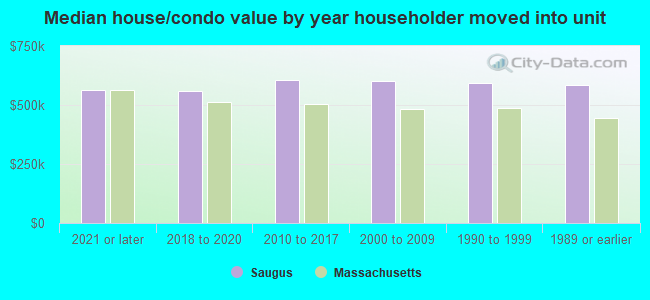
House/condo owner moved in on average (years ago)
Renter moved in on average (years ago)
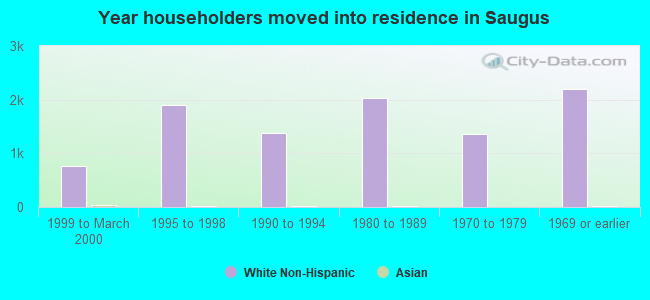
Year householder moved into unit - Moved in 1999 to March 2000 (%)
Year householder moved into unit - Moved in 1999 to March 2000 (%) - White
Year householder moved into unit - Moved in 1999 to March 2000 (%) - Black or African American
Year householder moved into unit - Moved in 1999 to March 2000 (%) - Asian
Year householder moved into unit - Moved in 1999 to March 2000 (%) - Hispanic or Latino
Year householder moved into unit - Moved in 1999 to March 2000 (%) - American Indian and Alaska Native
Year householder moved into unit - Moved in 1999 to March 2000 (%) - Multirace
Year householder moved into unit - Moved in 1999 to March 2000 (%) - Other Race
Year householder moved into unit - Moved in 1995 to 1998 (%)
Year householder moved into unit - Moved in 1995 to 1998 (%) - White
Year householder moved into unit - Moved in 1995 to 1998 (%) - Black or African American
Year householder moved into unit - Moved in 1995 to 1998 (%) - Asian
Year householder moved into unit - Moved in 1995 to 1998 (%) - Hispanic or Latino
Year householder moved into unit - Moved in 1995 to 1998 (%) - American Indian and Alaska Native
Year householder moved into unit - Moved in 1995 to 1998 (%) - Multirace
Year householder moved into unit - Moved in 1995 to 1998 (%) - Other Race
Year householder moved into unit - Moved in 1990 to 1994 (%)
Year householder moved into unit - Moved in 1990 to 1994 (%) - White
Year householder moved into unit - Moved in 1990 to 1994 (%) - Black or African American
Year householder moved into unit - Moved in 1990 to 1994 (%) - Asian
Year householder moved into unit - Moved in 1990 to 1994 (%) - Hispanic or Latino
Year householder moved into unit - Moved in 1990 to 1994 (%) - American Indian and Alaska Native
Year householder moved into unit - Moved in 1990 to 1994 (%) - Multirace
Year householder moved into unit - Moved in 1990 to 1994 (%) - Other Race
Year householder moved into unit - Moved in 1980 to 1989 (%)
Year householder moved into unit - Moved in 1980 to 1989 (%) - White
Year householder moved into unit - Moved in 1980 to 1989 (%) - Black or African American
Year householder moved into unit - Moved in 1980 to 1989 (%) - Asian
Year householder moved into unit - Moved in 1980 to 1989 (%) - Hispanic or Latino
Year householder moved into unit - Moved in 1980 to 1989 (%) - American Indian and Alaska Native
Year householder moved into unit - Moved in 1980 to 1989 (%) - Multirace
Year householder moved into unit - Moved in 1980 to 1989 (%) - Other Race
Year householder moved into unit - Moved in 1970 to 1979 (%)
Year householder moved into unit - Moved in 1970 to 1979 (%) - White
Year householder moved into unit - Moved in 1970 to 1979 (%) - Black or African American
Year householder moved into unit - Moved in 1970 to 1979 (%) - Asian
Year householder moved into unit - Moved in 1970 to 1979 (%) - Hispanic or Latino
Year householder moved into unit - Moved in 1970 to 1979 (%) - American Indian and Alaska Native
Year householder moved into unit - Moved in 1970 to 1979 (%) - Multirace
Year householder moved into unit - Moved in 1970 to 1979 (%) - Other Race
Year householder moved into unit - Moved in 1969 or earlier (%)
Year householder moved into unit - Moved in 1969 or earlier (%) - White
Year householder moved into unit - Moved in 1969 or earlier (%) - Black or African American
Year householder moved into unit - Moved in 1969 or earlier (%) - Asian
Year householder moved into unit - Moved in 1969 or earlier (%) - Hispanic or Latino
Year householder moved into unit - Moved in 1969 or earlier (%) - American Indian and Alaska Native
Year householder moved into unit - Moved in 1969 or earlier (%) - Multirace
Year householder moved into unit - Moved in 1969 or earlier (%) - Other Race
Housing units lacking complete plumbing facilities (%)
Housing units lacking complete kitchen facilities (%)
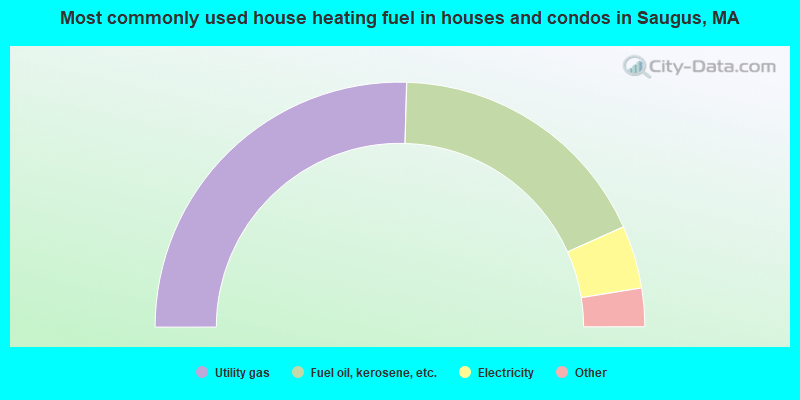
House heating fuel used in houses and condos - Utility gas (%)
House heating fuel used in houses and condos - Bottled, tank, or LP gas (%)
House heating fuel used in houses and condos - Electricity (%)
House heating fuel used in houses and condos - Fuel oil, kerosene, etc. (%)
House heating fuel used in houses and condos - Coal or coke (%)
House heating fuel used in houses and condos - Wood (%)
House heating fuel used in houses and condos - Solar energy (%)
House heating fuel used in houses and condos - Other fuel (%)
House heating fuel used in houses and condos - No fuel used (%)
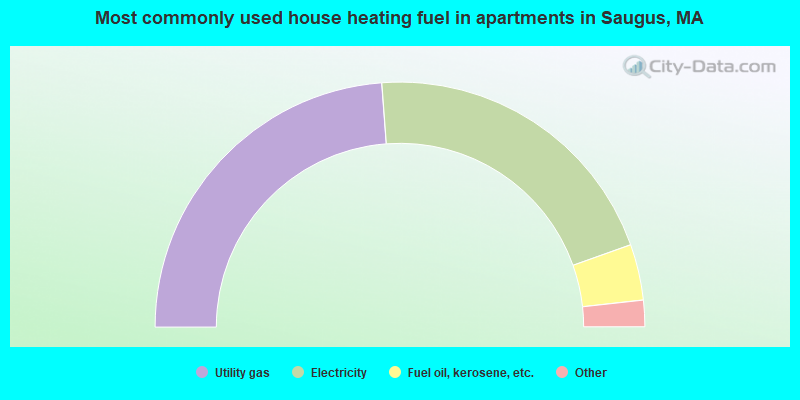
House heating fuel used in apartments - Utility gas (%)
House heating fuel used in apartments - Bottled, tank, or LP gas (%)
House heating fuel used in apartments - Electricity (%)
House heating fuel used in apartments - Fuel oil, kerosene, etc. (%)
House heating fuel used in apartments - Coal or coke (%)
House heating fuel used in apartments - Wood (%)
House heating fuel used in apartments - Solar energy (%)
House heating fuel used in apartments - Other fuel (%)
House heating fuel used in apartments - No fuel used (%)
Latest news about housing in Saugus, MA collected exclusively by city-data.com from local newspapers, TV, and radio stations
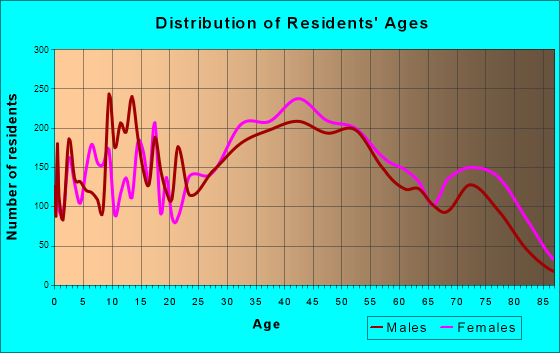
Median year house/condo built: 1958Median year apartment built: 1968Household type by relationship:
Households: 28,589
Male householders: 4,901 (924 living alone ), Female householders: 5,875 (1,669 living alone )6,089 spouses (5,895 opposite-sex spouses ), 873 unmarried partners , (838 opposite-sex unmarried partners ), 7,318 children (6,711 natural , 165 adopted , 441 stepchildren ), 608 grandchildren , 388 brothers or sisters , 743 parents , 13 foster children , 566 other relatives , 891 non-relatives In group quarters: 319
Size of family households: 2,970 2-persons , 1,826 3-persons , 1,435 4-persons , 848 5-persons , 228 6-persons , 115 7-or-more-persons .
Size of nonfamily households: 2,795 1-person , 589 2-persons , 46 3-persons , 33 5-persons .
3,062 married couples with children. single-parent households (211 men , 606 women ).
73.7% of residents of Saugus speak English at home. of residents speak Spanish at home (63% speak English very well , 23% speak English well , 11% speak English not well , 3% don't speak English at all ).of residents speak other Indo-European language at home (74% speak English very well , 15% speak English well , 9% speak English not well , 3% don't speak English at all ).of residents speak Asian or Pacific Island language at home (48% speak English very well , 40% speak English well , 7% speak English not well , 5% don't speak English at all ).of residents speak other language at home (54% speak English very well , 16% speak English well , 30% don't speak English at all ).
Foreign born population: 5,137 (18.0%)of them are naturalized citizens )
Median number of rooms in houses and condos:
Median number of rooms in apartments
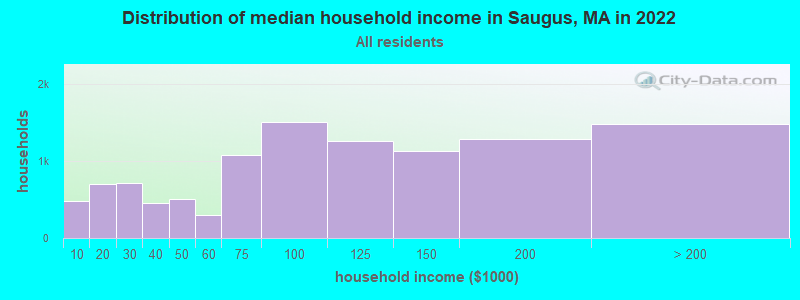
Saugus, MA household income distribution 481 Less than $10,000706 $10,000 to $19,999719 $20,000 to $29,999460 $30,000 to $39,999500 $40,000 to $49,999305 $50,000 to $59,9991,074 $60,000 to $74,9991,506 $75,000 to $99,9991,256 $100,000 to $124,9991,134 $125,000 to $149,9991,279 $150,000 to $199,9991,485 $200,000 or more
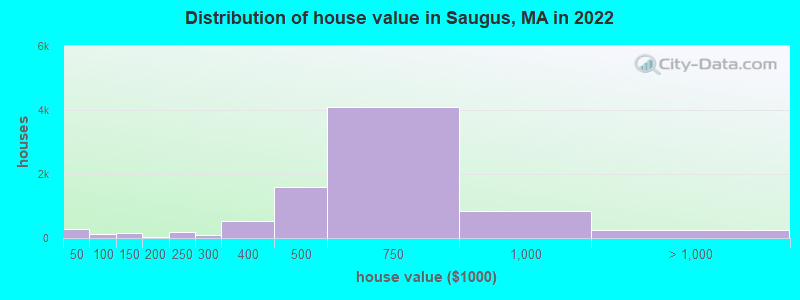
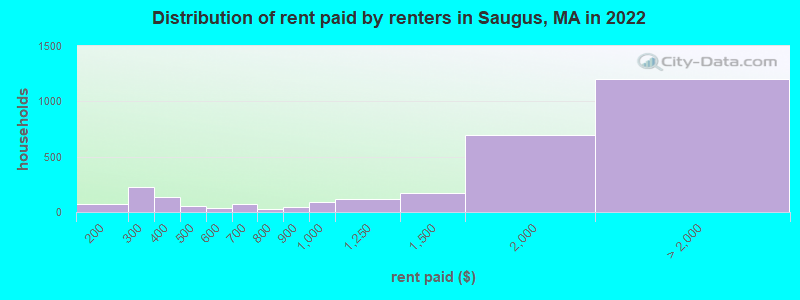
Home value of owner - occupied houses in 2022 in Saugus, MA 193 Less than $10,00023 $20,000 to $24,99927 $35,000 to $39,99929 $40,000 to $49,99928 $50,000 to $59,99953 $90,000 to $99,999148 $100,000 to $124,99917 $150,000 to $174,99926 $175,000 to $199,999177 $200,000 to $249,999106 $250,000 to $299,999529 $300,000 to $399,9991,604 $400,000 to $499,9994,096 $500,000 to $749,999856 $750,000 to $999,999189 $1,000,000 to $1,499,99937 $1,500,000 to $1,999,99931 $2,000,000 or moreRent paid by renters in 2022 in Saugus, MA 70 $100 to $14986 $200 to $249140 $250 to $29997 $300 to $34938 $350 to $39955 $450 to $49938 $500 to $54922 $600 to $64951 $650 to $69911 $700 to $74917 $750 to $79946 $800 to $89993 $900 to $999118 $1,000 to $1,249172 $1,250 to $1,499695 $1,500 to $1,999414 $2,000 to $2,499273 $2,500 to $2,999301 $3,000 to $3,49976 $3,500 or more137 No cash rent
Percentage of workers working in this county: 41.9%Number of people working at home: 2,056 (13.8% of all workers )
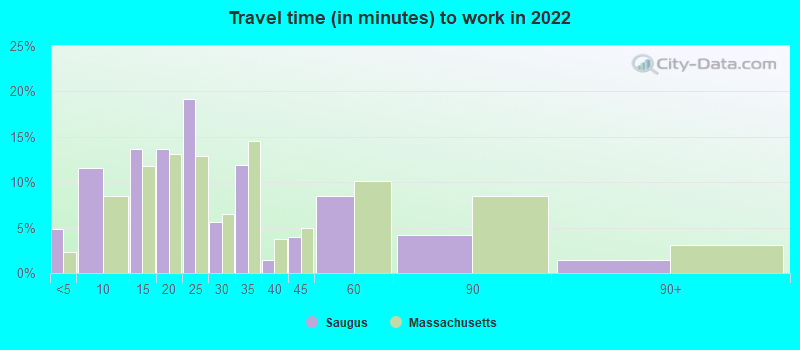
Travel time to work (commute)
Less than 5 minutes: 2885 to 9 minutes: 1,08810 to 14 minutes: 77515 to 19 minutes: 1,53120 to 24 minutes: 1,79525 to 29 minutes: 1,17930 to 34 minutes: 2,53435 to 39 minutes: 50740 to 44 minutes: 93845 to 59 minutes: 1,15560 to 89 minutes: 82090 or more minutes: 358
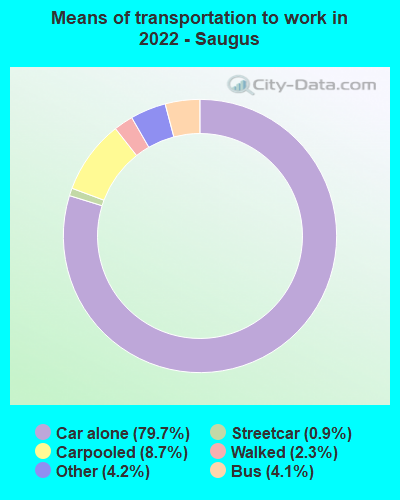
Means of transportation to work:
Drove a car alone: 6,413 (64.3%)Carpooled: 533 (5.3%)Bus : 272 (2.7%)Subway or elevated rail : 66 (0.7%)Taxi: 508 (5.1%)Walked: 166 (1.7%)Worked at home: 2,056 (20.6%)
Unemployment by race in 2022
Unemployment rate for White non-Hispanic residents 1.6% Males2.4% FemalesUnemployment rate for other race residents 1.7% Males6.6% FemalesUnemployment rate for two or more race residents 2.9% MalesUnemployment rate for Hispanic or Latino residents 1.5% Males1.7% Females
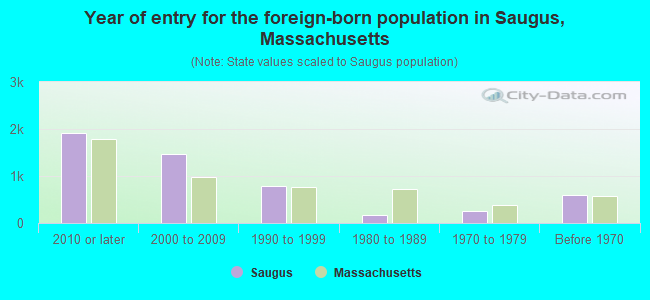
Year of entry for the foreign-born population in Saugus, Massachusetts
1,907 2010 or later 1,465 2000 to 2009 789 1990 to 1999 178 1980 to 1989 260 1970 to 1979 604 Before 1970
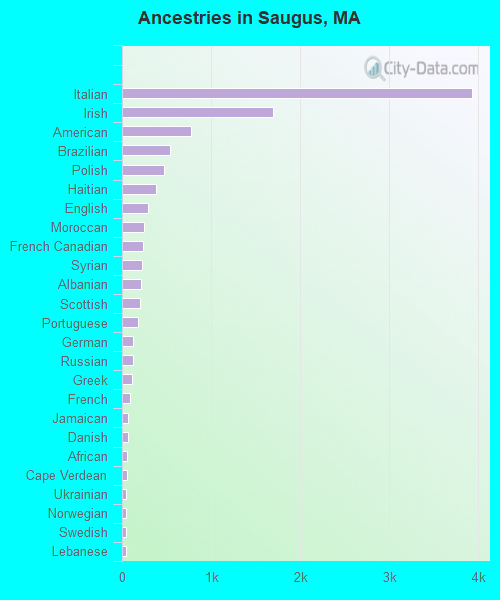
First ancestries reported:
Italian: 3,926 (29.4%)
Irish: 1,698 (12.7%)
American: 779 (5.8%)
Brazilian: 535 (4.0%)
Polish: 469 (3.5%)
Haitian: 383 (2.9%)
English: 289 (2.2%)
Moroccan: 248 (1.9%)
French Canadian: 231 (1.7%)
Syrian: 228 (1.7%)
Albanian: 208 (1.6%)
Scottish: 202 (1.5%)
Portuguese: 178 (1.3%)
German: 129 (1.0%)
Russian: 119 (0.9%)
Greek: 108 (0.8%)
French: 94 (0.7%)
Jamaican: 73 (0.5%)
Danish: 69 (0.5%)
African: 56 (0.4%)
Cape Verdean: 55 (0.4%)
Ukrainian: 47 (0.4%)
Norwegian: 46 (0.3%)
Swedish: 43 (0.3%)
Lebanese: 42 (0.3%)
Armenian: 41 (0.3%)
Finnish: 19 (0.1%)
Jordanian: 17 (0.1%)
Scotch-Irish: 15 (0.1%)
European: 13 (0.10%)
Dutch: 12 (0.09%)
Canadian: 7 (0.05%)
Celtic: 6 (0.05%)
Welsh: 6 (0.05%)
Eastern European: 3 (0.02%)
Northern European: 2 (0.02%) Most common places of birth for foreign-born residents (%): Brazil Saugus:
22.5% (1,117)Massachusetts:
7.6% (92,959)
El Salvador Saugus:
8.8% (437)Massachusetts:
3.7% (45,667)
Morocco Saugus:
6.6% (329)Massachusetts:
0.7% (8,562)
Guatemala Saugus:
6.4% (316)Massachusetts:
2.7% (32,733)
Colombia Saugus:
6.3% (314)Massachusetts:
2.3% (27,810)
China, excluding Hong Kong and Taiwan Saugus:
5.5% (274)Massachusetts:
8.4% (103,233)
Haiti Saugus:
5.1% (251)Massachusetts:
4.9% (60,432)
Italy Saugus:
4.9% (245)Massachusetts:
1.4% (16,886)
Syria Saugus:
3.6% (180)Massachusetts:
0.2% (2,918)
Dominican Republic Saugus:
2.9% (143)Massachusetts:
8.3% (101,767)
Canada Saugus:
2.8% (140)Massachusetts:
2.3% (28,158)
Albania Saugus:
2.5% (124)Massachusetts:
1.1% (13,076)
Poland Saugus:
2.4% (121)Massachusetts:
0.9% (10,915)
Other Eastern Europe Saugus:
2.4% (117)Massachusetts:
0.3% (4,128)
Cabo Verde Saugus:
1.8% (91)Massachusetts:
2.6% (32,354)
Peru Saugus:
1.8% (88)Massachusetts:
0.6% (7,349)
Honduras Saugus:
1.6% (80)Massachusetts:
1.1% (13,563)
Place of birth for U.S.-born residents:
This state: 20,915Other state: 2,172Northeast: 1,066Midwest: 314South: 511West: 274 93.0% of Saugus residents lived in the same house 1 years ago.
Out of people who lived in different houses, 19.5% lived in this county.
Out of people who lived in different counties, 82.3% lived in Massachusetts.
Saugus:
93.0%State average:
87.7%
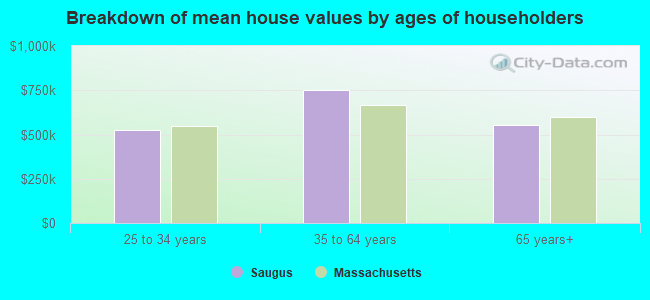
Education attainment for males 25 years and older:
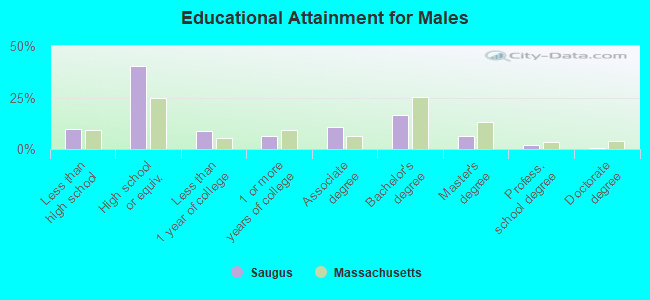
No schooling: 223Nursery to 4th grade: 305th and 6th grade: 637th and 8th grade: 1389th grade: 7610th grade: 17511th grade: 5012th grade, no diploma: 274High school graduate (or equivalency): 4,227Less than 1 year of college: 916Some college more than 1 year, no degree: 652Associate degree: 1,128Bachelor's degree: 1,715Master's degree: 648Professional school degree: 194Doctorate degree: 29
Education attainment for females 25 years and older:
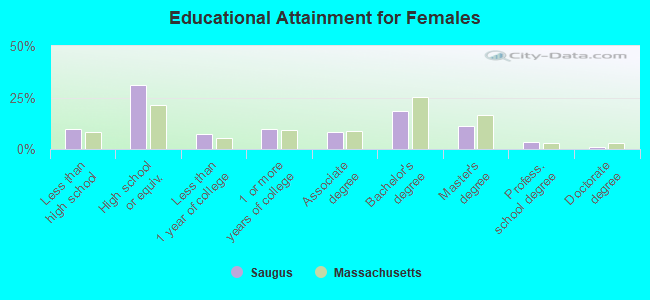
No schooling: 289Nursery to 4th grade: 265th and 6th grade: 1717th and 8th grade: 319th grade: 8210th grade: 16611th grade: 13512th grade, no diploma: 220High school graduate (or equivalency): 3,555Less than 1 year of college: 804Some college more than 1 year, no degree: 1,113Associate degree: 922Bachelor's degree: 2,094Master's degree: 1,284Professional school degree: 383Doctorate degree: 128
Housing units in structures:
One, detached: 7,505One, attached: 485Two: 1,4003 or 4: 3515 to 9: 27910 to 19: 48020 to 49: 49850 or more: 251Mobile homes: 146Median worth of mobile homes: $107,568
Housing units lacking complete plumbing facilities in 2022: 0.1%Housing units lacking complete kitchen facilities in 2022: 0.6%House/condo owner moved in on average 19 years ago
Renter moved in on average 1 years ago
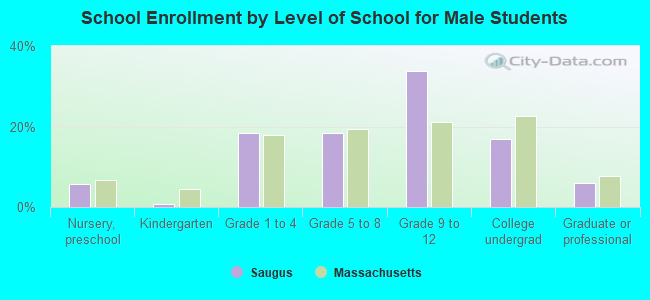
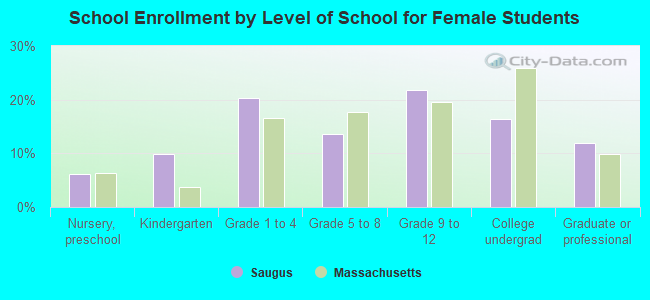
Private vs. public school enrollment:
Students in private schools in grades 1 to 8 (elementary and middle school): 324 Here:
17.7%Massachusetts:
10.3%
Students in private schools in grades 9 to 12 (high school): 165 Here:
11.5%Massachusetts:
12.3%
Students in private undergraduate colleges: 236 Here:
28.5%Massachusetts:
51.2%