Housing density: 2,301 houses/condos per square mile
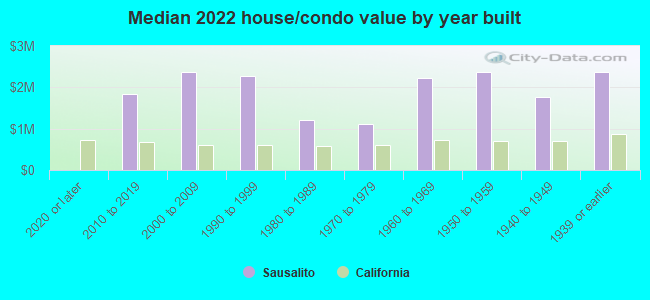
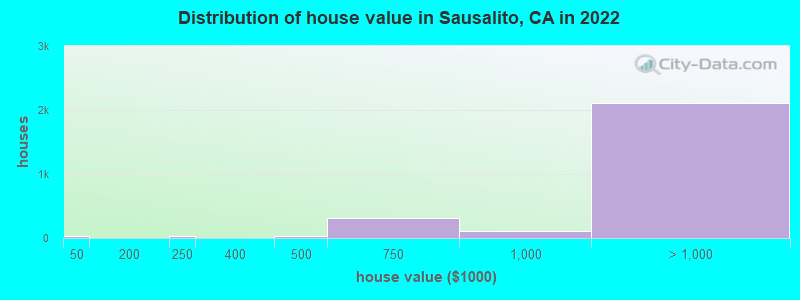
Median price asked for vacant for-sale houses and condos in 2022 in this county: $3,364,178.
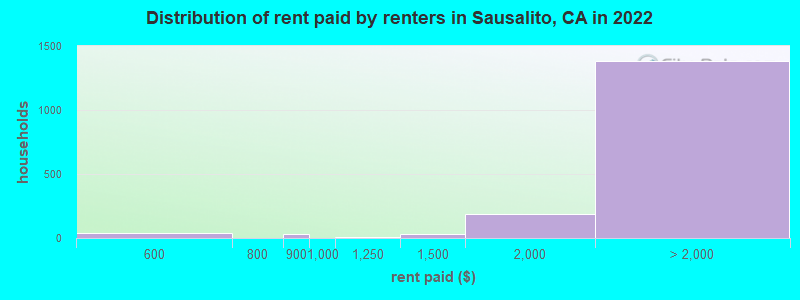
Median contract rent in 2022: over $2,000
Median rent asked for vacant for-rent units in 2022: $3,975
Median gross rent in Sausalito, CA in 2022: over $2,000
Housing units in Sausalito with a mortgage: 1,463 (98 second mortgage, 0 home equity loan, 96 both second mortgage and home equity loan) Houses without a mortgage: 20
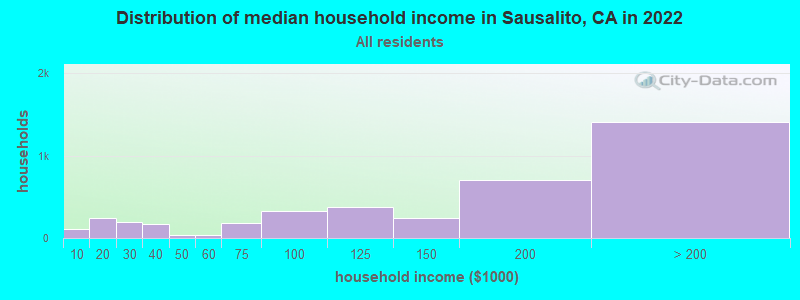
Median household income for houses/condos with a mortgage: $188,428
Median household income for apartments without a mortgage: $173,711
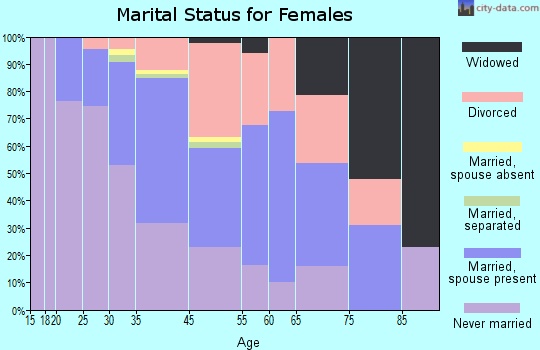
347 married couples with children.
194 single-parent households (125 men, 69 women).
88.2% of residents of Sausalito speak English at home.
2.2% of residents speak Spanish at home (100% speak English very well).
6.0% of residents speak other Indo-European language at home (90% speak English very well, 10% speak English well).
2.7% of residents speak Asian or Pacific Island language at home (85% speak English very well, 15% speak English well).
1.3% of residents speak other language at home (58% speak English very well, 42% speak English well).
Foreign born population: 1,104 (15.5%)
(60.0% of them are naturalized citizens)
Percentage of workers working in this county: 66.9% Number of people working at home: 1,917 (49.0% of all workers)
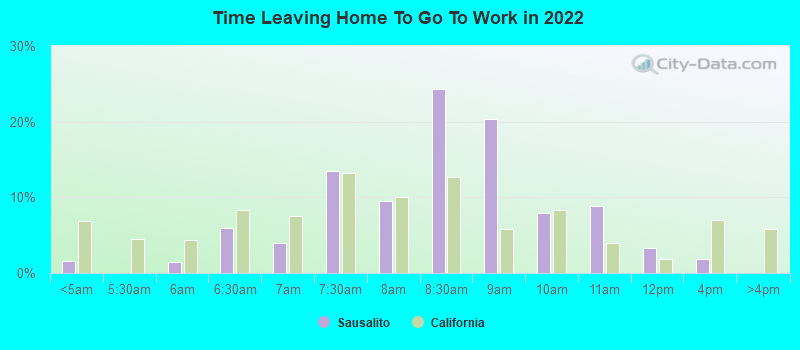
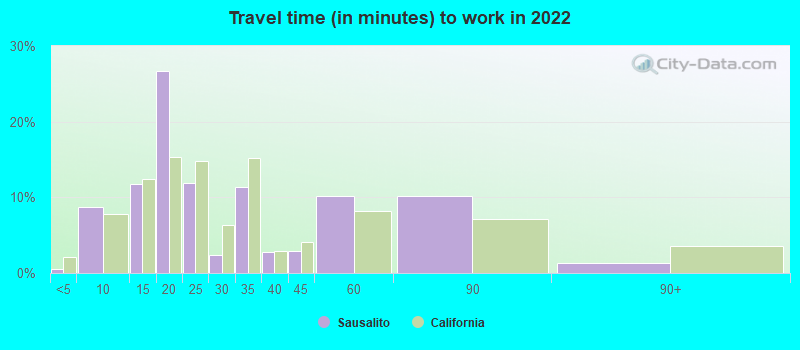
Travel time to work (commute)
Less than 5 minutes: 10
5 to 9 minutes: 239
10 to 14 minutes: 326
15 to 19 minutes: 200
20 to 24 minutes: 167
25 to 29 minutes: 180
30 to 34 minutes: 252
35 to 39 minutes: 54
40 to 44 minutes: 233
45 to 59 minutes: 221
60 to 89 minutes: 207
90 or more minutes: 52
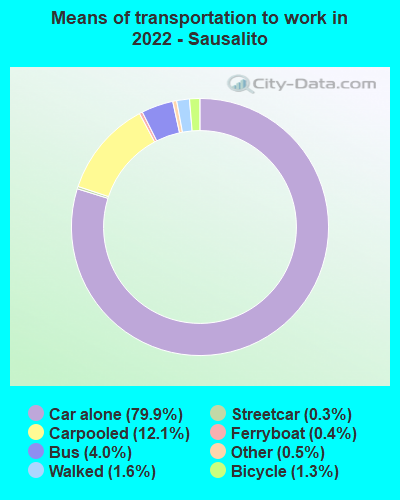
Means of transportation to work:
Drove a car alone: 3,069 (52.3%)
Carpooled: 442 (7.5%)
Bus: 207 (3.5%)
Subway or elevated rail: 12 (0.2%)
Ferryboat: 16 (0.3%)
Taxi: 31 (0.5%)
Bicycle: 105 (1.8%)
Walked: 80 (1.4%)
Worked at home: 1,917 (32.7%)
Unemployment by race in 2022
Unemployment rate for White non-Hispanic residents
2.3%Males
10.1%Females
Unemployment rate for Asian residents
5.6%Females
Unemployment rate for two or more race residents
2.5%Females
Unemployment rate for Hispanic or Latino residents
3.1%Females
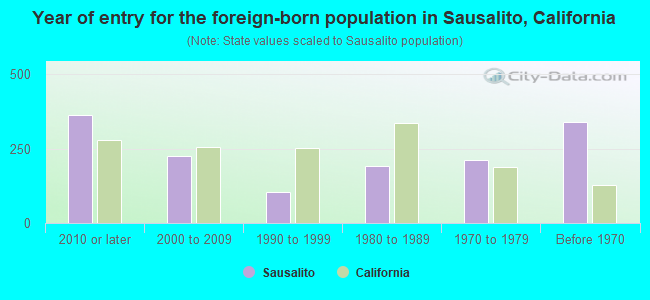
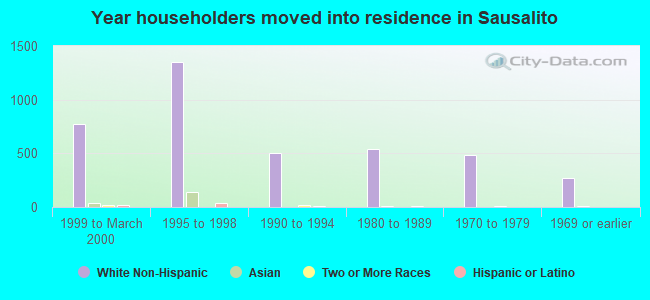
Year of entry for the foreign-born population in Sausalito, California
3632010 or later
2252000 to 2009
1041990 to 1999
1921980 to 1989
2131970 to 1979
341Before 1970
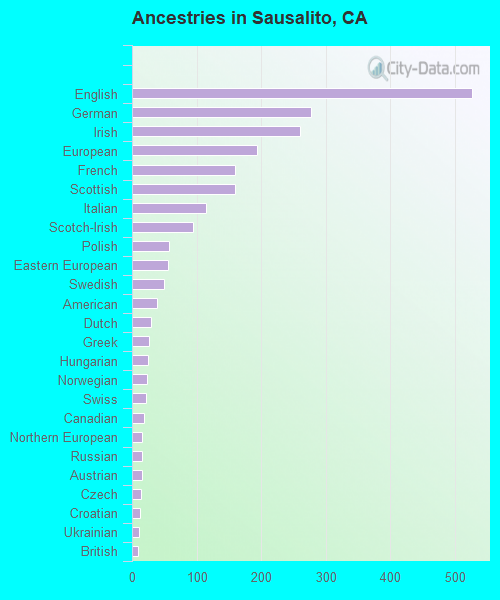
First ancestries reported:
English: 527 (16.7%)
German: 278 (8.8%)
Irish: 261 (8.3%)
European: 193 (6.1%)
French: 159 (5.0%)
Scottish: 159 (5.0%)
Italian: 114 (3.6%)
Scotch-Irish: 95 (3.0%)
Polish: 57 (1.8%)
Eastern European: 56 (1.8%)
Swedish: 49 (1.6%)
American: 39 (1.2%)
Dutch: 29 (0.9%)
Greek: 27 (0.9%)
Hungarian: 25 (0.8%)
Norwegian: 24 (0.8%)
Swiss: 21 (0.7%)
Canadian: 19 (0.6%)
Northern European: 16 (0.5%)
Russian: 16 (0.5%)
Austrian: 15 (0.5%)
Czech: 14 (0.4%)
Croatian: 12 (0.4%)
Ukrainian: 11 (0.3%)
British: 10 (0.3%)
Scandinavian: 8 (0.3%)
Israeli: 7 (0.2%)
Portuguese: 7 (0.2%)
Latvian: 5 (0.2%)
Danish: 1 (0.03%)
Most common places of birth for foreign-born residents (%):
France
Sausalito:
14.0% (156)
California:
0.4% (40,224)
India
Sausalito:
8.9% (99)
California:
5.2% (539,184)
Philippines
Sausalito:
8.2% (91)
California:
7.8% (818,297)
Ireland
Sausalito:
6.9% (77)
California:
0.2% (16,042)
Spain
Sausalito:
5.9% (66)
California:
0.2% (16,586)
England
Sausalito:
5.6% (62)
California:
0.6% (57,953)
Canada
Sausalito:
4.0% (45)
California:
1.2% (127,477)
Poland
Sausalito:
3.9% (43)
California:
0.2% (20,997)
Germany
Sausalito:
3.6% (40)
California:
0.7% (73,304)
Sweden
Sausalito:
3.4% (38)
California:
0.1% (12,221)
Vietnam
Sausalito:
3.4% (38)
California:
4.9% (512,335)
Malaysia
Sausalito:
3.0% (33)
California:
0.2% (17,929)
Guatemala
Sausalito:
2.8% (31)
California:
2.8% (290,436)
China, excluding Hong Kong and Taiwan
Sausalito:
2.7% (30)
California:
6.6% (684,672)
Australia
Sausalito:
2.4% (27)
California:
0.2% (23,338)
Netherlands
Sausalito:
2.2% (25)
California:
0.2% (17,937)
Korea
Sausalito:
2.0% (22)
California:
3.0% (315,248)
South Africa
Sausalito:
1.6% (18)
California:
0.2% (20,614)
Fiji
Sausalito:
1.5% (17)
California:
0.3% (33,937)
Place of birth for U.S.-born residents:
This state: 3,102
Other state: 2,821
Northeast: 991
Midwest: 691
South: 562
West: 589
87.6% of Sausalito residents lived in the same house 1 years ago. Out of people who lived in different houses, 28.4% lived in this county. Out of people who lived in different counties, 82.5% lived in California.
Sausalito:
87.6%
State average:
88.9%
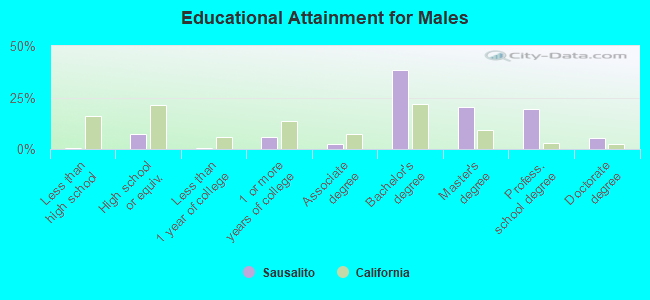
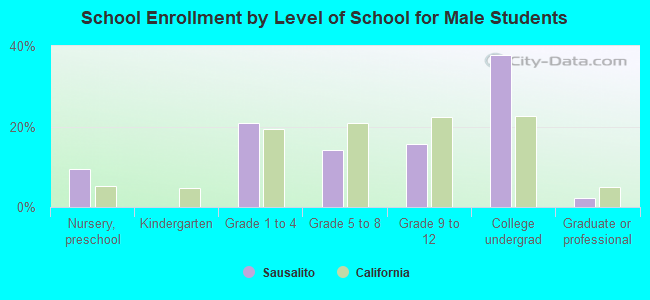
Education attainment for males 25 years and older:
No schooling: 8
Nursery to 4th grade: 0
5th and 6th grade: 0
7th and 8th grade: 0
9th grade: 0
10th grade: 2
11th grade: 0
12th grade, no diploma: 0
High school graduate (or equivalency): 197
Less than 1 year of college: 18
Some college more than 1 year, no degree: 152
Associate degree: 65
Bachelor's degree: 1,023
Master's degree: 540
Professional school degree: 514
Doctorate degree: 139
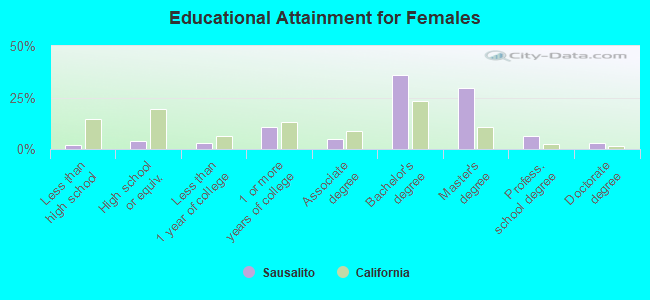
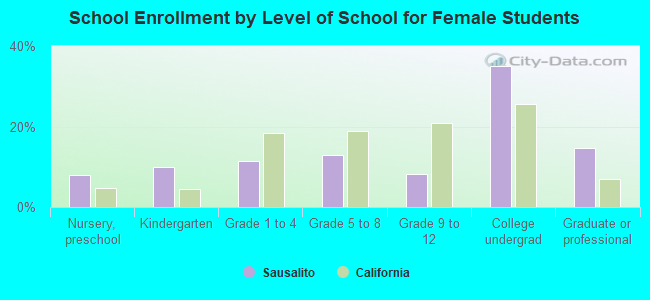
Education attainment for females 25 years and older:
No schooling: 76
Nursery to 4th grade: 0
5th and 6th grade: 0
7th and 8th grade: 0
9th grade: 0
10th grade: 0
11th grade: 0
12th grade, no diploma: 0
High school graduate (or equivalency): 148
Less than 1 year of college: 115
Some college more than 1 year, no degree: 386
Associate degree: 180
Bachelor's degree: 1,330
Master's degree: 1,091
Professional school degree: 241
Doctorate degree: 111
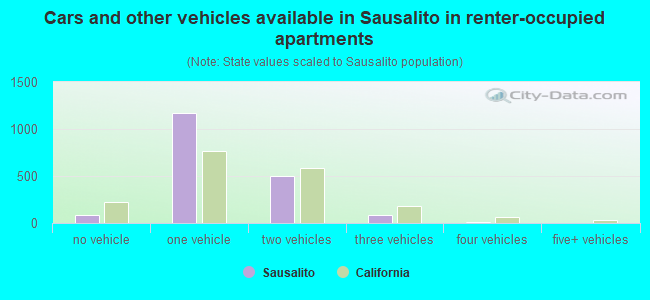
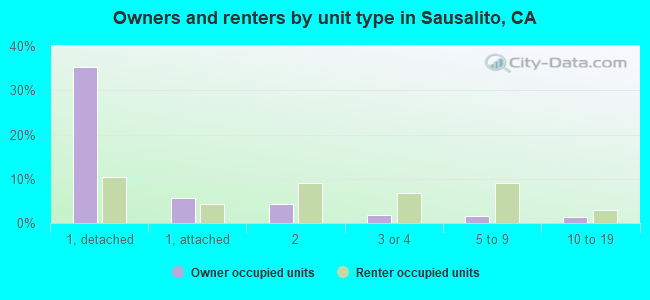
Housing units in structures:
One, detached: 1,731
One, attached: 726
Two: 629
3 or 4: 490
5 to 9: 316
10 to 19: 178
20 to 49: 122
50 or more: 144
Mobile homes: 21
Boats, RVs, vans, etc.: 17
Housing units lacking complete plumbing facilities in 2022: 0.9%
Housing units lacking complete kitchen facilities in 2022: 0.7%
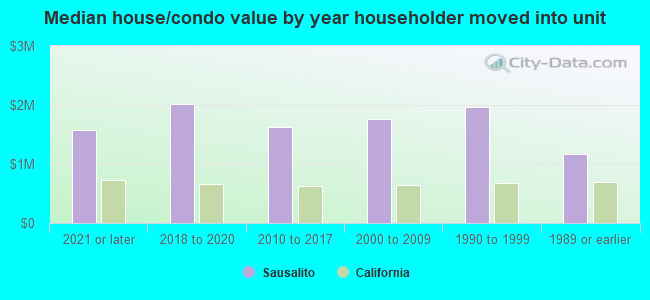
House/condo owner moved in on average 21 years ago