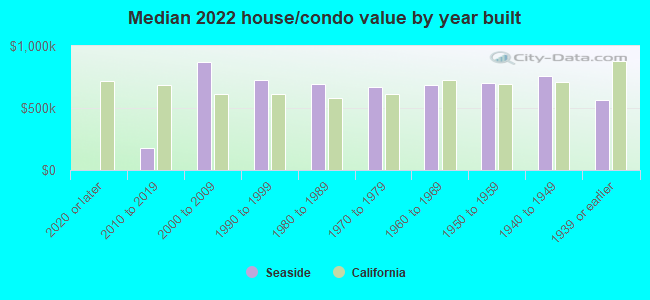
Seaside, CA (California) Houses and Residents
| Seaside: | $698,752 |
| California: | $715,900 |
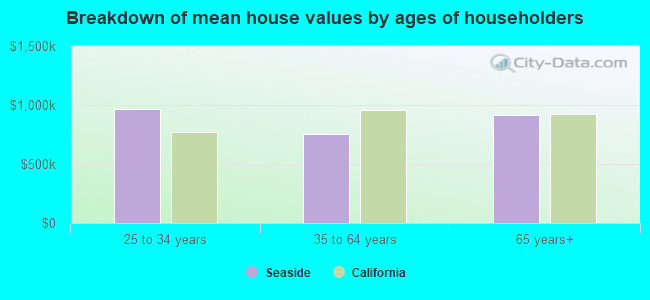
Mean price in 2022:
Detached houses: $687,163
Here: $687,163 State: $988,808 Townhouses or other attached units: $434,482
Here: $434,482 State: $838,546 In 2-unit structures: $622,316
Here: $622,316 State: $1,138,100 In 3-to-4-unit structures: $1,161,087
Here: $1,161,087 State: $824,253 Mobile homes: $120,227
Here: $120,227 State: $184,506
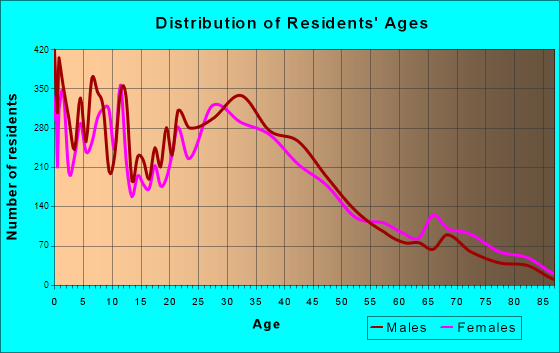
Total population: 34,182 (Urban population: 31,775, Rural population: 11 (all nonfarm))
Houses: 11,258 (10,601 occupied: 4,137 owner occupied, 6,470 renter occupied)
| % of renters here: | 61% |
| State: | 44% |
Housing density: 1,276 houses/condos per square mile
Median price asked for vacant for-sale houses and condos in 2022: $895,794.
Median contract rent in 2022: over $2,000 (lower quartile is $1,549, upper quartile is over $2,000)
Median rent asked for vacant for-rent units in 2022: $4,115
Median gross rent in Seaside, CA in 2022: over $2,000
Housing units in Seaside with a mortgage: 2,645 (219 second mortgage, 0 home equity loan, 205 both second mortgage and home equity loan)
Houses without a mortgage: 16
Median household income for houses/condos with a mortgage: $110,426
Median household income for apartments without a mortgage: $71,221
Median monthly housing costs: $2,053
Compare current foreclosures in Seaside, CA:
| Photo | Address | Area | Beds / Baths | Price | Details |
|---|---|---|---|---|---|

|
#1
Luzern St
Seaside, CA 93955
|
999 sq. feet
|
1 baths 3 beds |
show details | |

|
#2
Sonoma Ave
Seaside, CA 93955
|
996 sq. feet
|
1 baths 2 beds |
show details | |

|
#3
Mescal St
Seaside, CA 93955
|
1,530 sq. feet
|
2 baths 4 beds |
show details | |

|
#4
Yerba Buena Ct
Seaside, CA 93955
|
1,531 sq. feet
|
2 baths 3 beds |
show details | |

|
#5
Luzern St
Seaside, CA 93955
|
1,040 sq. feet
|
1 baths 3 beds |
show details | |

|
#6
Waring St
Seaside, CA 93955
|
715 sq. feet
|
1 baths 1 beds |
show details | |

|
#7
Luxton St
Seaside, CA 93955
|
570 sq. feet
|
1 baths 2 beds |
show details | |

|
#8
Sunset Vista Dr
Seaside, CA 93955
|
3,208 sq. feet
|
2 baths 3 beds |
show details | |

|
#9
Luzern St
Seaside, CA 93955
|
1,039 sq. feet
|
1 baths 3 beds |
show details | |

|
#10
Lindberg Ct
Seaside, CA 93955
|
2,302 sq. feet
|
2 baths 3 beds |
show details |
| Photo | Address | Area | Beds / Baths | Price | Details |
|---|---|---|---|---|---|

|
#11
Harcourt Ave
Seaside, CA 93955
|
1,692 sq. feet
|
1 baths 2 beds |
show details | |

|
#12
Flores St
Seaside, CA 93955
|
852 sq. feet
|
1 baths 2 beds |
show details | |

|
#13
Shafer St
Seaside, CA 93955
|
994 sq. feet
|
1 baths 3 beds |
show details | |

|
#14
Napa St
Seaside, CA 93955
|
1,030 sq. feet
|
1 baths 3 beds |
show details | |

|
#15
Saint Helena St
Seaside, CA 93955
|
1,102 sq. feet
|
2 baths 3 beds |
show details | |

|
#16
Judson St
Seaside, CA 93955
|
1,452 sq. feet
|
2 baths 3 beds |
show details | |

|
#17
Lowell St
Seaside, CA 93955
|
1,161 sq. feet
|
1 baths 3 beds |
show details | |

|
#18
Yosemite St
Seaside, CA 93955
|
1,456 sq. feet
|
1 baths 3 beds |
show details | |

|
#19
Trinity Ave
Seaside, CA 93955
|
1,344 sq. feet
|
2 baths 4 beds |
show details | |

|
#20
Kenneth St
Seaside, CA 93955
|
1,687 sq. feet
|
2 baths 3 beds |
show details |
| Photo | Address | Area | Beds / Baths | Price | Details |
|---|---|---|---|---|---|

|
#21
Judson St
Seaside, CA 93955
|
988 sq. feet
|
2 baths 3 beds |
show details | |

|
#22
Amador Ave
Seaside, CA 93955
|
- sq. feet
|
3 baths 5 beds |
show details | |

|
#23
Santa Clara Ave
Seaside, CA 93955
|
- sq. feet
|
1 baths 2 beds |
show details | |

|
#24
La Salle Ave Apt A
Seaside, CA 93955
|
- sq. feet
|
- baths - beds |
show details | |

|
#25
Soto St
Seaside, CA 93955
|
- sq. feet
|
- baths - beds |
show details | |

|
#26
Hilby Ave Apt F
Seaside, CA 93955
|
- sq. feet
|
- baths - beds |
show details | |

|
#27
Coe Ave Spc 116
Seaside, CA 93955
|
- sq. feet
|
- baths - beds |
show details | |

|
#28
Ardennes Cir
Seaside, CA 93955
|
- sq. feet
|
- baths - beds |
show details | |

|
#29
Ardennes Cir
Seaside, CA 93955
|
- sq. feet
|
- baths - beds |
show details | |

|
#30
Saipan Rd
Seaside, CA 93955
|
- sq. feet
|
- baths - beds |
show details |
| Photo | Address | Area | Beds / Baths | Price | Details |
|---|---|---|---|---|---|

|
#31
Sonoma Ave
Seaside, CA 93955
|
- sq. feet
|
- baths - beds |
show details | |

|
#32
Coe Ave Spc 92
Seaside, CA 93955
|
- sq. feet
|
- baths - beds |
show details | |

|
#33
Coe Ave Spc 158
Seaside, CA 93955
|
- sq. feet
|
- baths - beds |
show details | |

|
#34
Cross St
Seaside, CA 93955
|
- sq. feet
|
- baths - beds |
show details | |

|
#35
Coe Ave Spc 166
Seaside, CA 93955
|
- sq. feet
|
- baths - beds |
show details | |

|
#36
Carentan Rd
Seaside, CA 93955
|
- sq. feet
|
- baths - beds |
show details | |

|
#37
Trinity Ave Apt C
Seaside, CA 93955
|
- sq. feet
|
- baths - beds |
show details | |

|
#38
Flores St Apt E
Seaside, CA 93955
|
- sq. feet
|
- baths - beds |
show details | |

|
#39
Yosemite St
Seaside, CA 93955
|
- sq. feet
|
- baths - beds |
show details | |

|
#40
Hilby Ave
Seaside, CA 93955
|
- sq. feet
|
- baths - beds |
show details |
| Photo | Address | Area | Beds / Baths | Price | Details |
|---|---|---|---|---|---|

|
#41
Fremont Blvd, Pmb 124
Seaside, CA 93955
|
25,899 sq. feet
|
- baths - beds |
show details | |

|
#42
Nijmegen Rd
Seaside, CA 93955
|
- sq. feet
|
- baths - beds |
show details | |

|
#43
Isabelle Ct
Seaside, CA 93955
|
- sq. feet
|
- baths - beds |
show details | |

|
Check over 1 million property listings on Foreclosure.com!
|
browse all offers | |||

Latest news about housing in Seaside, CA collected exclusively by city-data.com from local newspapers, TV, and radio stations

 | Rental Crisis in Monterey - Need input please (28 replies) |
| Affordable housing near Monterey, CA (3 replies) |
| Allergies:Seaside vs Salinas (2 replies) |
| Renting apartment in Monterey county (1 reply) |
| The Presidio of Monterey (job/housing advice). (5 replies) |
| Seeking advice on moving to Monterey (apartments) (10 replies) |
Median year apartment built: 1971
Household type by relationship:
Households: 31,940- Male householders: 5,619 (892 living alone), Female householders: 4,759 (1,293 living alone)
4,752 spouses (4,729 opposite-sex spouses), 1,132 unmarried partners, (1,067 opposite-sex unmarried partners), 9,454 children (8,904 natural, 168 adopted, 381 stepchildren), 648 grandchildren, 748 brothers or sisters, 680 parents, 24 foster children, 912 other relatives, 1,804 non-relatives
- In group quarters: 1,401
Size of family households: 2,397 2-persons, 1,680 3-persons, 1,872 4-persons, 730 5-persons, 336 6-persons, 252 7-or-more-persons.
Size of nonfamily households: 2,193 1-person, 818 2-persons, 208 3-persons, 49 4-persons, 12 5-persons.
3,913 married couples with children.
2,386 single-parent households (796 men, 1,590 women).
52.3% of residents of Seaside speak English at home.
33.8% of residents speak Spanish at home (50% speak English very well, 22% speak English well, 19% speak English not well, 9% don't speak English at all).
3.8% of residents speak other Indo-European language at home (76% speak English very well, 19% speak English well, 4% speak English not well).
9.8% of residents speak Asian or Pacific Island language at home (59% speak English very well, 20% speak English well, 17% speak English not well, 4% don't speak English at all).
0.2% of residents speak other language at home (85% speak English very well, 15% speak English well).
Foreign born population: 8,584 (26.9%)
(36.7% of them are naturalized citizens)
| Here: | 5.4 |
| State: | 6.0 |
| Here: | 4.6 |
| State: | 3.9 |
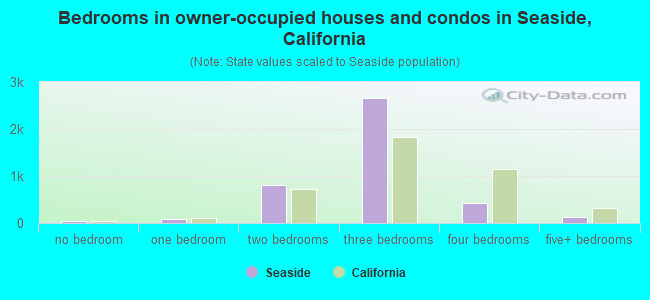
- Bedrooms in owner-occupied houses and condos in Seaside, California
- 50no bedroom
- 811 bedroom
- 8102 bedrooms
- 2,6543 bedrooms
- 4204 bedrooms
- 1245+ bedrooms
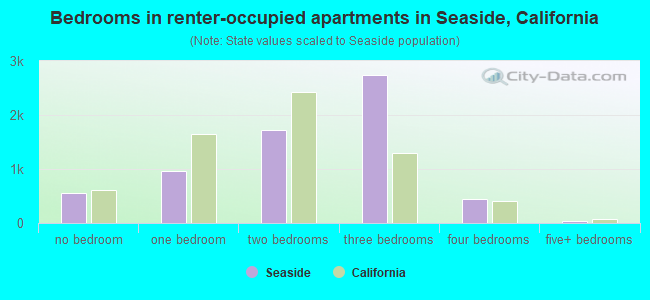
- Bedrooms in renter-occupied apartments in Seaside, California
- 555no bedroom
- 9651 bedroom
- 1,7242 bedrooms
- 2,7333 bedrooms
- 4524 bedrooms
- 415+ bedrooms
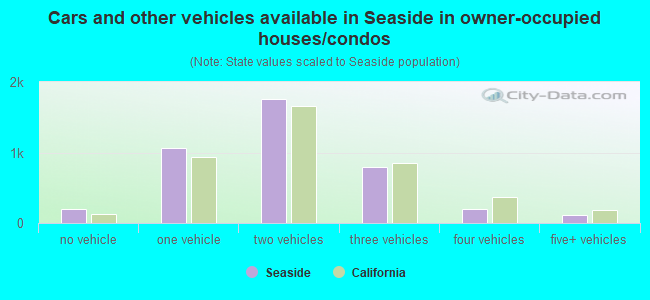
- Cars and other vehicles available in Seaside in owner-occupied houses/condos
- 199no vehicle
- 1,0701 vehicle
- 1,7622 vehicles
- 8003 vehicles
- 2004 vehicles
- 1075+ vehicles
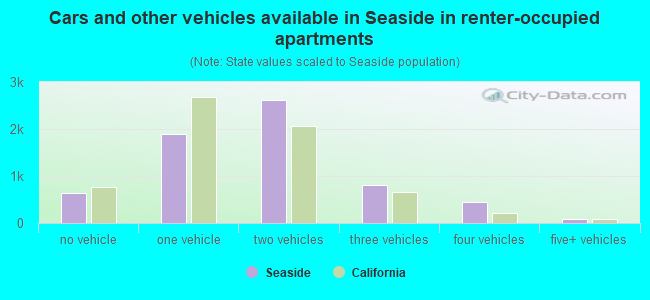
- Cars and other vehicles available in Seaside in renter-occupied apartments
- 633no vehicle
- 1,8871 vehicle
- 2,6212 vehicles
- 8063 vehicles
- 4474 vehicles
- 765+ vehicles
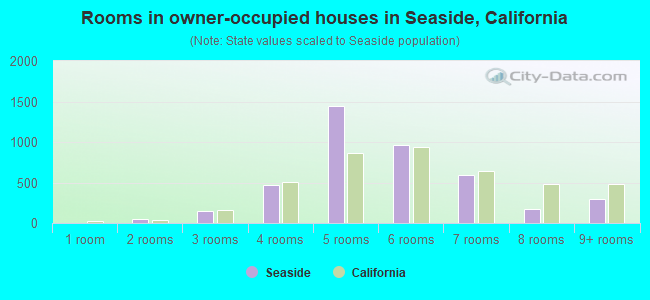
- Rooms in owner-occupied houses in Seaside, California
- 41 room
- 452 rooms
- 1523 rooms
- 4654 rooms
- 1,4485 rooms
- 9646 rooms
- 5917 rooms
- 1718 rooms
- 2979+ rooms
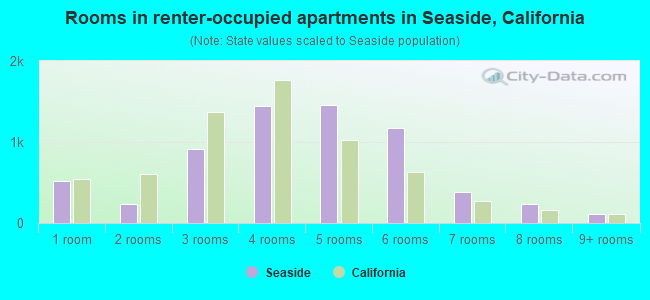
- Rooms in renter-occupied apartments in Seaside, California
- 5221 room
- 2352 rooms
- 9143 rooms
- 1,4454 rooms
- 1,4545 rooms
- 1,1746 rooms
- 3807 rooms
- 2328 rooms
- 1169+ rooms
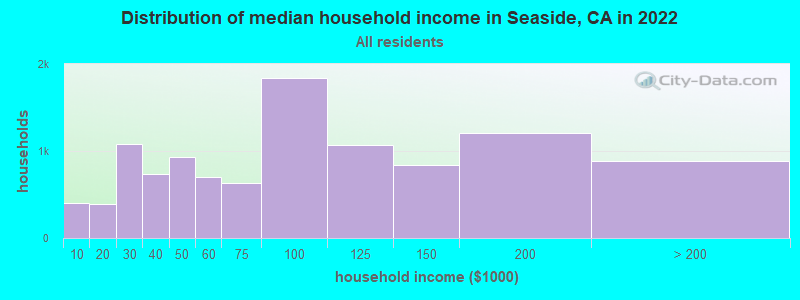
Seaside, CA household income distribution

- 406Less than $10,000
- 387$10,000 to $19,999
- 1,081$20,000 to $29,999
- 741$30,000 to $39,999
- 929$40,000 to $49,999
- 699$50,000 to $59,999
- 631$60,000 to $74,999
- 1,834$75,000 to $99,999
- 1,068$100,000 to $124,999
- 843$125,000 to $149,999
- 1,207$150,000 to $199,999
- 888$200,000 or more
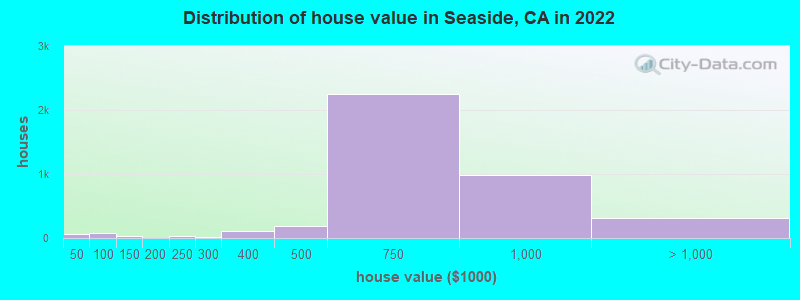
Home value of owner - occupied houses in 2022 in Seaside, CA
-
- 28Less than $10,000
- 25$15,000 to $19,999
- 5$20,000 to $24,999
- 10$50,000 to $59,999
- 53$60,000 to $69,999
- 19$70,000 to $79,999
- 3$100,000 to $124,999
- 21$125,000 to $149,999
- 3$175,000 to $199,999
- 30$200,000 to $249,999
- 22$250,000 to $299,999
- 111$300,000 to $399,999
- 192$400,000 to $499,999
- 2,254$500,000 to $749,999
- 990$750,000 to $999,999
- 221$1,000,000 to $1,499,999
- 88$2,000,000 or more
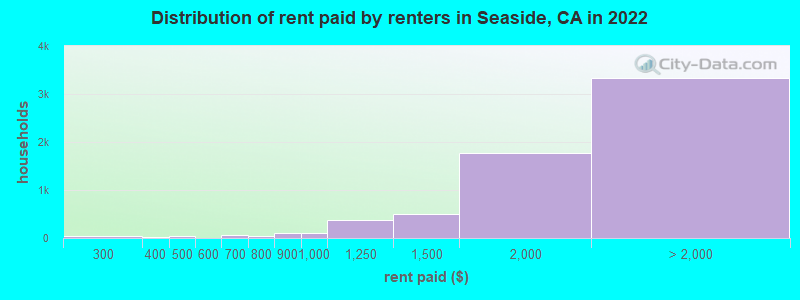
Rent paid by renters in 2022 in Seaside, CA
-
- 15$150 to $199
- 8$200 to $249
- 32$250 to $299
- 28$350 to $399
- 34$400 to $449
- 9$500 to $549
- 61$600 to $649
- 9$650 to $699
- 45$750 to $799
- 108$800 to $899
- 110$900 to $999
- 379$1,000 to $1,249
- 498$1,250 to $1,499
- 1,761$1,500 to $1,999
- 1,452$2,000 to $2,499
- 790$2,500 to $2,999
- 177$3,000 to $3,499
- 646$3,500 or more
- 271No cash rent
Percentage of workers working in this county: 96.5%
Number of people working at home: 1,623 (11.0% of all workers)
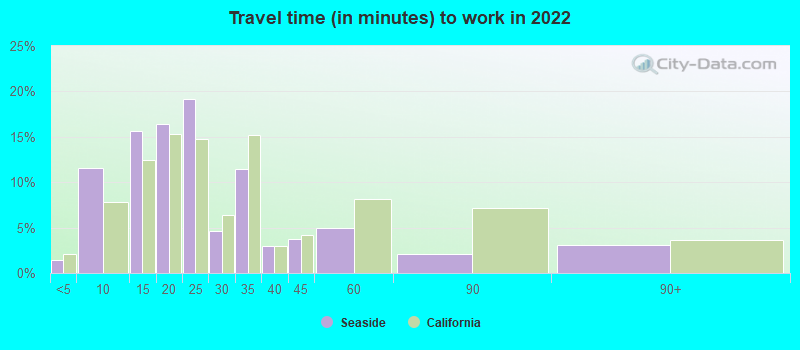
Travel time to work (commute)
- Less than 5 minutes: 137
- 5 to 9 minutes: 1,006
- 10 to 14 minutes: 1,783
- 15 to 19 minutes: 2,881
- 20 to 24 minutes: 3,480
- 25 to 29 minutes: 648
- 30 to 34 minutes: 1,172
- 35 to 39 minutes: 288
- 40 to 44 minutes: 313
- 45 to 59 minutes: 350
- 60 to 89 minutes: 561
- 90 or more minutes: 156
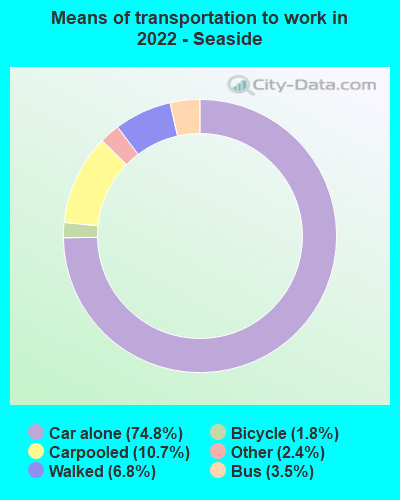
Means of transportation to work:
- Drove a car alone: 3,693 (59.0%)
- Carpooled: 476 (7.6%)
- Bus: 310 (5.0%)
- Taxi: 90 (1.4%)
- Bicycle: 123 (2.0%)
- Walked: 412 (6.6%)
- Worked at home: 1,623 (25.9%)
- Unemployment by race in 2022
- Unemployment rate for White non-Hispanic residents
- 5.5%Males
- 3.7%Females
- Unemployment rate for Black residents
- 4.5%Males
- 21.7%Females
- Unemployment rate for Asian residents
- 5.8%Males
- 2.0%Females
- Unemployment rate for other race residents
- 2.0%Males
- 18.2%Females
- Unemployment rate for two or more race residents
- 5.3%Males
- 7.7%Females
- Unemployment rate for Hispanic or Latino residents
- 2.7%Males
- 12.3%Females
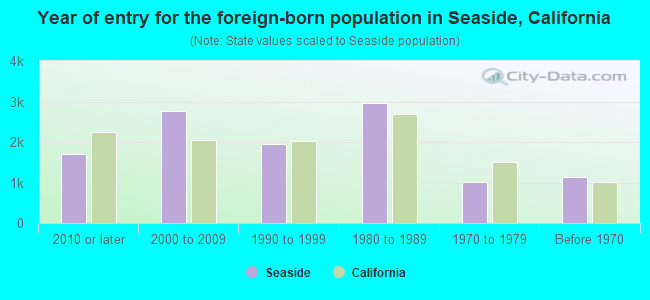
- Year of entry for the foreign-born population in Seaside, California
- 1,7152010 or later
- 2,7622000 to 2009
- 1,9441990 to 1999
- 2,9551980 to 1989
- 1,0141970 to 1979
- 1,133Before 1970
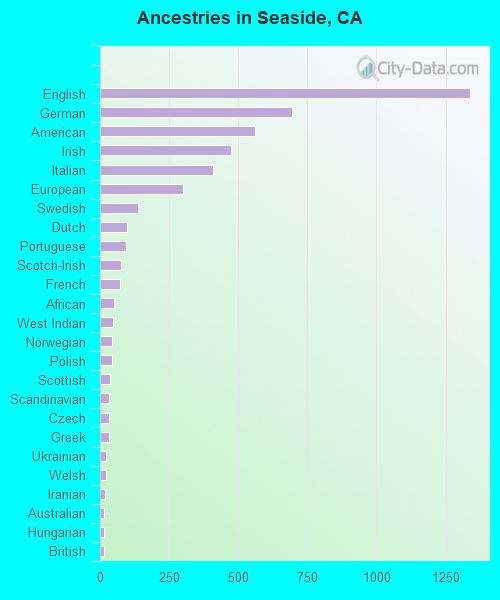
First ancestries reported:
- English: 1,340 (7.3%)
- German: 695 (3.8%)
- American: 559 (3.1%)
- Irish: 474 (2.6%)
- Italian: 408 (2.2%)
- European: 301 (1.6%)
- Swedish: 136 (0.7%)
- Dutch: 97 (0.5%)
- Portuguese: 93 (0.5%)
- Scotch-Irish: 75 (0.4%)
- French: 71 (0.4%)
- African: 49 (0.3%)
- West Indian: 46 (0.3%)
- Norwegian: 45 (0.2%)
- Polish: 43 (0.2%)
- Scottish: 37 (0.2%)
- Scandinavian: 33 (0.2%)
- Czech: 32 (0.2%)
- Greek: 31 (0.2%)
- Ukrainian: 23 (0.1%)
- Welsh: 20 (0.1%)
- Iranian: 19 (0.1%)
- Australian: 15 (0.08%)
- Hungarian: 14 (0.08%)
- British: 13 (0.07%)
- Danish: 11 (0.06%)
- Swiss: 11 (0.06%)
- Macedonian: 10 (0.05%)
- Egyptian: 7 (0.04%)
- Celtic: 7 (0.04%)
- Eastern European: 7 (0.04%)
- Basque: 6 (0.03%)
- Brazilian: 6 (0.03%)
- French Canadian: 6 (0.03%)
- Croatian: 6 (0.03%)
- Russian: 3 (0.02%)
- Slovak: 2 (0.01%)
Most common places of birth for foreign-born residents (%):
| Seaside: | 48.0% (4,048) |
| California: | 37.2% (3,881,193) |
| Seaside: | 13.2% (1,117) |
| California: | 7.8% (818,297) |
| Seaside: | 10.4% (876) |
| California: | 4.2% (440,287) |
| Seaside: | 2.5% (214) |
| California: | 6.6% (684,672) |
| Seaside: | 2.3% (195) |
| California: | 0.7% (73,304) |
| Seaside: | 1.9% (163) |
| California: | 0.3% (33,937) |
| Seaside: | 1.9% (161) |
| California: | 0.6% (65,335) |
| Seaside: | 1.9% (160) |
| California: | 2.8% (290,436) |
Place of birth for U.S.-born residents:
- This state: 14,880
- Other state: 7,389
- Northeast: 1,153
- Midwest: 1,350
- South: 3,202
- West: 1,770
80.4% of Seaside residents lived in the same house 1 years ago.
Out of people who lived in different houses, 30.6% lived in this county.
Out of people who lived in different counties, 47.2% lived in California.
| Seaside: | 80.4% |
| State average: | 88.9% |
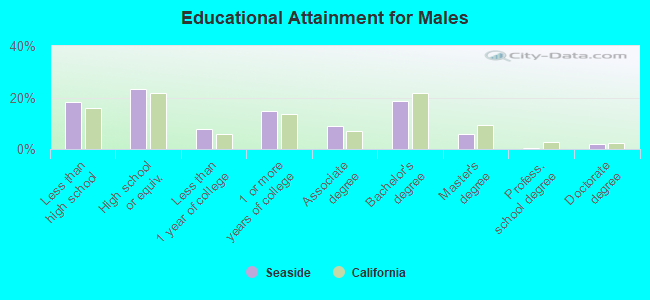
Education attainment for males 25 years and older:
- No schooling: 278
- Nursery to 4th grade: 229
- 5th and 6th grade: 419
- 7th and 8th grade: 139
- 9th grade: 290
- 10th grade: 57
- 11th grade: 149
- 12th grade, no diploma: 323
- High school graduate (or equivalency): 2,411
- Less than 1 year of college: 782
- Some college more than 1 year, no degree: 1,538
- Associate degree: 912
- Bachelor's degree: 1,911
- Master's degree: 617
- Professional school degree: 58
- Doctorate degree: 181
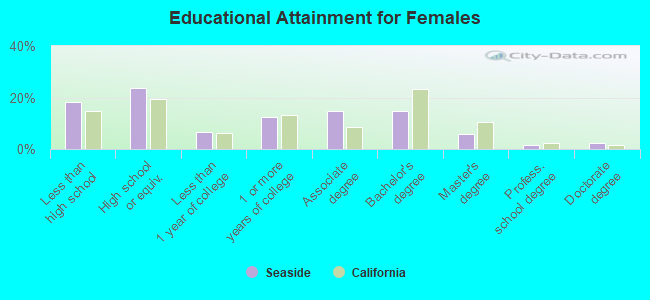
Education attainment for females 25 years and older:
- No schooling: 455
- Nursery to 4th grade: 81
- 5th and 6th grade: 496
- 7th and 8th grade: 97
- 9th grade: 234
- 10th grade: 186
- 11th grade: 112
- 12th grade, no diploma: 253
- High school graduate (or equivalency): 2,514
- Less than 1 year of college: 678
- Some college more than 1 year, no degree: 1,320
- Associate degree: 1,554
- Bachelor's degree: 1,559
- Master's degree: 618
- Professional school degree: 156
- Doctorate degree: 252
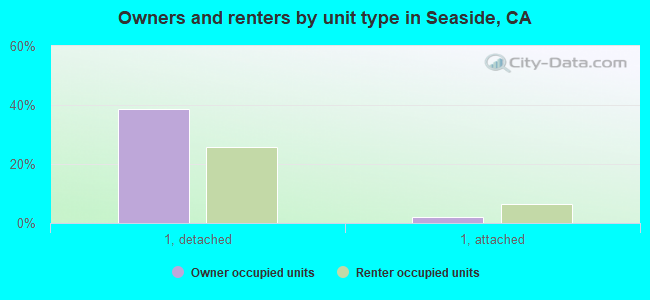
Housing units in structures:
- One, detached: 6,664
- One, attached: 1,295
- Two: 769
- 3 or 4: 478
- 5 to 9: 740
- 10 to 19: 579
- 20 to 49: 191
- 50 or more: 156
- Mobile homes: 380
Median worth of mobile homes: $178,446
Housing units lacking complete kitchen facilities in 2022: 1.1%
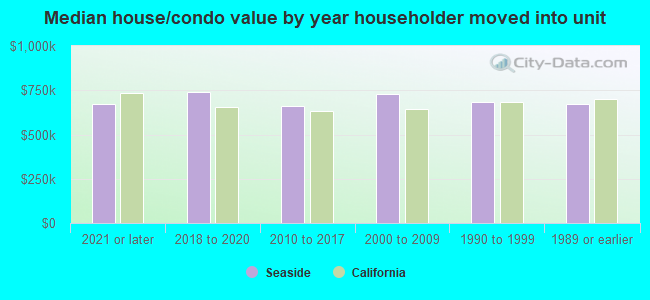
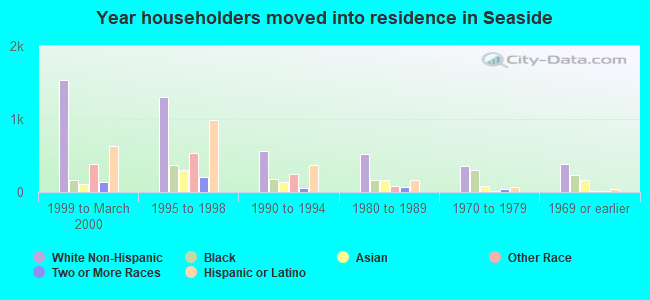
House/condo owner moved in on average 17 years ago
Renter moved in on average 3 years ago
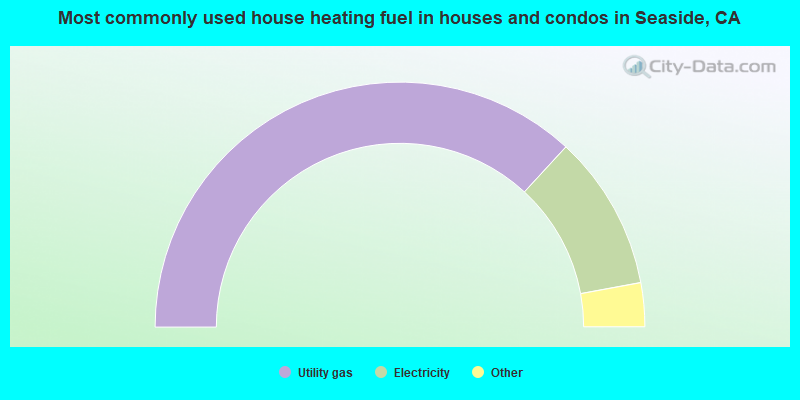
- 73.7%Utility gas
- 20.5%Electricity
- 2.3%Bottled, tank, or LP gas
- 1.4%Wood
- 1.1%Solar energy
- 1.0%No fuel used
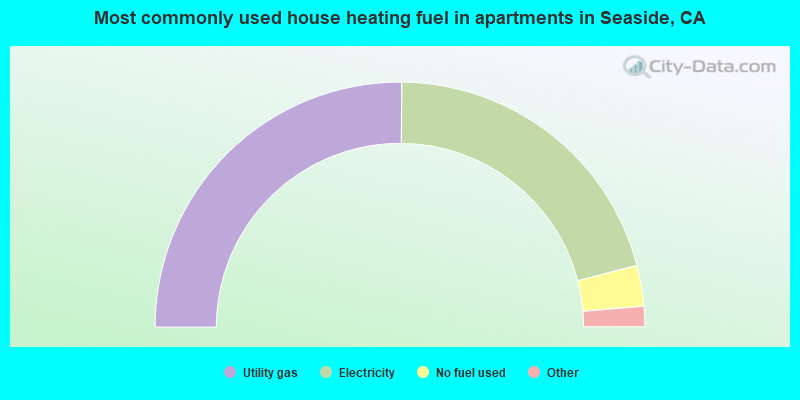
- 50.3%Utility gas
- 41.7%Electricity
- 5.4%No fuel used
- 1.5%Bottled, tank, or LP gas
- 0.9%Solar energy
- 0.3%Wood
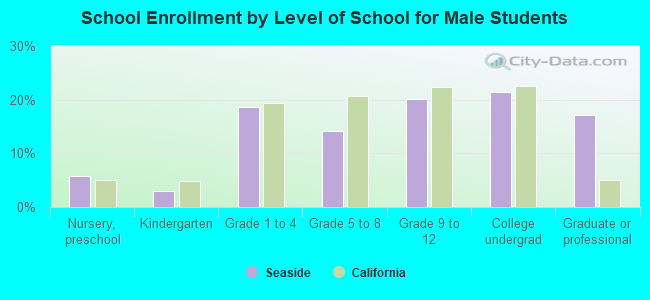
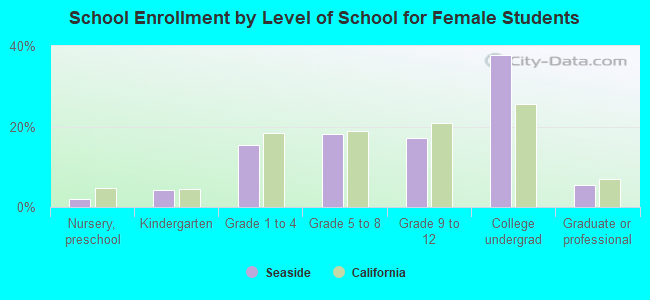
Private vs. public school enrollment:
| Here: | 11.1% |
| California: | 10.5% |
| Here: | 13.2% |
| California: | 8.5% |
| Here: | 21.9% |
| California: | 15.9% |