Severn, MD (Maryland) Houses and Residents
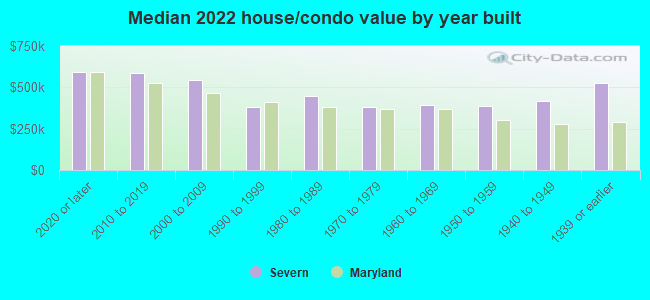
Estimated median house or condo value in 2022: $461,573 (it was $155,800 in 2000 )
Severn:
$461,573Maryland:
$398,100
Lower value quartile - upper value quartile: $364,190 - $593,017Mean price in 2022: Detached houses: $498,070 Here:
$498,070State:
$526,819
Townhouses or other attached units: $418,499 Here:
$418,499State:
$328,305
In 3-to-4-unit structures: $265,347 Here:
$265,347State:
$295,378
In 5-or-more-unit structures: $303,115 Here:
$303,115State:
$350,378
Mobile homes: $63,934 Here:
$63,934State:
$89,353
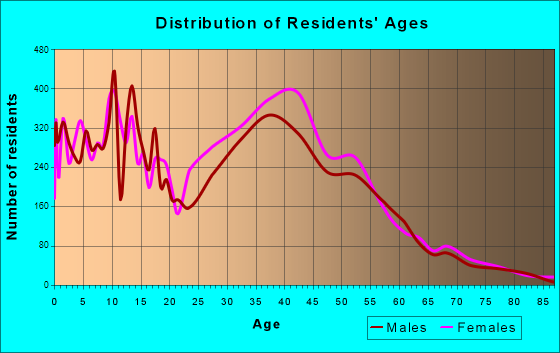
Total population: 44,231 (Urban population: 35,179, Rural population: 0)
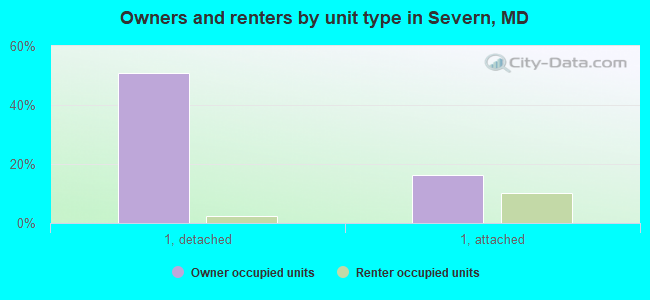
Houses: 21,863 (21,031 occupied: 15,468 owner occupied, 5,696 renter occupied )
% of renters here:
27%State:
32%
Housing density: 1,565 houses/condos per square mile
Median price asked for vacant for-sale houses and condos in 2022: $287,316.
Median contract rent in 2022: $1,806 (lower quartile is $1,398, upper quartile is over $2,000)
Median rent asked for vacant for-rent units in 2022: $2,367
Median gross rent in Severn, MD in 2022: $1,918
Housing units in Severn with a mortgage: 11,896 (1,073 second mortgage, 0 home equity loan, 926 both second mortgage and home equity loan )Houses without a mortgage: 142
Median household income for houses/condos with a mortgage: $152,838
Median household income for apartments without a mortgage: $107,147
Median monthly housing costs: $2,010
Data:
Median house or condo value ($)
Median house or condo value ($ change since 2000)
Median house or condo value ($) - White
Median house or condo value ($) - Black or African American
Median house or condo value ($) - Asian
Median house or condo value ($) - Hispanic or Latino
Median house or condo value ($) - American Indian and Alaska Native
Median house or condo value ($) - Multirace
Median house or condo value ($) - Other Race
Median price asked for mobile homes ($)
Household density (households per square mile)
Mean house or condo value by units in structure - 1, detached ($)
Mean house or condo value by units in structure - 1, attached ($)
Mean house or condo value by units in structure - 2 ($)
Mean house or condo value by units in structure by units in structure - 3 or 4 ($)
Mean house or condo value by units in structure - 5 or more ($)
Mean house or condo value by units in structure - Boat, RV, van, etc. ($)
Mean house or condo value by units in structure - Mobile home ($)
Median contract rent ($)
Median contract rent - Lower quartile ($)
Median contract rent - Upper quartile ($)
Median gross rent ($)
Urban houses (%)
Rural houses (%)
Houses occupied (%)
Houses occupied (% change since 2000)
Houses owner occupied (%)
Houses owner occupied (% change since 2000)
Houses renter occupied (%)
Houses renter occupied (% change since 2000)
Vacant housing units - For rent (%)
Vacant housing units - For rent (% change since 2000)
Vacant housing units - For sale only (%)
Vacant housing units - For sale only (% change since 2000)
Vacant housing units - Rented or sold, not occupied (%)
Vacant housing units - Rented or sold, not occupied (% change since 2000)
Vacant housing units - For seasonal, recreational, or occasional use (%)
Vacant housing units - For seasonal, recreational, or occasional use (% change since 2000)
Vacant housing units - For migrant workers (%)
Vacant housing units - For migrant workers (% change since 2000)
Vacant housing units - Other vacant (%)
Vacant housing units - Other vacant (% change since 2000)
Median monthly housing costs ($)
Median household income for houses/condos with a mortgage ($)
Median household income for houses/condos without a mortgage ($)
Median household income ($)
Median household income ($) - White
Median household income ($) - Black or African American
Median household income ($) - Asian
Median household income ($) - Hispanic or Latino
Median household income ($) - American Indian and Alaska Native
Median household income ($) - Multirace
Median household income ($) - Other Race
Mortgage status - with mortgage (%)
Mortgage status - with second mortgage (%)
Mortgage status - with home equity loan (%)
Mortgage status - with both second mortgage and home equity loan (%)
Mortgage status - without a mortgage (%)
Median year house/condo built
Median year apartment built
Household type by relationship - Male householder living alone (%)
Household type by relationship - Male householder not living alone (%)
Household type by relationship - Female householder living alone (%)
Household type by relationship - Female householder not living alone (%)
Household type by relationship - Opposite-Sex spouse (%)
Household type by relationship - Same-Sex spouse (%)
Household type by relationship - Opposite-Sex unmarried partner (%)
Household type by relationship - Same-Sex unmarried partner (%)
Household type by relationship - In group quarters (%)
Size of family households - 2-person household (%)
Size of family households - 3-person household (%)
Size of family households - 4-person household (%)
Size of family households - 5-person household (%)
Size of family households - 6-person household (%)
Size of family households - 7-or-more-person household (%)
Size of nonfamily households - 1-person household (%)
Size of nonfamily households - 2-person household (%)
Size of nonfamily households - 3-person household (%)
Size of nonfamily households - 4-person household (%)
Size of nonfamily households - 5-person household (%)
Size of nonfamily households - 6-person household (%)
Size of nonfamily households - 7-or-moreperson household (%)
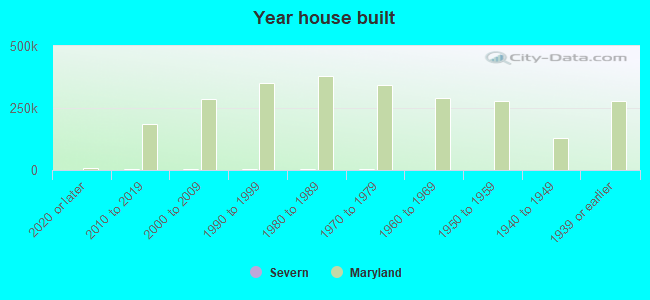
Year house built - Built 2010 or later (%)
Year house built - Built 2000 to 2009 (%)
Year house built - Built 1990 to 1999 (%)
Year house built - Built 1980 to 1989 (%)
Year house built - Built 1970 to 1979 (%)
Year house built - Built 1960 to 1969 (%)
Year house built - Built 1950 to 1959 (%)
Year house built - Built 1940 to 1949 (%)
Year house built - Built 1939 or earlier (%)
Median number of rooms in houses and condos
Median number of rooms in apartments
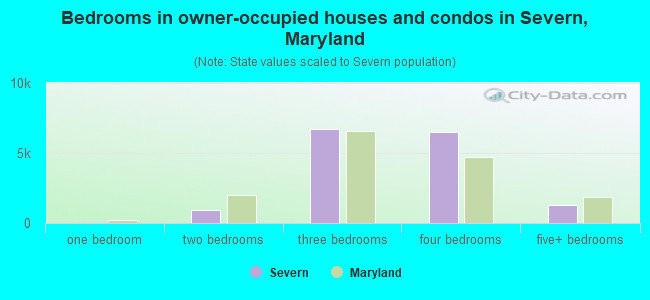
Median number of bedrooms in owner occupied houses
Mean number of bedrooms in owner occupied houses
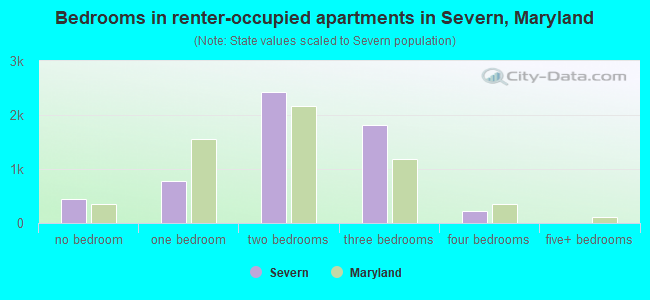
Median number of bedrooms in renter occupied houses
Mean number of bedrooms in renter occupied houses
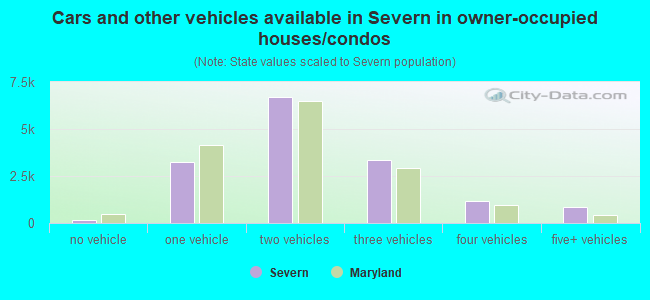
Median number of vehichles in owner occupied houses
Mean number of vehichles in owner occupied houses
Median number of vehichles in renter occupied houses
Mean number of vehichles in renter occupied houses
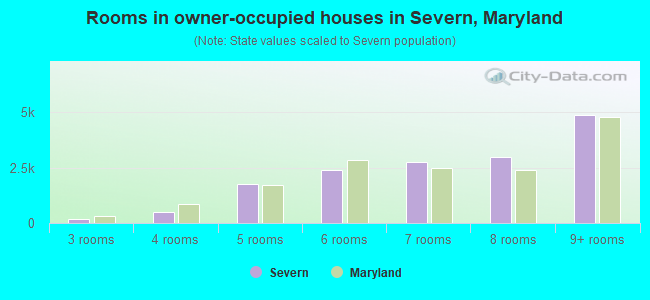
Rooms in owner-occupied houses - 1 room (%)
Rooms in owner-occupied houses - 2 rooms (%)
Rooms in owner-occupied houses - 3 rooms (%)
Rooms in owner-occupied houses - 4 rooms (%)
Rooms in owner-occupied houses - 5 rooms (%)
Rooms in owner-occupied houses - 6 rooms (%)
Rooms in owner-occupied houses - 7 rooms (%)
Rooms in owner-occupied houses - 8 rooms (%)
Rooms in owner-occupied houses - 9+ rooms (%)
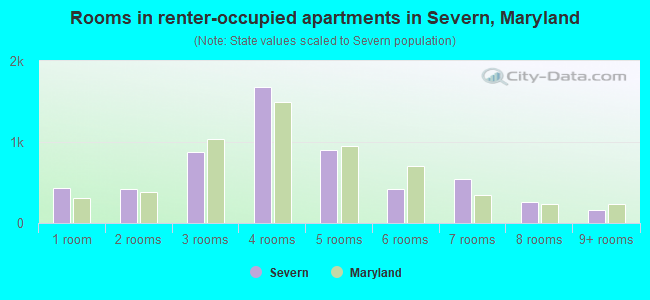
Rooms in renter-occupied houses - 1 room (%)
Rooms in renter-occupied houses - 2 rooms (%)
Rooms in renter-occupied houses - 3 rooms (%)
Rooms in renter-occupied houses - 4 rooms (%)
Rooms in renter-occupied houses - 5 rooms (%)
Rooms in renter-occupied houses - 6 rooms (%)
Rooms in renter-occupied houses - 7 rooms (%)
Rooms in renter-occupied houses - 8 rooms (%)
Rooms in renter-occupied houses - 9+ rooms (%)
Bedrooms in owner-occupied houses - no bedrooms (%)
Bedrooms in owner-occupied houses - 1 bedroom (%)
Bedrooms in owner-occupied houses - 2 bedrooms (%)
Bedrooms in owner-occupied houses - 3 bedrooms (%)
Bedrooms in owner-occupied houses - 4 bedrooms (%)
Bedrooms in owner-occupied houses - 5+ bedrooms (%)
Bedrooms in renter-occupied houses - no bedrooms (%)
Bedrooms in renter-occupied houses - 1 bedroom (%)
Bedrooms in renter-occupied houses - 2 bedrooms (%)
Bedrooms in renter-occupied houses - 3 bedrooms (%)
Bedrooms in renter-occupied houses - 4 bedrooms (%)
Bedrooms in renter-occupied houses - 5+ bedrooms (%)
Vehicles available in owner-occupied houses - no vehicle available (%)
Vehicles available in owner-occupied houses - 1 vehicle available(%)
Vehicles available in owner-occupied houses - 2 Vehicles available (%)
Vehicles available in owner-occupied houses - 3 Vehicles available (%)
Vehicles available in owner-occupied houses - 4 Vehicles available (%)
Vehicles available in owner-occupied houses - 5+ Vehicles available (%)
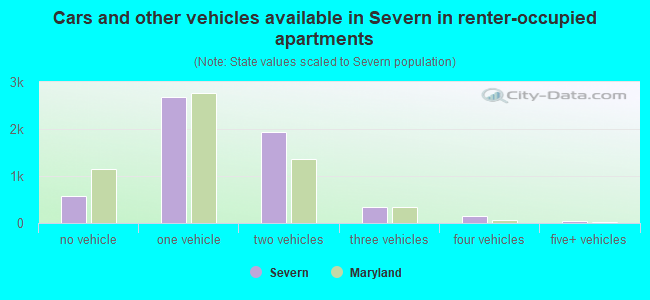
Vehicles available in renter-occupied houses - no vehicle available (%)
Vehicles available in renter-occupied houses - 1 vehicle available (%)
Vehicles available in renter-occupied houses - 2 Vehicles available (%)
Vehicles available in renter-occupied houses - 3 Vehicles available (%)
Vehicles available in renter-occupied houses - 4 Vehicles available (%)
Vehicles available in renter-occupied houses - 5+ Vehicles available (%)
Housing units in structures - 1, detached (%)
Housing units in structures - 1, attached (%)
Housing units in structures - 2 (%)
Housing units in structures - 3 or 4 (%)
Housing units in structures - 5 to 9 (%)
Housing units in structures - 10 to 19 (%)
Housing units in structures - 20 to 49 (%)
Housing units in structures - 50 or more (%)
Housing units in structures - Mobile home (%)
Housing units in structures - Boat, RV, van, etc. (%)
Housing units in structures - Owners - 1, detached (%)
Housing units in structures - Owners - 1, attached (%)
Housing units in structures - Owners - 2 (%)
Housing units in structures - Owners - 3 or 4 (%)
Housing units in structures - Owners - 5 to 9 (%)
Housing units in structures - Owners - 10 to 19 (%)
Housing units in structures - Owners - 20 to 49 (%)
Housing units in structures - Owners - 50 or more (%)
Housing units in structures - Owners - Mobile home (%)
Housing units in structures - Owners - Boat, RV, van, etc. (%)
Housing units in structures - Renters - 1, detached (%)
Housing units in structures - Renters - 1, attached (%)
Housing units in structures - Renters - 2 (%)
Housing units in structures - Renters - 3 or 4 (%)
Housing units in structures - Renters - 5 to 9 (%)
Housing units in structures - Renters - 10 to 19 (%)
Housing units in structures - Renters - 20 to 49 (%)
Housing units in structures - Renters - 50 or more (%)
Housing units in structures - Renters - Mobile home (%)
Housing units in structures - Renters - Boat, RV, van, etc. (%)
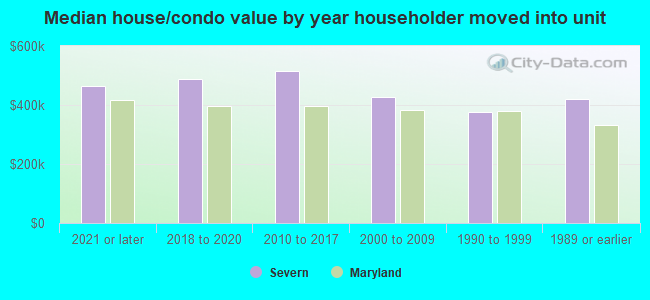
House/condo owner moved in on average (years ago)
Renter moved in on average (years ago)
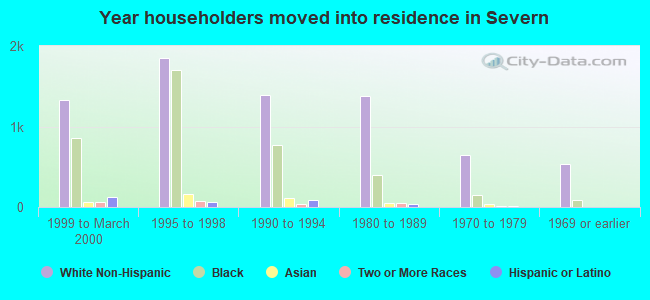
Year householder moved into unit - Moved in 1999 to March 2000 (%)
Year householder moved into unit - Moved in 1999 to March 2000 (%) - White
Year householder moved into unit - Moved in 1999 to March 2000 (%) - Black or African American
Year householder moved into unit - Moved in 1999 to March 2000 (%) - Asian
Year householder moved into unit - Moved in 1999 to March 2000 (%) - Hispanic or Latino
Year householder moved into unit - Moved in 1999 to March 2000 (%) - American Indian and Alaska Native
Year householder moved into unit - Moved in 1999 to March 2000 (%) - Multirace
Year householder moved into unit - Moved in 1999 to March 2000 (%) - Other Race
Year householder moved into unit - Moved in 1995 to 1998 (%)
Year householder moved into unit - Moved in 1995 to 1998 (%) - White
Year householder moved into unit - Moved in 1995 to 1998 (%) - Black or African American
Year householder moved into unit - Moved in 1995 to 1998 (%) - Asian
Year householder moved into unit - Moved in 1995 to 1998 (%) - Hispanic or Latino
Year householder moved into unit - Moved in 1995 to 1998 (%) - American Indian and Alaska Native
Year householder moved into unit - Moved in 1995 to 1998 (%) - Multirace
Year householder moved into unit - Moved in 1995 to 1998 (%) - Other Race
Year householder moved into unit - Moved in 1990 to 1994 (%)
Year householder moved into unit - Moved in 1990 to 1994 (%) - White
Year householder moved into unit - Moved in 1990 to 1994 (%) - Black or African American
Year householder moved into unit - Moved in 1990 to 1994 (%) - Asian
Year householder moved into unit - Moved in 1990 to 1994 (%) - Hispanic or Latino
Year householder moved into unit - Moved in 1990 to 1994 (%) - American Indian and Alaska Native
Year householder moved into unit - Moved in 1990 to 1994 (%) - Multirace
Year householder moved into unit - Moved in 1990 to 1994 (%) - Other Race
Year householder moved into unit - Moved in 1980 to 1989 (%)
Year householder moved into unit - Moved in 1980 to 1989 (%) - White
Year householder moved into unit - Moved in 1980 to 1989 (%) - Black or African American
Year householder moved into unit - Moved in 1980 to 1989 (%) - Asian
Year householder moved into unit - Moved in 1980 to 1989 (%) - Hispanic or Latino
Year householder moved into unit - Moved in 1980 to 1989 (%) - American Indian and Alaska Native
Year householder moved into unit - Moved in 1980 to 1989 (%) - Multirace
Year householder moved into unit - Moved in 1980 to 1989 (%) - Other Race
Year householder moved into unit - Moved in 1970 to 1979 (%)
Year householder moved into unit - Moved in 1970 to 1979 (%) - White
Year householder moved into unit - Moved in 1970 to 1979 (%) - Black or African American
Year householder moved into unit - Moved in 1970 to 1979 (%) - Asian
Year householder moved into unit - Moved in 1970 to 1979 (%) - Hispanic or Latino
Year householder moved into unit - Moved in 1970 to 1979 (%) - American Indian and Alaska Native
Year householder moved into unit - Moved in 1970 to 1979 (%) - Multirace
Year householder moved into unit - Moved in 1970 to 1979 (%) - Other Race
Year householder moved into unit - Moved in 1969 or earlier (%)
Year householder moved into unit - Moved in 1969 or earlier (%) - White
Year householder moved into unit - Moved in 1969 or earlier (%) - Black or African American
Year householder moved into unit - Moved in 1969 or earlier (%) - Asian
Year householder moved into unit - Moved in 1969 or earlier (%) - Hispanic or Latino
Year householder moved into unit - Moved in 1969 or earlier (%) - American Indian and Alaska Native
Year householder moved into unit - Moved in 1969 or earlier (%) - Multirace
Year householder moved into unit - Moved in 1969 or earlier (%) - Other Race
Housing units lacking complete plumbing facilities (%)
Housing units lacking complete kitchen facilities (%)
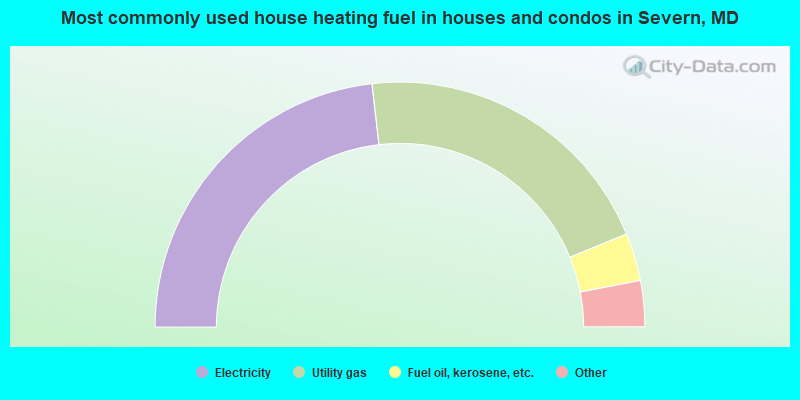
House heating fuel used in houses and condos - Utility gas (%)
House heating fuel used in houses and condos - Bottled, tank, or LP gas (%)
House heating fuel used in houses and condos - Electricity (%)
House heating fuel used in houses and condos - Fuel oil, kerosene, etc. (%)
House heating fuel used in houses and condos - Coal or coke (%)
House heating fuel used in houses and condos - Wood (%)
House heating fuel used in houses and condos - Solar energy (%)
House heating fuel used in houses and condos - Other fuel (%)
House heating fuel used in houses and condos - No fuel used (%)
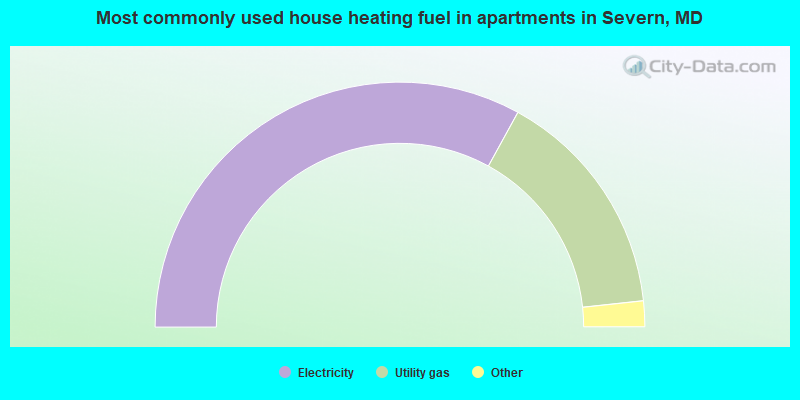
House heating fuel used in apartments - Utility gas (%)
House heating fuel used in apartments - Bottled, tank, or LP gas (%)
House heating fuel used in apartments - Electricity (%)
House heating fuel used in apartments - Fuel oil, kerosene, etc. (%)
House heating fuel used in apartments - Coal or coke (%)
House heating fuel used in apartments - Wood (%)
House heating fuel used in apartments - Solar energy (%)
House heating fuel used in apartments - Other fuel (%)
House heating fuel used in apartments - No fuel used (%)
Latest news about housing in Severn, MD collected exclusively by city-data.com from local newspapers, TV, and radio stations
Median year house/condo built: 1996Median year apartment built: 2001Household type by relationship:
Households: 56,934
Male householders: 10,691 (2,155 living alone ), Female householders: 10,227 (2,222 living alone )11,284 spouses (11,112 opposite-sex spouses ), 1,008 unmarried partners , (951 opposite-sex unmarried partners ), 17,642 children (16,625 natural , 303 adopted , 714 stepchildren ), 1,672 grandchildren , 524 brothers or sisters , 1,139 parents , 0 foster children , 980 other relatives , 1,622 non-relatives In group quarters: 140
Size of family households: 6,274 2-persons , 3,318 3-persons , 3,180 4-persons , 1,695 5-persons , 440 6-persons , 197 7-or-more-persons .
Size of nonfamily households: 4,587 1-person , 1,037 2-persons , 284 3-persons , 29 4-persons , 10 5-persons .
8,231 married couples with children. single-parent households (427 men , 2,687 women ).
79.5% of residents of Severn speak English at home. of residents speak Spanish at home (79% speak English very well , 11% speak English well , 10% speak English not well ).of residents speak other Indo-European language at home (71% speak English very well , 20% speak English well , 8% speak English not well ).of residents speak Asian or Pacific Island language at home (54% speak English very well , 31% speak English well , 12% speak English not well , 2% don't speak English at all ).of residents speak other language at home (97% speak English very well , 3% speak English well ).
Foreign born population: 8,186 (14.4%)of them are naturalized citizens )
Median number of rooms in houses and condos:
Median number of rooms in apartments
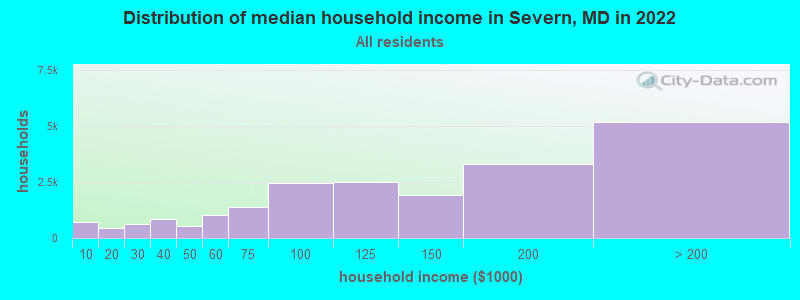
Severn, MD household income distribution 696 Less than $10,000456 $10,000 to $19,999643 $20,000 to $29,999848 $30,000 to $39,999535 $40,000 to $49,9991,032 $50,000 to $59,9991,398 $60,000 to $74,9992,454 $75,000 to $99,9992,486 $100,000 to $124,9991,919 $125,000 to $149,9993,291 $150,000 to $199,9995,169 $200,000 or more
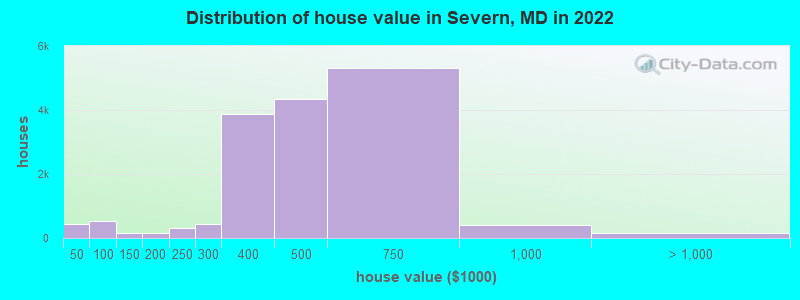
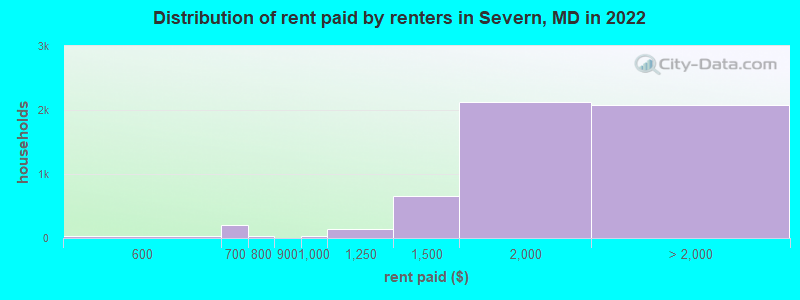
Home value of owner - occupied houses in 2022 in Severn, MD 179 Less than $10,00024 $15,000 to $19,99937 $20,000 to $24,99948 $30,000 to $34,99962 $35,000 to $39,99970 $40,000 to $49,999112 $50,000 to $59,99985 $60,000 to $69,999195 $70,000 to $79,99929 $80,000 to $89,99933 $90,000 to $99,999126 $100,000 to $124,99925 $125,000 to $149,99985 $150,000 to $174,99981 $175,000 to $199,999327 $200,000 to $249,999423 $250,000 to $299,9993,873 $300,000 to $399,9994,346 $400,000 to $499,9995,312 $500,000 to $749,999393 $750,000 to $999,99940 $1,000,000 to $1,499,999127 $2,000,000 or moreRent paid by renters in 2022 in Severn, MD 9 $350 to $39914 $500 to $54915 $550 to $599183 $600 to $64926 $650 to $69927 $700 to $74939 $900 to $999145 $1,000 to $1,249652 $1,250 to $1,4992,117 $1,500 to $1,9991,396 $2,000 to $2,499528 $2,500 to $2,99954 $3,000 to $3,49939 $3,500 or more53 No cash rent
Percentage of workers working in this county: 60.4%Number of people working at home: 5,248 (17.0% of all workers )
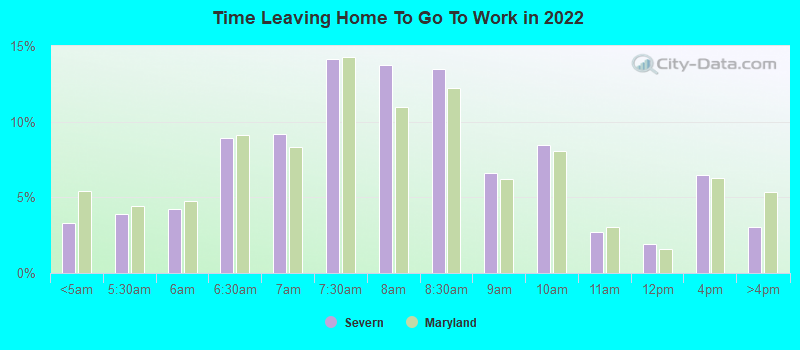
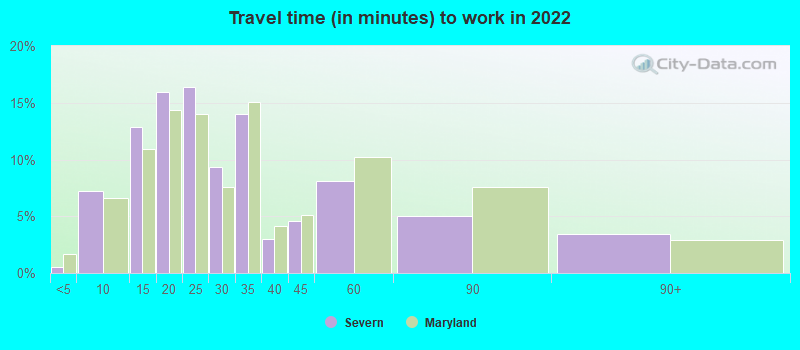
Travel time to work (commute)
Less than 5 minutes: 1685 to 9 minutes: 1,38110 to 14 minutes: 3,11515 to 19 minutes: 5,56120 to 24 minutes: 3,53225 to 29 minutes: 2,06530 to 34 minutes: 3,45035 to 39 minutes: 94340 to 44 minutes: 62745 to 59 minutes: 2,54160 to 89 minutes: 1,53690 or more minutes: 701
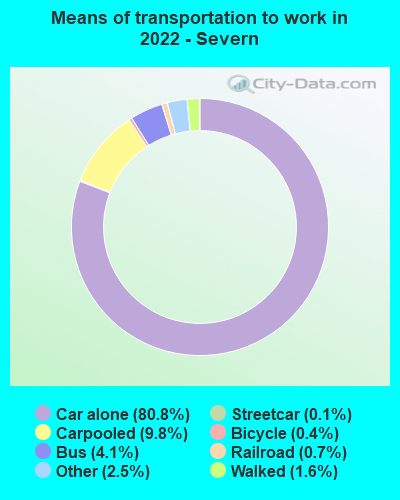
Means of transportation to work:
Drove a car alone: 8,567 (56.4%)Carpooled: 1,046 (6.9%)Bus : 244 (1.6%)Subway or elevated rail : 10 (0.1%)Light rail, streetcar or trolley : 38 (0.3%)Taxi: 318 (2.1%)Bicycle: 46 (0.3%)Walked: 174 (1.1%)Worked at home: 5,248 (34.5%)
Unemployment by race in 2022
Unemployment rate for White non-Hispanic residents 2.5% Males2.9% FemalesUnemployment rate for Black residents 4.8% Males6.3% FemalesUnemployment rate for Asian residents 0.3% Males1.1% FemalesUnemployment rate for other race residents 1.9% FemalesUnemployment rate for two or more race residents 12.5% Males5.5% FemalesUnemployment rate for Hispanic or Latino residents 0.1% Males1.2% Females
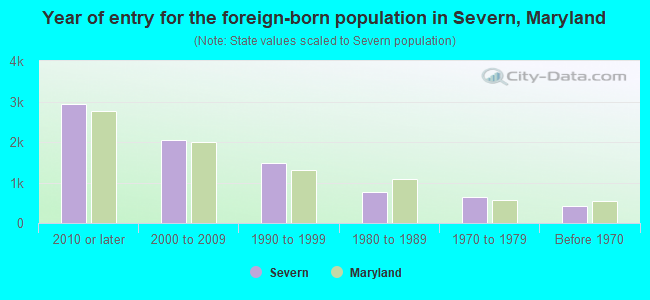
Year of entry for the foreign-born population in Severn, Maryland
2,933 2010 or later 2,054 2000 to 2009 1,480 1990 to 1999 763 1980 to 1989 651 1970 to 1979 409 Before 1970
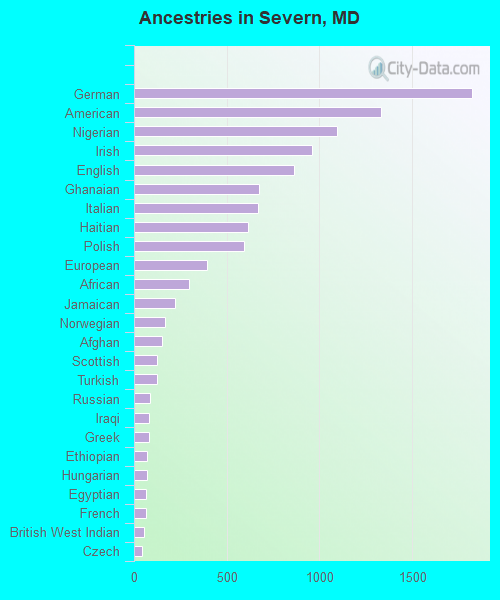
First ancestries reported:
German: 1,823 (6.4%)
American: 1,333 (4.7%)
Nigerian: 1,094 (3.9%)
Irish: 961 (3.4%)
English: 863 (3.0%)
Ghanaian: 675 (2.4%)
Italian: 670 (2.4%)
Haitian: 614 (2.2%)
Polish: 594 (2.1%)
European: 394 (1.4%)
African: 298 (1.1%)
Jamaican: 222 (0.8%)
Norwegian: 165 (0.6%)
Afghan: 149 (0.5%)
Scottish: 124 (0.4%)
Turkish: 122 (0.4%)
Russian: 87 (0.3%)
Iraqi: 83 (0.3%)
Greek: 79 (0.3%)
Ethiopian: 72 (0.3%)
Hungarian: 71 (0.3%)
Egyptian: 67 (0.2%)
French: 66 (0.2%)
British West Indian: 53 (0.2%)
Czech: 45 (0.2%)
Guyanese: 43 (0.2%)
German Russian: 42 (0.1%)
Trinidadian and Tobagonian: 42 (0.1%)
Celtic: 40 (0.1%)
Belgian: 38 (0.1%)
Slavic: 35 (0.1%)
Dutch: 34 (0.1%)
Scotch-Irish: 32 (0.1%)
Eastern European: 29 (0.1%)
Northern European: 26 (0.09%)
Cajun: 25 (0.09%)
Albanian: 23 (0.08%)
Slovak: 23 (0.08%)
Canadian: 23 (0.08%)
Cape Verdean: 22 (0.08%)
Swedish: 21 (0.07%)
Lithuanian: 18 (0.06%)
Croatian: 18 (0.06%)
Austrian: 17 (0.06%)
Ukrainian: 16 (0.06%)
British: 15 (0.05%)
Pennsylvania German: 14 (0.05%)
Portuguese: 13 (0.05%)
Sierra Leonean: 12 (0.04%)
Arab: 11 (0.04%)
Syrian: 10 (0.04%)
Slovene: 10 (0.04%)
Finnish: 9 (0.03%)
Danish: 8 (0.03%)
Armenian: 8 (0.03%)
Liberian: 8 (0.03%)
French Canadian: 5 (0.02%)
Serbian: 3 (0.01%)
Most common places of birth for foreign-born residents (%): Nigeria Severn:
13.5% (1,140)Maryland:
4.6% (44,825)
Korea Severn:
9.0% (761)Maryland:
3.4% (32,635)
India Severn:
7.8% (664)Maryland:
6.4% (61,725)
Philippines Severn:
7.7% (648)Maryland:
3.8% (36,698)
Ghana Severn:
6.2% (525)Maryland:
1.8% (17,774)
China, excluding Hong Kong and Taiwan Severn:
3.3% (280)Maryland:
4.6% (44,742)
Jamaica Severn:
3.0% (255)Maryland:
2.8% (27,444)
Panama Severn:
3.0% (251)Maryland:
0.3% (2,848)
El Salvador Severn:
2.7% (229)Maryland:
12.0% (115,412)
Pakistan Severn:
2.5% (210)Maryland:
1.8% (17,037)
Germany Severn:
2.4% (199)Maryland:
1.2% (11,265)
Honduras Severn:
2.1% (175)Maryland:
2.5% (24,026)
Trinidad and Tobago Severn:
2.1% (175)Maryland:
1.2% (11,481)
Bolivia Severn:
2.0% (167)Maryland:
0.7% (7,000)
Nepal Severn:
1.9% (159)Maryland:
1.1% (10,205)
Dominican Republic Severn:
1.7% (148)Maryland:
1.4% (13,947)
Vietnam Severn:
1.7% (144)Maryland:
1.9% (18,716)
Colombia Severn:
1.7% (142)Maryland:
1.3% (12,898)
Place of birth for U.S.-born residents:
This state: 24,935Other state: 22,230Northeast: 5,686Midwest: 2,634South: 11,478West: 2,555 86.0% of Severn residents lived in the same house 1 years ago.
Out of people who lived in different houses, 30.2% lived in this county.
Out of people who lived in different counties, 61.2% lived in Maryland.
Severn:
86.0%State average:
88.5%
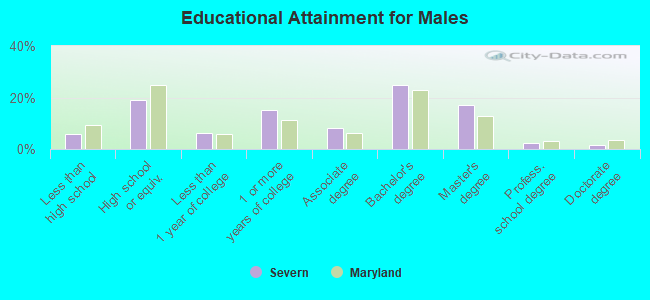
Education attainment for males 25 years and older:
No schooling: 254Nursery to 4th grade: 835th and 6th grade: 517th and 8th grade: 609th grade: 9010th grade: 17311th grade: 11812th grade, no diploma: 264High school graduate (or equivalency): 3,606Less than 1 year of college: 1,167Some college more than 1 year, no degree: 2,852Associate degree: 1,514Bachelor's degree: 4,712Master's degree: 3,204Professional school degree: 411Doctorate degree: 294
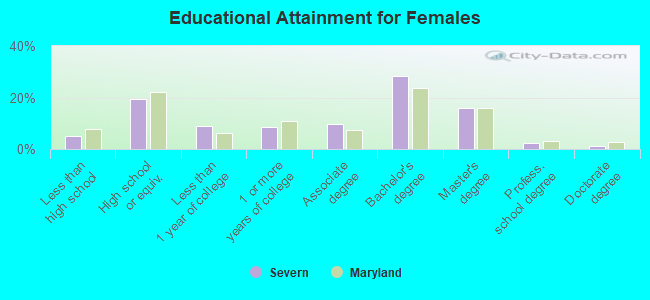
Education attainment for females 25 years and older:
No schooling: 339Nursery to 4th grade: 105th and 6th grade: 527th and 8th grade: 119th grade: 7710th grade: 9711th grade: 9412th grade, no diploma: 322High school graduate (or equivalency): 3,943Less than 1 year of college: 1,822Some college more than 1 year, no degree: 1,746Associate degree: 1,978Bachelor's degree: 5,711Master's degree: 3,185Professional school degree: 471Doctorate degree: 247
Housing units in structures:
One, detached: 11,445One, attached: 6,491Two: 873 or 4: 805 to 9: 36810 to 19: 1,02020 to 49: 16850 or more: 1,475Mobile homes: 726Median worth of mobile homes: $72,988
Housing units lacking complete plumbing facilities in 2022: 0.1%Housing units lacking complete kitchen facilities in 2022: 0.4%House/condo owner moved in on average 11 years ago
Renter moved in on average 1 years ago
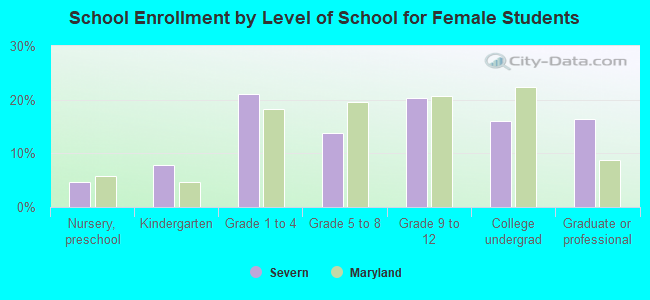
Private vs. public school enrollment:
Students in private schools in grades 1 to 8 (elementary and middle school): 1,221 Students in private schools in grades 9 to 12 (high school): 148 Students in private undergraduate colleges: 288