Severna Park, MD (Maryland) Houses and Residents
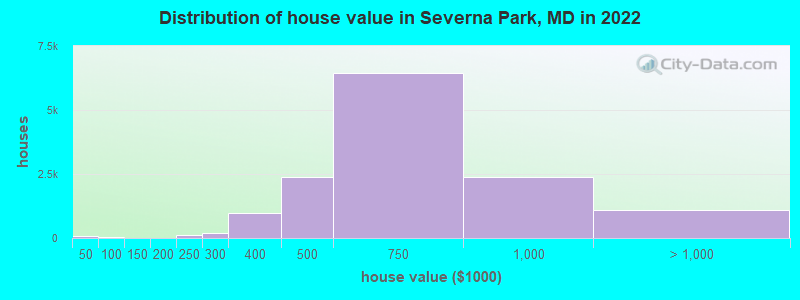
Estimated median house or condo value in 2022: $644,459 (it was $236,600 in 2000 )
Severna Park:
$644,459Maryland:
$398,100
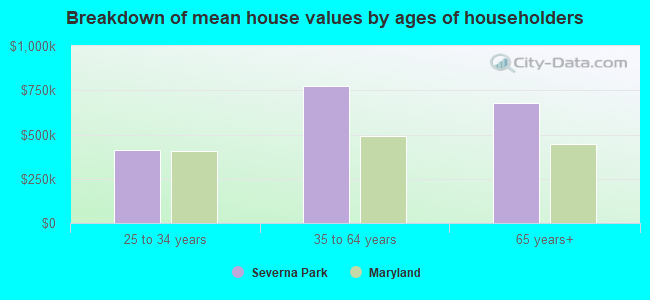
Lower value quartile - upper value quartile: $505,938 - $779,775Mean price in 2022: Detached houses: $711,941 Here:
$711,941State:
$526,819
Townhouses or other attached units: $428,569 Here:
$428,569State:
$328,305
In 2-unit structures: $403,139 Here:
$403,139State:
$346,599
In 5-or-more-unit structures: $393,613 Here:
$393,613State:
$350,378
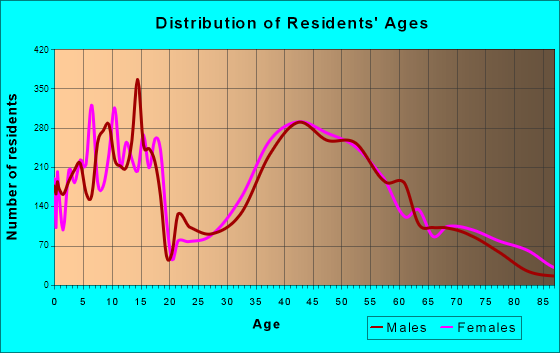
Total population: 37,634 (Urban population: 28,598, Rural population: 0)
Houses: 14,522 (13,988 occupied: 12,804 owner occupied, 1,272 renter occupied )
% of renters here:
9%State:
32%
Housing density: 1,126 houses/condos per square mile
Median price asked for vacant for-sale houses and condos in 2022: $744,082.
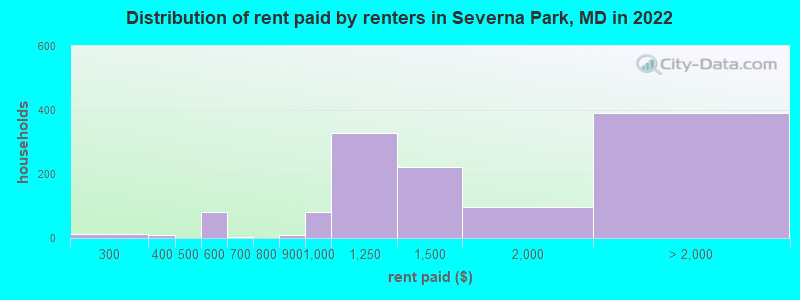
Median contract rent in 2022: $1,324 (lower quartile is $993, upper quartile is over $2,000)
Median rent asked for vacant for-rent units in 2022: $1,779
Median gross rent in Severna Park, MD in 2022: $1,456
Housing units in Severna Park with a mortgage: 9,677 (1,410 second mortgage, 33 home equity loan, 1,273 both second mortgage and home equity loan )Houses without a mortgage: 202
Median household income for houses/condos with a mortgage: $187,417
Median household income for apartments without a mortgage: $114,181
Median monthly housing costs: $2,335
Data:
Median house or condo value ($)
Median house or condo value ($ change since 2000)
Median house or condo value ($) - White
Median house or condo value ($) - Black or African American
Median house or condo value ($) - Asian
Median house or condo value ($) - Hispanic or Latino
Median house or condo value ($) - American Indian and Alaska Native
Median house or condo value ($) - Multirace
Median house or condo value ($) - Other Race
Median price asked for mobile homes ($)
Household density (households per square mile)
Mean house or condo value by units in structure - 1, detached ($)
Mean house or condo value by units in structure - 1, attached ($)
Mean house or condo value by units in structure - 2 ($)
Mean house or condo value by units in structure by units in structure - 3 or 4 ($)
Mean house or condo value by units in structure - 5 or more ($)
Mean house or condo value by units in structure - Boat, RV, van, etc. ($)
Mean house or condo value by units in structure - Mobile home ($)
Median contract rent ($)
Median contract rent - Lower quartile ($)
Median contract rent - Upper quartile ($)
Median gross rent ($)
Urban houses (%)
Rural houses (%)
Houses occupied (%)
Houses occupied (% change since 2000)
Houses owner occupied (%)
Houses owner occupied (% change since 2000)
Houses renter occupied (%)
Houses renter occupied (% change since 2000)
Vacant housing units - For rent (%)
Vacant housing units - For rent (% change since 2000)
Vacant housing units - For sale only (%)
Vacant housing units - For sale only (% change since 2000)
Vacant housing units - Rented or sold, not occupied (%)
Vacant housing units - Rented or sold, not occupied (% change since 2000)
Vacant housing units - For seasonal, recreational, or occasional use (%)
Vacant housing units - For seasonal, recreational, or occasional use (% change since 2000)
Vacant housing units - For migrant workers (%)
Vacant housing units - For migrant workers (% change since 2000)
Vacant housing units - Other vacant (%)
Vacant housing units - Other vacant (% change since 2000)
Median monthly housing costs ($)
Median household income for houses/condos with a mortgage ($)
Median household income for houses/condos without a mortgage ($)
Median household income ($)
Median household income ($) - White
Median household income ($) - Black or African American
Median household income ($) - Asian
Median household income ($) - Hispanic or Latino
Median household income ($) - American Indian and Alaska Native
Median household income ($) - Multirace
Median household income ($) - Other Race
Mortgage status - with mortgage (%)
Mortgage status - with second mortgage (%)
Mortgage status - with home equity loan (%)
Mortgage status - with both second mortgage and home equity loan (%)
Mortgage status - without a mortgage (%)
Median year house/condo built
Median year apartment built
Household type by relationship - Male householder living alone (%)
Household type by relationship - Male householder not living alone (%)
Household type by relationship - Female householder living alone (%)
Household type by relationship - Female householder not living alone (%)
Household type by relationship - Opposite-Sex spouse (%)
Household type by relationship - Same-Sex spouse (%)
Household type by relationship - Opposite-Sex unmarried partner (%)
Household type by relationship - Same-Sex unmarried partner (%)
Household type by relationship - In group quarters (%)
Size of family households - 2-person household (%)
Size of family households - 3-person household (%)
Size of family households - 4-person household (%)
Size of family households - 5-person household (%)
Size of family households - 6-person household (%)
Size of family households - 7-or-more-person household (%)
Size of nonfamily households - 1-person household (%)
Size of nonfamily households - 2-person household (%)
Size of nonfamily households - 3-person household (%)
Size of nonfamily households - 4-person household (%)
Size of nonfamily households - 5-person household (%)
Size of nonfamily households - 6-person household (%)
Size of nonfamily households - 7-or-moreperson household (%)
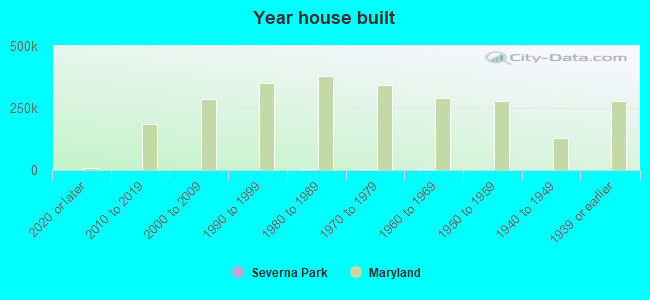
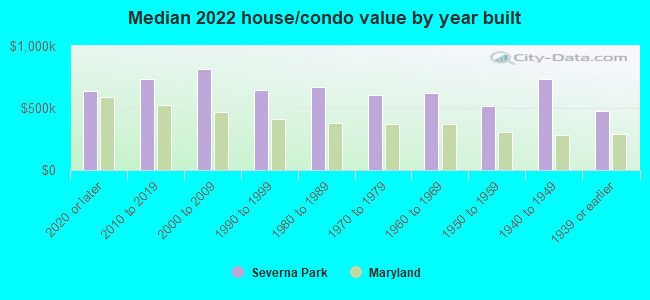
Year house built - Built 2010 or later (%)
Year house built - Built 2000 to 2009 (%)
Year house built - Built 1990 to 1999 (%)
Year house built - Built 1980 to 1989 (%)
Year house built - Built 1970 to 1979 (%)
Year house built - Built 1960 to 1969 (%)
Year house built - Built 1950 to 1959 (%)
Year house built - Built 1940 to 1949 (%)
Year house built - Built 1939 or earlier (%)
Median number of rooms in houses and condos
Median number of rooms in apartments
Median number of bedrooms in owner occupied houses
Mean number of bedrooms in owner occupied houses
Median number of bedrooms in renter occupied houses
Mean number of bedrooms in renter occupied houses
Median number of vehichles in owner occupied houses
Mean number of vehichles in owner occupied houses
Median number of vehichles in renter occupied houses
Mean number of vehichles in renter occupied houses
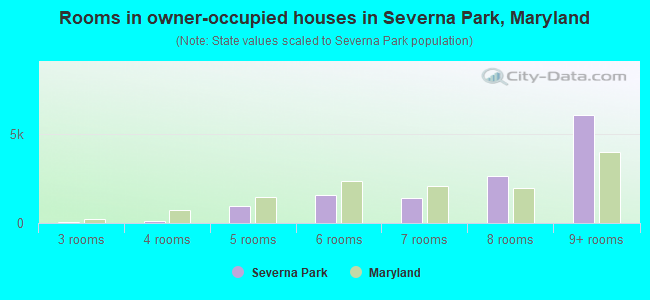
Rooms in owner-occupied houses - 1 room (%)
Rooms in owner-occupied houses - 2 rooms (%)
Rooms in owner-occupied houses - 3 rooms (%)
Rooms in owner-occupied houses - 4 rooms (%)
Rooms in owner-occupied houses - 5 rooms (%)
Rooms in owner-occupied houses - 6 rooms (%)
Rooms in owner-occupied houses - 7 rooms (%)
Rooms in owner-occupied houses - 8 rooms (%)
Rooms in owner-occupied houses - 9+ rooms (%)
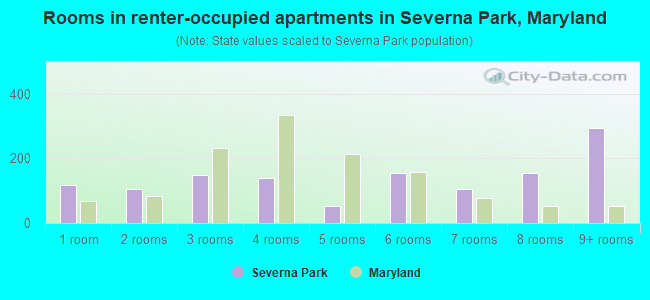
Rooms in renter-occupied houses - 1 room (%)
Rooms in renter-occupied houses - 2 rooms (%)
Rooms in renter-occupied houses - 3 rooms (%)
Rooms in renter-occupied houses - 4 rooms (%)
Rooms in renter-occupied houses - 5 rooms (%)
Rooms in renter-occupied houses - 6 rooms (%)
Rooms in renter-occupied houses - 7 rooms (%)
Rooms in renter-occupied houses - 8 rooms (%)
Rooms in renter-occupied houses - 9+ rooms (%)
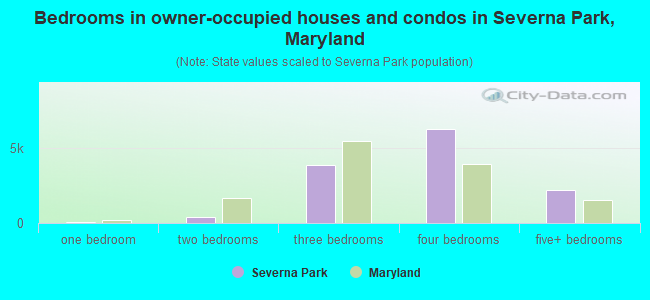
Bedrooms in owner-occupied houses - no bedrooms (%)
Bedrooms in owner-occupied houses - 1 bedroom (%)
Bedrooms in owner-occupied houses - 2 bedrooms (%)
Bedrooms in owner-occupied houses - 3 bedrooms (%)
Bedrooms in owner-occupied houses - 4 bedrooms (%)
Bedrooms in owner-occupied houses - 5+ bedrooms (%)
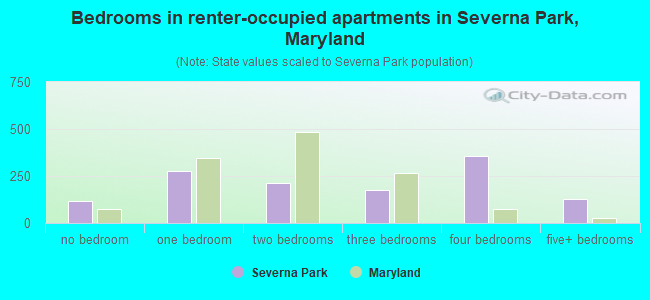
Bedrooms in renter-occupied houses - no bedrooms (%)
Bedrooms in renter-occupied houses - 1 bedroom (%)
Bedrooms in renter-occupied houses - 2 bedrooms (%)
Bedrooms in renter-occupied houses - 3 bedrooms (%)
Bedrooms in renter-occupied houses - 4 bedrooms (%)
Bedrooms in renter-occupied houses - 5+ bedrooms (%)
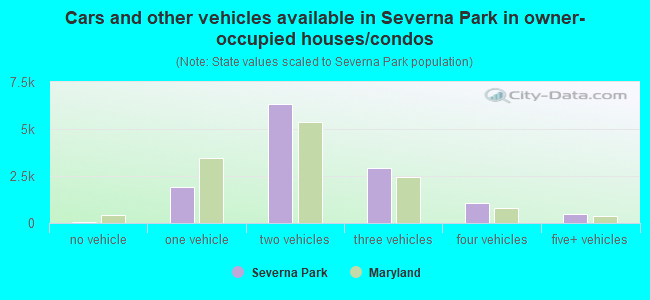
Vehicles available in owner-occupied houses - no vehicle available (%)
Vehicles available in owner-occupied houses - 1 vehicle available(%)
Vehicles available in owner-occupied houses - 2 Vehicles available (%)
Vehicles available in owner-occupied houses - 3 Vehicles available (%)
Vehicles available in owner-occupied houses - 4 Vehicles available (%)
Vehicles available in owner-occupied houses - 5+ Vehicles available (%)
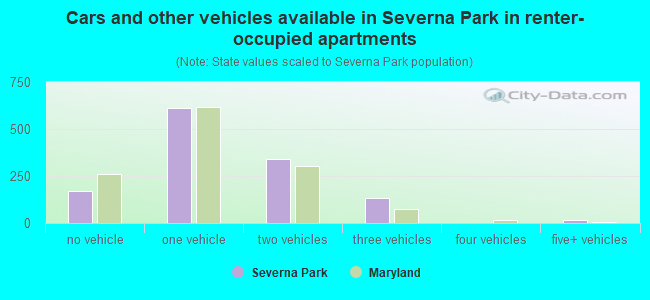
Vehicles available in renter-occupied houses - no vehicle available (%)
Vehicles available in renter-occupied houses - 1 vehicle available (%)
Vehicles available in renter-occupied houses - 2 Vehicles available (%)
Vehicles available in renter-occupied houses - 3 Vehicles available (%)
Vehicles available in renter-occupied houses - 4 Vehicles available (%)
Vehicles available in renter-occupied houses - 5+ Vehicles available (%)
Housing units in structures - 1, detached (%)
Housing units in structures - 1, attached (%)
Housing units in structures - 2 (%)
Housing units in structures - 3 or 4 (%)
Housing units in structures - 5 to 9 (%)
Housing units in structures - 10 to 19 (%)
Housing units in structures - 20 to 49 (%)
Housing units in structures - 50 or more (%)
Housing units in structures - Mobile home (%)
Housing units in structures - Boat, RV, van, etc. (%)
Housing units in structures - Owners - 1, detached (%)
Housing units in structures - Owners - 1, attached (%)
Housing units in structures - Owners - 2 (%)
Housing units in structures - Owners - 3 or 4 (%)
Housing units in structures - Owners - 5 to 9 (%)
Housing units in structures - Owners - 10 to 19 (%)
Housing units in structures - Owners - 20 to 49 (%)
Housing units in structures - Owners - 50 or more (%)
Housing units in structures - Owners - Mobile home (%)
Housing units in structures - Owners - Boat, RV, van, etc. (%)
Housing units in structures - Renters - 1, detached (%)
Housing units in structures - Renters - 1, attached (%)
Housing units in structures - Renters - 2 (%)
Housing units in structures - Renters - 3 or 4 (%)
Housing units in structures - Renters - 5 to 9 (%)
Housing units in structures - Renters - 10 to 19 (%)
Housing units in structures - Renters - 20 to 49 (%)
Housing units in structures - Renters - 50 or more (%)
Housing units in structures - Renters - Mobile home (%)
Housing units in structures - Renters - Boat, RV, van, etc. (%)
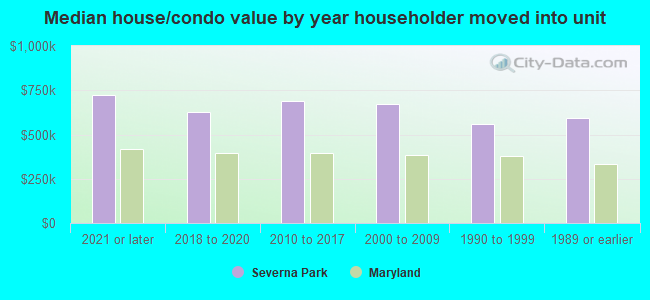
House/condo owner moved in on average (years ago)
Renter moved in on average (years ago)
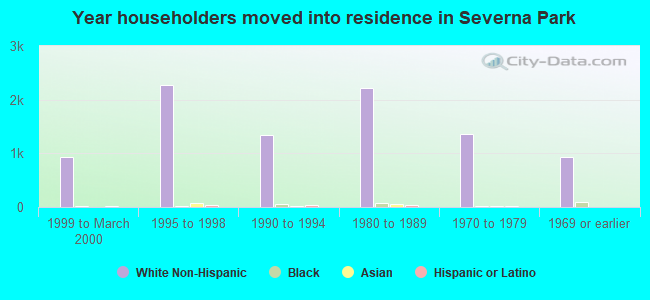
Year householder moved into unit - Moved in 1999 to March 2000 (%)
Year householder moved into unit - Moved in 1999 to March 2000 (%) - White
Year householder moved into unit - Moved in 1999 to March 2000 (%) - Black or African American
Year householder moved into unit - Moved in 1999 to March 2000 (%) - Asian
Year householder moved into unit - Moved in 1999 to March 2000 (%) - Hispanic or Latino
Year householder moved into unit - Moved in 1999 to March 2000 (%) - American Indian and Alaska Native
Year householder moved into unit - Moved in 1999 to March 2000 (%) - Multirace
Year householder moved into unit - Moved in 1999 to March 2000 (%) - Other Race
Year householder moved into unit - Moved in 1995 to 1998 (%)
Year householder moved into unit - Moved in 1995 to 1998 (%) - White
Year householder moved into unit - Moved in 1995 to 1998 (%) - Black or African American
Year householder moved into unit - Moved in 1995 to 1998 (%) - Asian
Year householder moved into unit - Moved in 1995 to 1998 (%) - Hispanic or Latino
Year householder moved into unit - Moved in 1995 to 1998 (%) - American Indian and Alaska Native
Year householder moved into unit - Moved in 1995 to 1998 (%) - Multirace
Year householder moved into unit - Moved in 1995 to 1998 (%) - Other Race
Year householder moved into unit - Moved in 1990 to 1994 (%)
Year householder moved into unit - Moved in 1990 to 1994 (%) - White
Year householder moved into unit - Moved in 1990 to 1994 (%) - Black or African American
Year householder moved into unit - Moved in 1990 to 1994 (%) - Asian
Year householder moved into unit - Moved in 1990 to 1994 (%) - Hispanic or Latino
Year householder moved into unit - Moved in 1990 to 1994 (%) - American Indian and Alaska Native
Year householder moved into unit - Moved in 1990 to 1994 (%) - Multirace
Year householder moved into unit - Moved in 1990 to 1994 (%) - Other Race
Year householder moved into unit - Moved in 1980 to 1989 (%)
Year householder moved into unit - Moved in 1980 to 1989 (%) - White
Year householder moved into unit - Moved in 1980 to 1989 (%) - Black or African American
Year householder moved into unit - Moved in 1980 to 1989 (%) - Asian
Year householder moved into unit - Moved in 1980 to 1989 (%) - Hispanic or Latino
Year householder moved into unit - Moved in 1980 to 1989 (%) - American Indian and Alaska Native
Year householder moved into unit - Moved in 1980 to 1989 (%) - Multirace
Year householder moved into unit - Moved in 1980 to 1989 (%) - Other Race
Year householder moved into unit - Moved in 1970 to 1979 (%)
Year householder moved into unit - Moved in 1970 to 1979 (%) - White
Year householder moved into unit - Moved in 1970 to 1979 (%) - Black or African American
Year householder moved into unit - Moved in 1970 to 1979 (%) - Asian
Year householder moved into unit - Moved in 1970 to 1979 (%) - Hispanic or Latino
Year householder moved into unit - Moved in 1970 to 1979 (%) - American Indian and Alaska Native
Year householder moved into unit - Moved in 1970 to 1979 (%) - Multirace
Year householder moved into unit - Moved in 1970 to 1979 (%) - Other Race
Year householder moved into unit - Moved in 1969 or earlier (%)
Year householder moved into unit - Moved in 1969 or earlier (%) - White
Year householder moved into unit - Moved in 1969 or earlier (%) - Black or African American
Year householder moved into unit - Moved in 1969 or earlier (%) - Asian
Year householder moved into unit - Moved in 1969 or earlier (%) - Hispanic or Latino
Year householder moved into unit - Moved in 1969 or earlier (%) - American Indian and Alaska Native
Year householder moved into unit - Moved in 1969 or earlier (%) - Multirace
Year householder moved into unit - Moved in 1969 or earlier (%) - Other Race
Housing units lacking complete plumbing facilities (%)
Housing units lacking complete kitchen facilities (%)
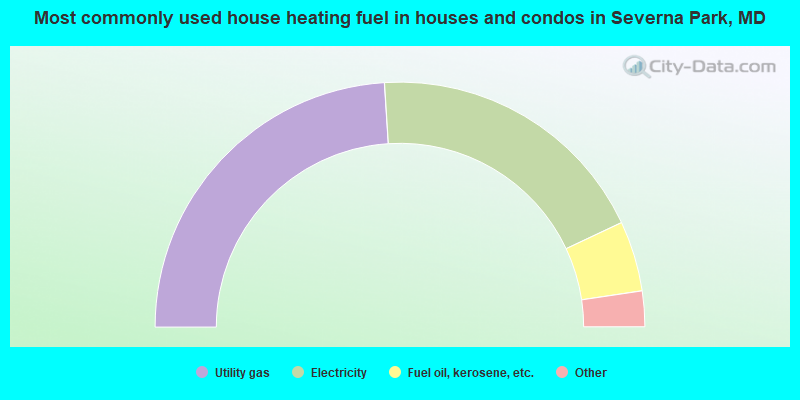
House heating fuel used in houses and condos - Utility gas (%)
House heating fuel used in houses and condos - Bottled, tank, or LP gas (%)
House heating fuel used in houses and condos - Electricity (%)
House heating fuel used in houses and condos - Fuel oil, kerosene, etc. (%)
House heating fuel used in houses and condos - Coal or coke (%)
House heating fuel used in houses and condos - Wood (%)
House heating fuel used in houses and condos - Solar energy (%)
House heating fuel used in houses and condos - Other fuel (%)
House heating fuel used in houses and condos - No fuel used (%)
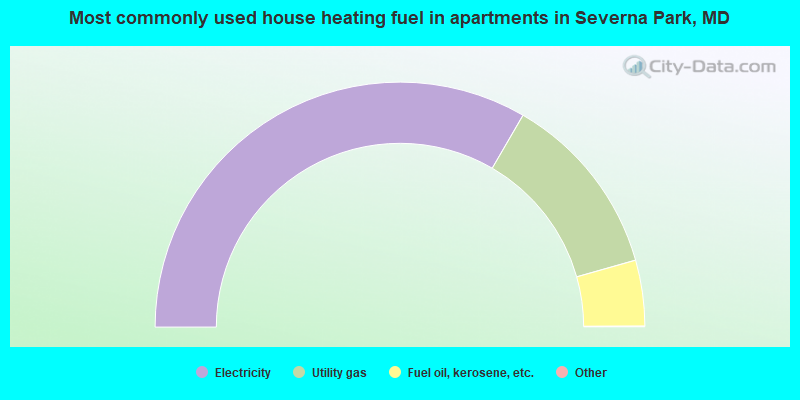
House heating fuel used in apartments - Utility gas (%)
House heating fuel used in apartments - Bottled, tank, or LP gas (%)
House heating fuel used in apartments - Electricity (%)
House heating fuel used in apartments - Fuel oil, kerosene, etc. (%)
House heating fuel used in apartments - Coal or coke (%)
House heating fuel used in apartments - Wood (%)
House heating fuel used in apartments - Solar energy (%)
House heating fuel used in apartments - Other fuel (%)
House heating fuel used in apartments - No fuel used (%)
Median year house/condo built: 1978Median year apartment built: 1982Household type by relationship:
Households: 40,808
Male householders: 7,461 (847 living alone ), Female householders: 6,452 (1,587 living alone )9,358 spouses (9,321 opposite-sex spouses ), 548 unmarried partners , (537 opposite-sex unmarried partners ), 14,168 children (13,448 natural , 401 adopted , 318 stepchildren ), 657 grandchildren , 225 brothers or sisters , 578 parents , 0 foster children , 370 other relatives , 704 non-relatives In group quarters: 282
Size of family households: 3,571 2-persons , 2,518 3-persons , 3,181 4-persons , 1,097 5-persons , 322 6-persons , 59 7-or-more-persons .
Size of nonfamily households: 2,551 1-person , 552 2-persons , 129 3-persons , 7 5-persons .
9,510 married couples with children. single-parent households (334 men , 337 women ).
93.6% of residents of Severna Park speak English at home. of residents speak Spanish at home (76% speak English very well , 10% speak English well , 14% speak English not well ).of residents speak other Indo-European language at home (82% speak English very well , 14% speak English well , 4% speak English not well ).of residents speak Asian or Pacific Island language at home (65% speak English very well , 18% speak English well , 11% speak English not well , 6% don't speak English at all ).of residents speak other language at home (100% speak English very well ).
Foreign born population: 1,983 (4.9%)of them are naturalized citizens )
Median number of rooms in houses and condos:
Median number of rooms in apartments
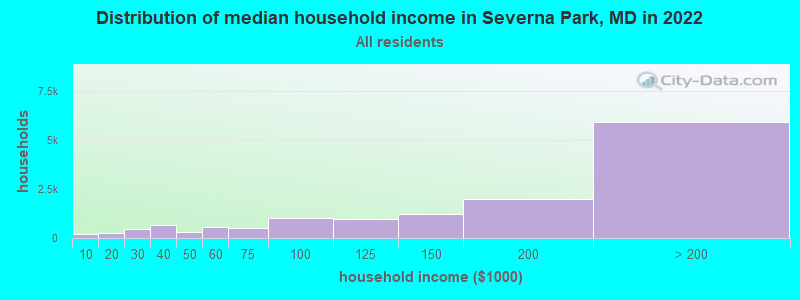
Severna Park, MD household income distribution 204 Less than $10,000259 $10,000 to $19,999485 $20,000 to $29,999678 $30,000 to $39,999317 $40,000 to $49,999546 $50,000 to $59,999529 $60,000 to $74,9991,026 $75,000 to $99,999994 $100,000 to $124,9991,231 $125,000 to $149,9992,013 $150,000 to $199,9995,933 $200,000 or more
Home value of owner - occupied houses in 2022 in Severna Park, MD 4 Less than $10,00060 $25,000 to $29,9993 $35,000 to $39,99920 $50,000 to $59,99916 $60,000 to $69,9998 $80,000 to $89,9999 $125,000 to $149,999127 $200,000 to $249,999187 $250,000 to $299,999973 $300,000 to $399,9992,375 $400,000 to $499,9996,457 $500,000 to $749,9992,390 $750,000 to $999,999615 $1,000,000 to $1,499,999165 $1,500,000 to $1,999,999302 $2,000,000 or moreRent paid by renters in 2022 in Severna Park, MD 13 $250 to $2997 $300 to $34967 $500 to $54912 $550 to $5992 $600 to $6498 $800 to $89980 $900 to $999327 $1,000 to $1,249221 $1,250 to $1,49997 $1,500 to $1,999131 $2,000 to $2,49953 $2,500 to $2,99999 $3,000 to $3,49926 $3,500 or more80 No cash rent
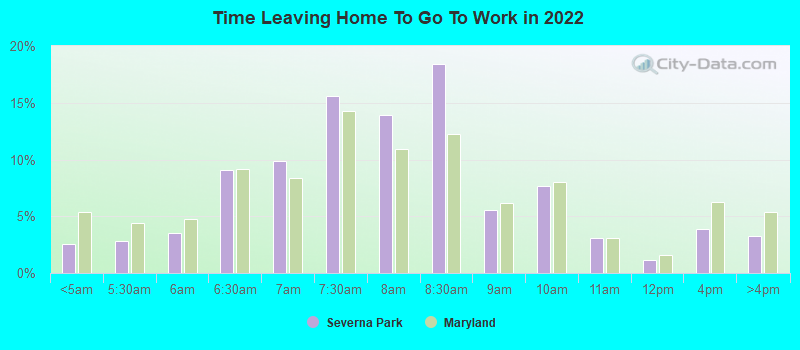
Percentage of workers working in this county: 75.0%Number of people working at home: 5,174 (25.4% of all workers )
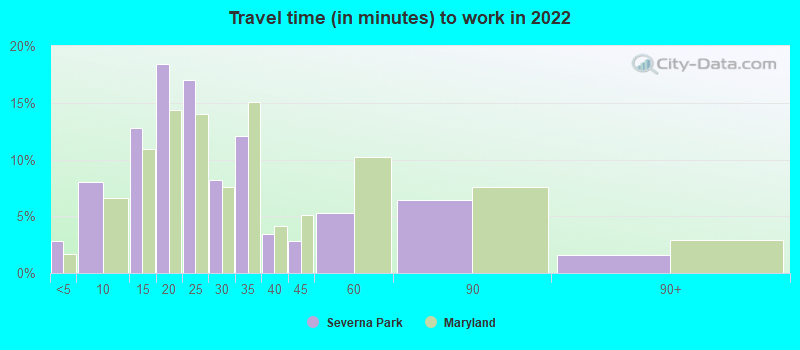
Travel time to work (commute)
Less than 5 minutes: 4055 to 9 minutes: 1,18810 to 14 minutes: 1,30515 to 19 minutes: 1,85020 to 24 minutes: 2,17125 to 29 minutes: 1,60230 to 34 minutes: 2,45835 to 39 minutes: 89040 to 44 minutes: 46545 to 59 minutes: 1,45160 to 89 minutes: 1,23390 or more minutes: 337
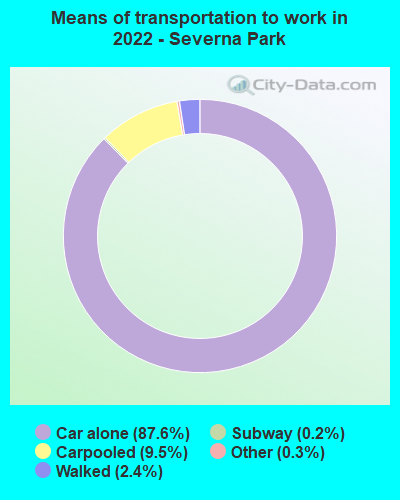
Means of transportation to work:
Drove a car alone: 9,069 (61.0%)Carpooled: 988 (6.6%)Long-distance train or commuter rail : 10 (0.1%)Taxi: 35 (0.2%)Walked: 254 (1.7%)Worked at home: 5,174 (34.8%)
Unemployment by race in 2022
Unemployment rate for White non-Hispanic residents 2.7% Males1.5% FemalesUnemployment rate for Black residents 5.7% Males4.5% FemalesUnemployment rate for Asian residents 5.1% FemalesUnemployment rate for other race residents 9.3% FemalesUnemployment rate for Hispanic or Latino residents 2.6% Females
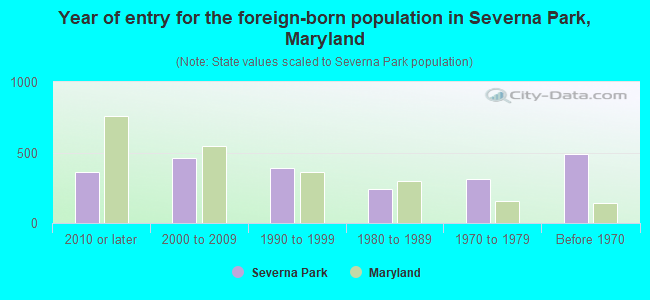
Year of entry for the foreign-born population in Severna Park, Maryland
362 2010 or later 464 2000 to 2009 390 1990 to 1999 239 1980 to 1989 313 1970 to 1979 491 Before 1970
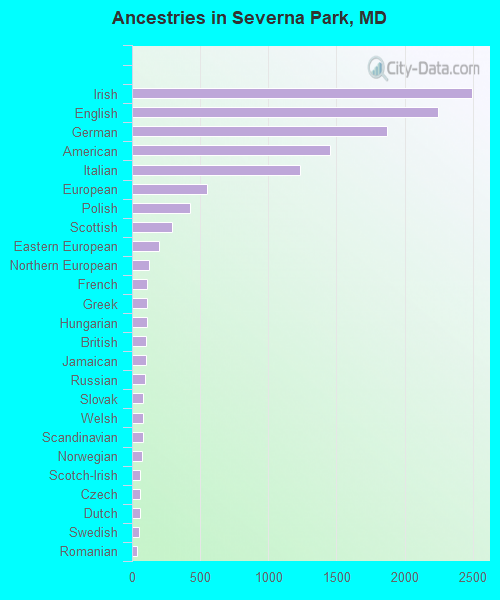
First ancestries reported:
Irish: 2,495 (16.4%)
English: 2,249 (14.8%)
German: 1,874 (12.3%)
American: 1,453 (9.6%)
Italian: 1,232 (8.1%)
European: 553 (3.6%)
Polish: 422 (2.8%)
Scottish: 295 (1.9%)
Eastern European: 200 (1.3%)
Northern European: 126 (0.8%)
French: 112 (0.7%)
Greek: 110 (0.7%)
Hungarian: 107 (0.7%)
British: 103 (0.7%)
Jamaican: 103 (0.7%)
Russian: 98 (0.6%)
Slovak: 81 (0.5%)
Welsh: 80 (0.5%)
Scandinavian: 78 (0.5%)
Norwegian: 70 (0.5%)
Scotch-Irish: 62 (0.4%)
Czech: 59 (0.4%)
Dutch: 58 (0.4%)
Swedish: 49 (0.3%)
Romanian: 34 (0.2%)
Egyptian: 31 (0.2%)
French Canadian: 31 (0.2%)
Estonian: 29 (0.2%)
Finnish: 27 (0.2%)
Celtic: 21 (0.1%)
Lebanese: 19 (0.1%)
Iranian: 17 (0.1%)
Austrian: 14 (0.09%)
Brazilian: 13 (0.09%)
Lithuanian: 13 (0.09%)
Moroccan: 11 (0.07%)
African: 10 (0.07%)
Turkish: 9 (0.06%)
Croatian: 8 (0.05%)
Palestinian: 7 (0.05%) Most common places of birth for foreign-born residents (%): Korea Severna Park:
8.9% (183)Maryland:
3.4% (32,635)
El Salvador Severna Park:
8.8% (181)Maryland:
12.0% (115,412)
England Severna Park:
7.5% (154)Maryland:
0.6% (5,828)
China, excluding Hong Kong and Taiwan Severna Park:
6.3% (130)Maryland:
4.6% (44,742)
India Severna Park:
6.3% (129)Maryland:
6.4% (61,725)
Canada Severna Park:
5.5% (112)Maryland:
0.9% (8,603)
Nepal Severna Park:
4.8% (99)Maryland:
1.1% (10,205)
Egypt Severna Park:
3.6% (74)Maryland:
0.5% (4,414)
United Kingdom, excluding England and Scotland Severna Park:
3.5% (72)Maryland:
0.7% (6,724)
Germany Severna Park:
3.1% (64)Maryland:
1.2% (11,265)
Jamaica Severna Park:
3.1% (63)Maryland:
2.8% (27,444)
Spain Severna Park:
2.7% (56)Maryland:
0.3% (2,547)
Philippines Severna Park:
2.7% (55)Maryland:
3.8% (36,698)
Japan Severna Park:
2.2% (46)Maryland:
0.5% (4,995)
Russia Severna Park:
2.1% (44)Maryland:
1.0% (9,481)
Colombia Severna Park:
1.9% (38)Maryland:
1.3% (12,898)
Nicaragua Severna Park:
1.7% (34)Maryland:
0.6% (5,899)
Guyana Severna Park:
1.6% (33)Maryland:
0.8% (8,109)
Romania Severna Park:
1.6% (33)Maryland:
0.3% (2,576)
Vietnam Severna Park:
1.6% (32)Maryland:
1.9% (18,716)
Place of birth for U.S.-born residents:
This state: 21,970Other state: 16,097Northeast: 5,569Midwest: 2,409South: 5,976West: 2,017 87.5% of Severna Park residents lived in the same house 1 years ago.
Out of people who lived in different houses, 33.9% lived in this county.
Out of people who lived in different counties, 50.2% lived in Maryland.
Severna Park:
87.5%State average:
88.5%
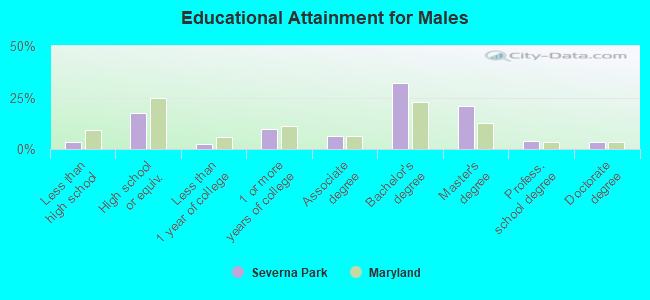
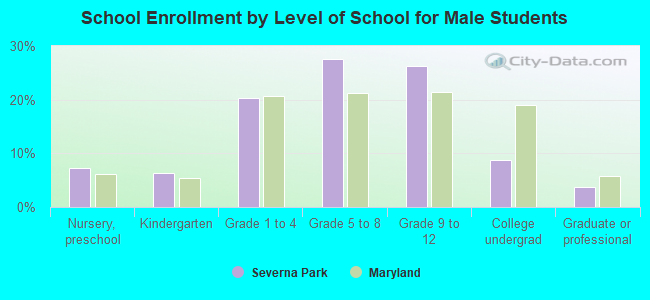
Education attainment for males 25 years and older:
No schooling: 94Nursery to 4th grade: 45th and 6th grade: 357th and 8th grade: 199th grade: 12610th grade: 7311th grade: 5912th grade, no diploma: 75High school graduate (or equivalency): 2,431Less than 1 year of college: 361Some college more than 1 year, no degree: 1,325Associate degree: 840Bachelor's degree: 4,426Master's degree: 2,885Professional school degree: 545Doctorate degree: 485
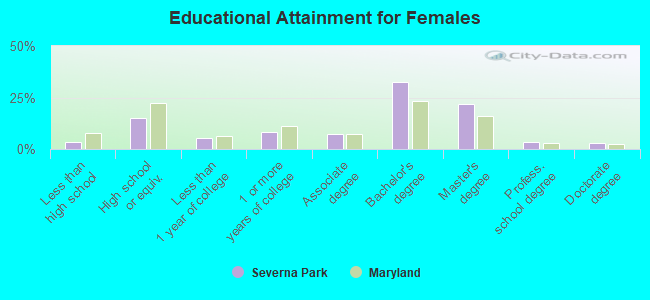
Education attainment for females 25 years and older:
No schooling: 80Nursery to 4th grade: 05th and 6th grade: 107th and 8th grade: 819th grade: 4010th grade: 8711th grade: 12112th grade, no diploma: 85High school graduate (or equivalency): 2,149Less than 1 year of college: 750Some college more than 1 year, no degree: 1,164Associate degree: 1,008Bachelor's degree: 4,589Master's degree: 3,058Professional school degree: 475Doctorate degree: 396
Housing units in structures:
One, detached: 13,560One, attached: 309Two: 1023 or 4: 2210 to 19: 8820 to 49: 8950 or more: 349Housing units lacking complete plumbing facilities in 2022: 0.0%Housing units lacking complete kitchen facilities in 2022: 0.5%House/condo owner moved in on average 16 years ago
Renter moved in on average 3 years ago
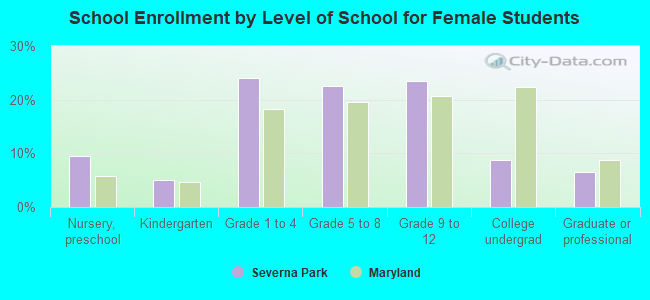
Private vs. public school enrollment:
Students in private schools in grades 1 to 8 (elementary and middle school): 1,059 Students in private schools in grades 9 to 12 (high school): 593 Students in private undergraduate colleges: 99