Shirley, NY (New York) Houses and Residents
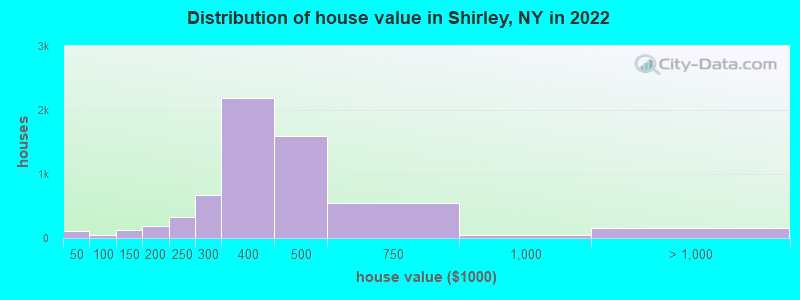
Estimated median house or condo value in 2022: $395,377 (it was $122,800 in 2000 )
Shirley:
$395,377New York:
$400,400
Lower value quartile - upper value quartile: $312,490 - $452,991Total population: 27,854 (Urban population: 25,395, Rural population: 0)
Houses: 8,737 (8,113 occupied: 7,394 owner occupied, 715 renter occupied )
% of renters here:
9%State:
46%
Housing density: 785 houses/condos per square mile
Median price asked for vacant for-sale houses and condos in 2022: $589,807.
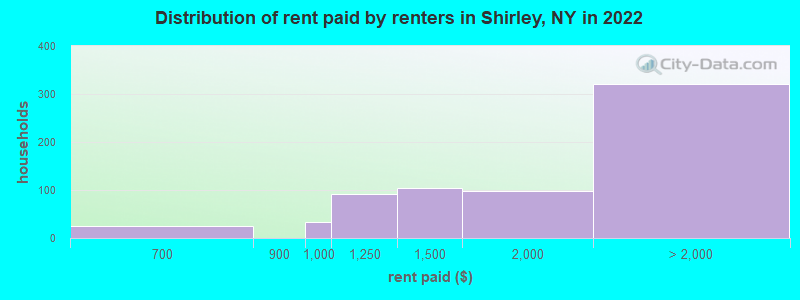
Median contract rent in 2022: $1,805 (lower quartile is $1,200, upper quartile is over $2,000)
Median rent asked for vacant for-rent units in 2022: $1,513
Median gross rent in Shirley, NY in 2022: over $2,000
Housing units in Shirley with a mortgage: 5,118 (336 second mortgage, 14 home equity loan, 287 both second mortgage and home equity loan )Houses without a mortgage: 212
Median household income for houses/condos with a mortgage: $131,710
Median household income for apartments without a mortgage: $70,430
Median monthly housing costs: $2,116
Data:
Median house or condo value ($)
Median house or condo value ($ change since 2000)
Median house or condo value ($) - White
Median house or condo value ($) - Black or African American
Median house or condo value ($) - Asian
Median house or condo value ($) - Hispanic or Latino
Median house or condo value ($) - American Indian and Alaska Native
Median house or condo value ($) - Multirace
Median house or condo value ($) - Other Race
Median price asked for mobile homes ($)
Household density (households per square mile)
Mean house or condo value by units in structure - 1, detached ($)
Mean house or condo value by units in structure - 1, attached ($)
Mean house or condo value by units in structure - 2 ($)
Mean house or condo value by units in structure by units in structure - 3 or 4 ($)
Mean house or condo value by units in structure - 5 or more ($)
Mean house or condo value by units in structure - Boat, RV, van, etc. ($)
Mean house or condo value by units in structure - Mobile home ($)
Median contract rent ($)
Median contract rent - Lower quartile ($)
Median contract rent - Upper quartile ($)
Median gross rent ($)
Urban houses (%)
Rural houses (%)
Houses occupied (%)
Houses occupied (% change since 2000)
Houses owner occupied (%)
Houses owner occupied (% change since 2000)
Houses renter occupied (%)
Houses renter occupied (% change since 2000)
Vacant housing units - For rent (%)
Vacant housing units - For rent (% change since 2000)
Vacant housing units - For sale only (%)
Vacant housing units - For sale only (% change since 2000)
Vacant housing units - Rented or sold, not occupied (%)
Vacant housing units - Rented or sold, not occupied (% change since 2000)
Vacant housing units - For seasonal, recreational, or occasional use (%)
Vacant housing units - For seasonal, recreational, or occasional use (% change since 2000)
Vacant housing units - For migrant workers (%)
Vacant housing units - For migrant workers (% change since 2000)
Vacant housing units - Other vacant (%)
Vacant housing units - Other vacant (% change since 2000)
Median monthly housing costs ($)
Median household income for houses/condos with a mortgage ($)
Median household income for houses/condos without a mortgage ($)
Median household income ($)
Median household income ($) - White
Median household income ($) - Black or African American
Median household income ($) - Asian
Median household income ($) - Hispanic or Latino
Median household income ($) - American Indian and Alaska Native
Median household income ($) - Multirace
Median household income ($) - Other Race
Mortgage status - with mortgage (%)
Mortgage status - with second mortgage (%)
Mortgage status - with home equity loan (%)
Mortgage status - with both second mortgage and home equity loan (%)
Mortgage status - without a mortgage (%)
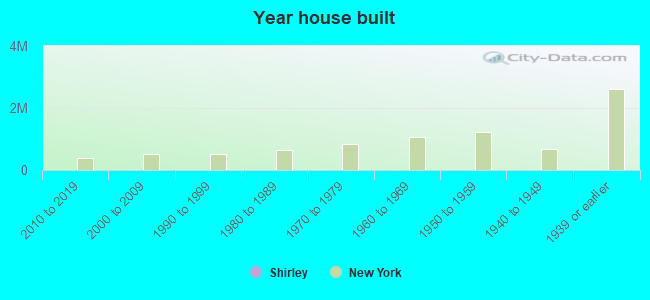
Median year house/condo built
Median year apartment built
Household type by relationship - Male householder living alone (%)
Household type by relationship - Male householder not living alone (%)
Household type by relationship - Female householder living alone (%)
Household type by relationship - Female householder not living alone (%)
Household type by relationship - Opposite-Sex spouse (%)
Household type by relationship - Same-Sex spouse (%)
Household type by relationship - Opposite-Sex unmarried partner (%)
Household type by relationship - Same-Sex unmarried partner (%)
Household type by relationship - In group quarters (%)
Size of family households - 2-person household (%)
Size of family households - 3-person household (%)
Size of family households - 4-person household (%)
Size of family households - 5-person household (%)
Size of family households - 6-person household (%)
Size of family households - 7-or-more-person household (%)
Size of nonfamily households - 1-person household (%)
Size of nonfamily households - 2-person household (%)
Size of nonfamily households - 3-person household (%)
Size of nonfamily households - 4-person household (%)
Size of nonfamily households - 5-person household (%)
Size of nonfamily households - 6-person household (%)
Size of nonfamily households - 7-or-moreperson household (%)
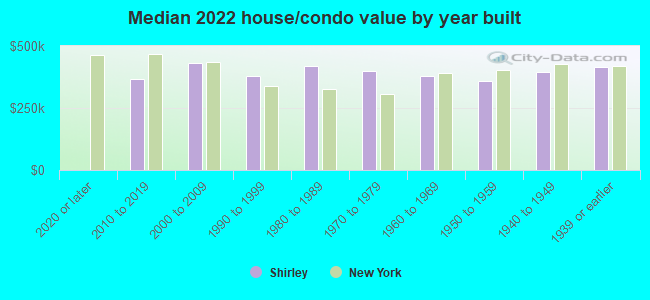
Year house built - Built 2010 or later (%)
Year house built - Built 2000 to 2009 (%)
Year house built - Built 1990 to 1999 (%)
Year house built - Built 1980 to 1989 (%)
Year house built - Built 1970 to 1979 (%)
Year house built - Built 1960 to 1969 (%)
Year house built - Built 1950 to 1959 (%)
Year house built - Built 1940 to 1949 (%)
Year house built - Built 1939 or earlier (%)
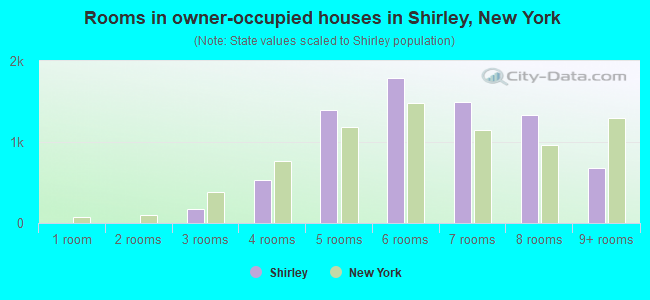
Median number of rooms in houses and condos
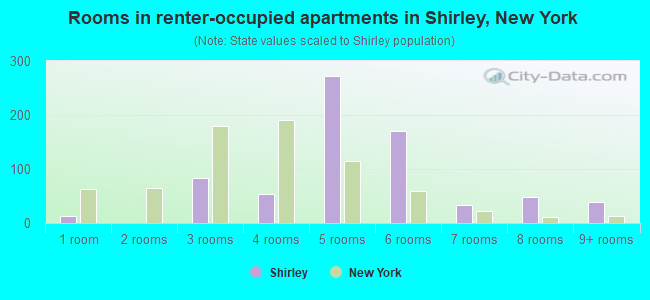
Median number of rooms in apartments
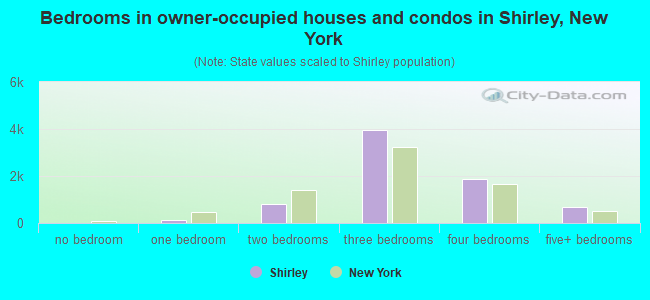
Median number of bedrooms in owner occupied houses
Mean number of bedrooms in owner occupied houses
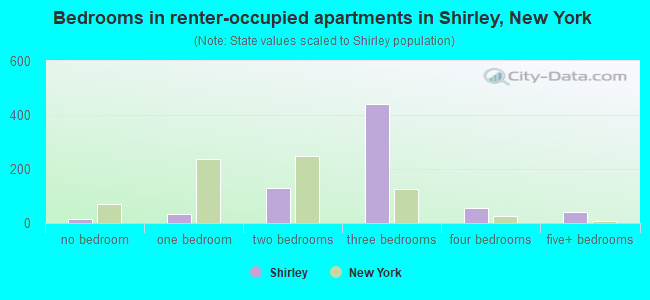
Median number of bedrooms in renter occupied houses
Mean number of bedrooms in renter occupied houses
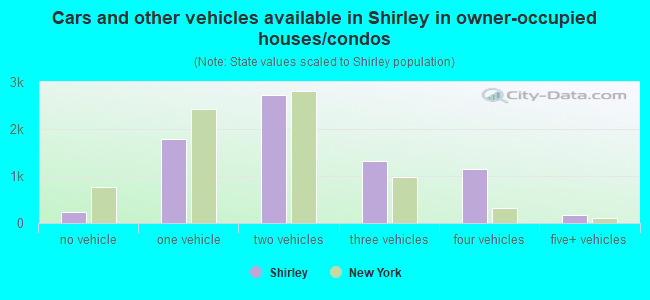
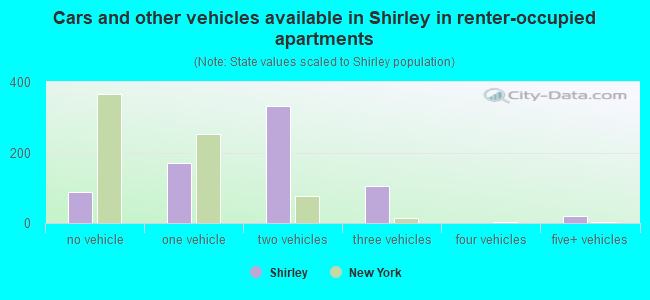
Median number of vehichles in owner occupied houses
Mean number of vehichles in owner occupied houses
Median number of vehichles in renter occupied houses
Mean number of vehichles in renter occupied houses
Rooms in owner-occupied houses - 1 room (%)
Rooms in owner-occupied houses - 2 rooms (%)
Rooms in owner-occupied houses - 3 rooms (%)
Rooms in owner-occupied houses - 4 rooms (%)
Rooms in owner-occupied houses - 5 rooms (%)
Rooms in owner-occupied houses - 6 rooms (%)
Rooms in owner-occupied houses - 7 rooms (%)
Rooms in owner-occupied houses - 8 rooms (%)
Rooms in owner-occupied houses - 9+ rooms (%)
Rooms in renter-occupied houses - 1 room (%)
Rooms in renter-occupied houses - 2 rooms (%)
Rooms in renter-occupied houses - 3 rooms (%)
Rooms in renter-occupied houses - 4 rooms (%)
Rooms in renter-occupied houses - 5 rooms (%)
Rooms in renter-occupied houses - 6 rooms (%)
Rooms in renter-occupied houses - 7 rooms (%)
Rooms in renter-occupied houses - 8 rooms (%)
Rooms in renter-occupied houses - 9+ rooms (%)
Bedrooms in owner-occupied houses - no bedrooms (%)
Bedrooms in owner-occupied houses - 1 bedroom (%)
Bedrooms in owner-occupied houses - 2 bedrooms (%)
Bedrooms in owner-occupied houses - 3 bedrooms (%)
Bedrooms in owner-occupied houses - 4 bedrooms (%)
Bedrooms in owner-occupied houses - 5+ bedrooms (%)
Bedrooms in renter-occupied houses - no bedrooms (%)
Bedrooms in renter-occupied houses - 1 bedroom (%)
Bedrooms in renter-occupied houses - 2 bedrooms (%)
Bedrooms in renter-occupied houses - 3 bedrooms (%)
Bedrooms in renter-occupied houses - 4 bedrooms (%)
Bedrooms in renter-occupied houses - 5+ bedrooms (%)
Vehicles available in owner-occupied houses - no vehicle available (%)
Vehicles available in owner-occupied houses - 1 vehicle available(%)
Vehicles available in owner-occupied houses - 2 Vehicles available (%)
Vehicles available in owner-occupied houses - 3 Vehicles available (%)
Vehicles available in owner-occupied houses - 4 Vehicles available (%)
Vehicles available in owner-occupied houses - 5+ Vehicles available (%)
Vehicles available in renter-occupied houses - no vehicle available (%)
Vehicles available in renter-occupied houses - 1 vehicle available (%)
Vehicles available in renter-occupied houses - 2 Vehicles available (%)
Vehicles available in renter-occupied houses - 3 Vehicles available (%)
Vehicles available in renter-occupied houses - 4 Vehicles available (%)
Vehicles available in renter-occupied houses - 5+ Vehicles available (%)
Housing units in structures - 1, detached (%)
Housing units in structures - 1, attached (%)
Housing units in structures - 2 (%)
Housing units in structures - 3 or 4 (%)
Housing units in structures - 5 to 9 (%)
Housing units in structures - 10 to 19 (%)
Housing units in structures - 20 to 49 (%)
Housing units in structures - 50 or more (%)
Housing units in structures - Mobile home (%)
Housing units in structures - Boat, RV, van, etc. (%)
Housing units in structures - Owners - 1, detached (%)
Housing units in structures - Owners - 1, attached (%)
Housing units in structures - Owners - 2 (%)
Housing units in structures - Owners - 3 or 4 (%)
Housing units in structures - Owners - 5 to 9 (%)
Housing units in structures - Owners - 10 to 19 (%)
Housing units in structures - Owners - 20 to 49 (%)
Housing units in structures - Owners - 50 or more (%)
Housing units in structures - Owners - Mobile home (%)
Housing units in structures - Owners - Boat, RV, van, etc. (%)
Housing units in structures - Renters - 1, detached (%)
Housing units in structures - Renters - 1, attached (%)
Housing units in structures - Renters - 2 (%)
Housing units in structures - Renters - 3 or 4 (%)
Housing units in structures - Renters - 5 to 9 (%)
Housing units in structures - Renters - 10 to 19 (%)
Housing units in structures - Renters - 20 to 49 (%)
Housing units in structures - Renters - 50 or more (%)
Housing units in structures - Renters - Mobile home (%)
Housing units in structures - Renters - Boat, RV, van, etc. (%)
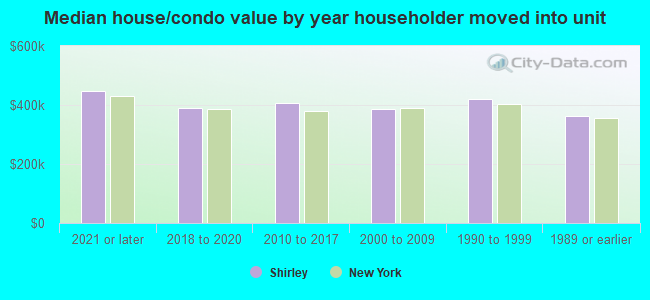
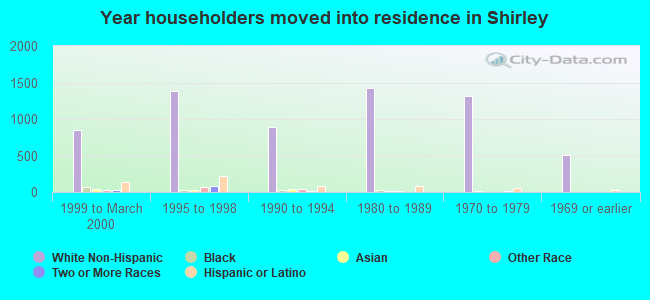
House/condo owner moved in on average (years ago)
Renter moved in on average (years ago)
Year householder moved into unit - Moved in 1999 to March 2000 (%)
Year householder moved into unit - Moved in 1999 to March 2000 (%) - White
Year householder moved into unit - Moved in 1999 to March 2000 (%) - Black or African American
Year householder moved into unit - Moved in 1999 to March 2000 (%) - Asian
Year householder moved into unit - Moved in 1999 to March 2000 (%) - Hispanic or Latino
Year householder moved into unit - Moved in 1999 to March 2000 (%) - American Indian and Alaska Native
Year householder moved into unit - Moved in 1999 to March 2000 (%) - Multirace
Year householder moved into unit - Moved in 1999 to March 2000 (%) - Other Race
Year householder moved into unit - Moved in 1995 to 1998 (%)
Year householder moved into unit - Moved in 1995 to 1998 (%) - White
Year householder moved into unit - Moved in 1995 to 1998 (%) - Black or African American
Year householder moved into unit - Moved in 1995 to 1998 (%) - Asian
Year householder moved into unit - Moved in 1995 to 1998 (%) - Hispanic or Latino
Year householder moved into unit - Moved in 1995 to 1998 (%) - American Indian and Alaska Native
Year householder moved into unit - Moved in 1995 to 1998 (%) - Multirace
Year householder moved into unit - Moved in 1995 to 1998 (%) - Other Race
Year householder moved into unit - Moved in 1990 to 1994 (%)
Year householder moved into unit - Moved in 1990 to 1994 (%) - White
Year householder moved into unit - Moved in 1990 to 1994 (%) - Black or African American
Year householder moved into unit - Moved in 1990 to 1994 (%) - Asian
Year householder moved into unit - Moved in 1990 to 1994 (%) - Hispanic or Latino
Year householder moved into unit - Moved in 1990 to 1994 (%) - American Indian and Alaska Native
Year householder moved into unit - Moved in 1990 to 1994 (%) - Multirace
Year householder moved into unit - Moved in 1990 to 1994 (%) - Other Race
Year householder moved into unit - Moved in 1980 to 1989 (%)
Year householder moved into unit - Moved in 1980 to 1989 (%) - White
Year householder moved into unit - Moved in 1980 to 1989 (%) - Black or African American
Year householder moved into unit - Moved in 1980 to 1989 (%) - Asian
Year householder moved into unit - Moved in 1980 to 1989 (%) - Hispanic or Latino
Year householder moved into unit - Moved in 1980 to 1989 (%) - American Indian and Alaska Native
Year householder moved into unit - Moved in 1980 to 1989 (%) - Multirace
Year householder moved into unit - Moved in 1980 to 1989 (%) - Other Race
Year householder moved into unit - Moved in 1970 to 1979 (%)
Year householder moved into unit - Moved in 1970 to 1979 (%) - White
Year householder moved into unit - Moved in 1970 to 1979 (%) - Black or African American
Year householder moved into unit - Moved in 1970 to 1979 (%) - Asian
Year householder moved into unit - Moved in 1970 to 1979 (%) - Hispanic or Latino
Year householder moved into unit - Moved in 1970 to 1979 (%) - American Indian and Alaska Native
Year householder moved into unit - Moved in 1970 to 1979 (%) - Multirace
Year householder moved into unit - Moved in 1970 to 1979 (%) - Other Race
Year householder moved into unit - Moved in 1969 or earlier (%)
Year householder moved into unit - Moved in 1969 or earlier (%) - White
Year householder moved into unit - Moved in 1969 or earlier (%) - Black or African American
Year householder moved into unit - Moved in 1969 or earlier (%) - Asian
Year householder moved into unit - Moved in 1969 or earlier (%) - Hispanic or Latino
Year householder moved into unit - Moved in 1969 or earlier (%) - American Indian and Alaska Native
Year householder moved into unit - Moved in 1969 or earlier (%) - Multirace
Year householder moved into unit - Moved in 1969 or earlier (%) - Other Race
Housing units lacking complete plumbing facilities (%)
Housing units lacking complete kitchen facilities (%)
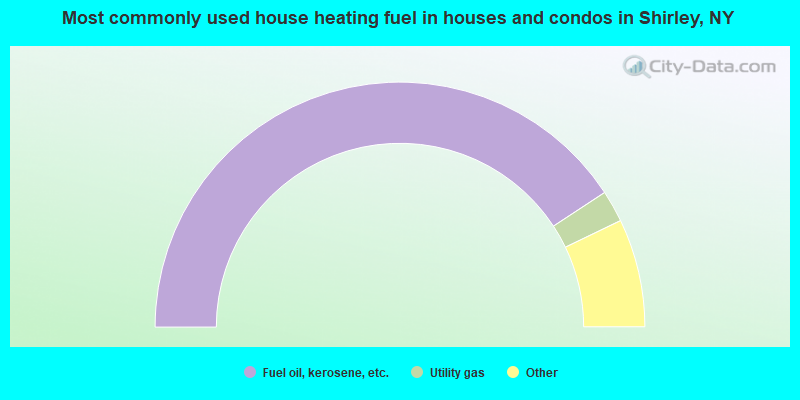
House heating fuel used in houses and condos - Utility gas (%)
House heating fuel used in houses and condos - Bottled, tank, or LP gas (%)
House heating fuel used in houses and condos - Electricity (%)
House heating fuel used in houses and condos - Fuel oil, kerosene, etc. (%)
House heating fuel used in houses and condos - Coal or coke (%)
House heating fuel used in houses and condos - Wood (%)
House heating fuel used in houses and condos - Solar energy (%)
House heating fuel used in houses and condos - Other fuel (%)
House heating fuel used in houses and condos - No fuel used (%)
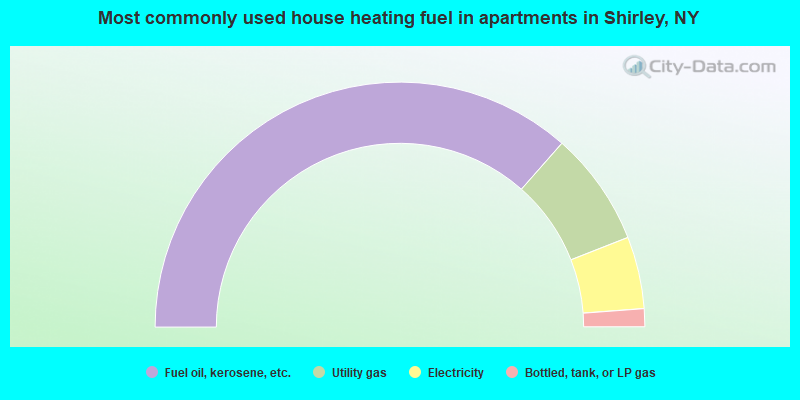
House heating fuel used in apartments - Utility gas (%)
House heating fuel used in apartments - Bottled, tank, or LP gas (%)
House heating fuel used in apartments - Electricity (%)
House heating fuel used in apartments - Fuel oil, kerosene, etc. (%)
House heating fuel used in apartments - Coal or coke (%)
House heating fuel used in apartments - Wood (%)
House heating fuel used in apartments - Solar energy (%)
House heating fuel used in apartments - Other fuel (%)
House heating fuel used in apartments - No fuel used (%)
Latest news about housing in Shirley, NY collected exclusively by city-data.com from local newspapers, TV, and radio stations
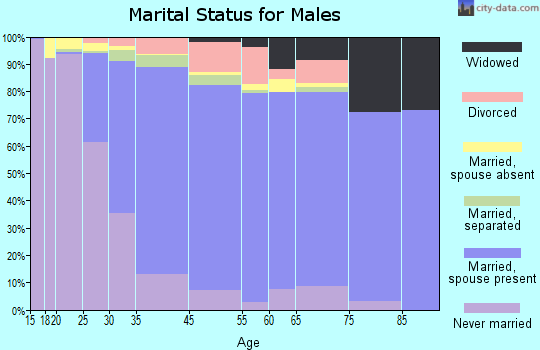
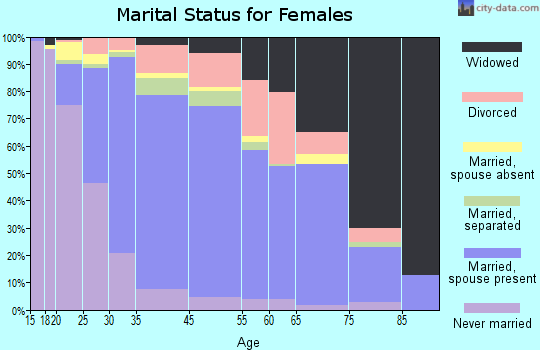
Median year house/condo built: 1975Median year apartment built: 1971Household type by relationship:
Households: 26,515
Male householders: 4,093 (529 living alone ), Female householders: 4,001 (790 living alone )4,481 spouses (4,431 opposite-sex spouses ), 823 unmarried partners , (816 opposite-sex unmarried partners ), 8,857 children (8,238 natural , 391 adopted , 228 stepchildren ), 701 grandchildren , 645 brothers or sisters , 470 parents , 9 foster children , 1,217 other relatives , 939 non-relatives In group quarters: 273
Size of family households: 1,832 2-persons , 1,600 3-persons , 1,275 4-persons , 857 5-persons , 274 6-persons , 240 7-or-more-persons .
Size of nonfamily households: 1,330 1-person , 537 2-persons , 39 3-persons , 10 4-persons , 70 7-or-more-persons .
2,946 married couples with children. single-parent households (988 men , 799 women ).
75.9% of residents of Shirley speak English at home. of residents speak Spanish at home (68% speak English very well , 19% speak English well , 11% speak English not well , 2% don't speak English at all ).of residents speak other Indo-European language at home (50% speak English very well , 32% speak English well , 13% speak English not well , 5% don't speak English at all ).of residents speak Asian or Pacific Island language at home (28% speak English very well , 51% speak English well , 20% speak English not well , 1% don't speak English at all ).of residents speak other language at home (69% speak English very well , 31% speak English well ).
Foreign born population: 3,475 (13.1%)of them are naturalized citizens )
Median number of rooms in houses and condos:
Median number of rooms in apartments
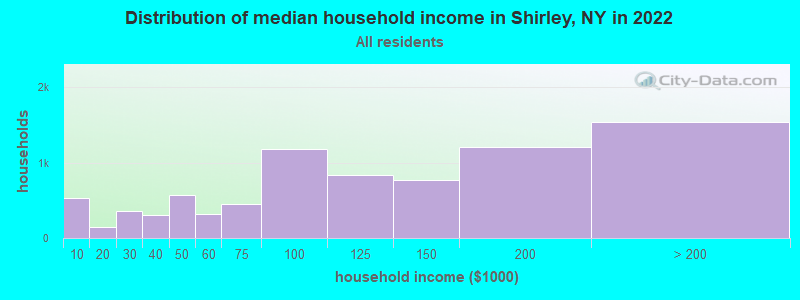
Shirley, NY household income distribution 528 Less than $10,000140 $10,000 to $19,999356 $20,000 to $29,999309 $30,000 to $39,999571 $40,000 to $49,999313 $50,000 to $59,999455 $60,000 to $74,9991,178 $75,000 to $99,999835 $100,000 to $124,999768 $125,000 to $149,9991,210 $150,000 to $199,9991,540 $200,000 or more
Home value of owner - occupied houses in 2022 in Shirley, NY 36 Less than $10,00018 $20,000 to $24,99922 $25,000 to $29,99913 $30,000 to $34,99920 $35,000 to $39,99928 $50,000 to $59,99916 $90,000 to $99,99990 $100,000 to $124,99928 $125,000 to $149,999110 $150,000 to $174,99975 $175,000 to $199,999334 $200,000 to $249,999666 $250,000 to $299,9992,183 $300,000 to $399,9991,592 $400,000 to $499,999546 $500,000 to $749,99939 $750,000 to $999,99922 $1,000,000 to $1,499,99916 $1,500,000 to $1,999,999114 $2,000,000 or moreRent paid by renters in 2022 in Shirley, NY 0 $550 to $59926 $650 to $69933 $900 to $99992 $1,000 to $1,249103 $1,250 to $1,49997 $1,500 to $1,999244 $2,000 to $2,49923 $3,000 to $3,49951 No cash rent
Percentage of workers working in this county: 90.8%Number of people working at home: 713 (5.6% of all workers )
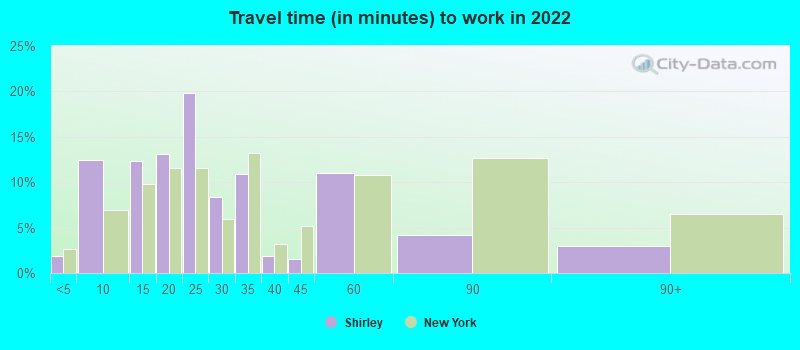
Travel time to work (commute)
Less than 5 minutes: 2085 to 9 minutes: 43410 to 14 minutes: 89215 to 19 minutes: 1,14620 to 24 minutes: 1,76925 to 29 minutes: 95430 to 34 minutes: 2,07935 to 39 minutes: 23740 to 44 minutes: 89545 to 59 minutes: 1,28660 to 89 minutes: 92490 or more minutes: 890
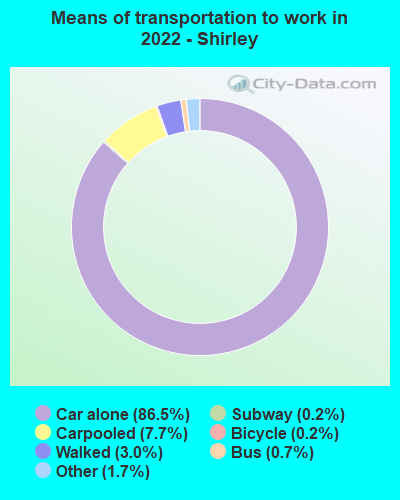
Means of transportation to work:
Drove a car alone: 5,352 (75.6%)Carpooled: 544 (7.7%)Bus : 41 (0.6%)Long-distance train or commuter rail : 11 (0.2%)Taxi: 132 (1.9%)Bicycle: 9 (0.1%)Walked: 197 (2.8%)Worked at home: 713 (10.1%)
Unemployment by race in 2022
Unemployment rate for White non-Hispanic residents 6.4% Males5.5% FemalesUnemployment rate for Black residents 2.6% MalesUnemployment rate for Asian residents 8.7% MalesUnemployment rate for other race residents 11.9% FemalesUnemployment rate for two or more race residents 3.0% MalesUnemployment rate for Hispanic or Latino residents 3.5% Males4.8% Females
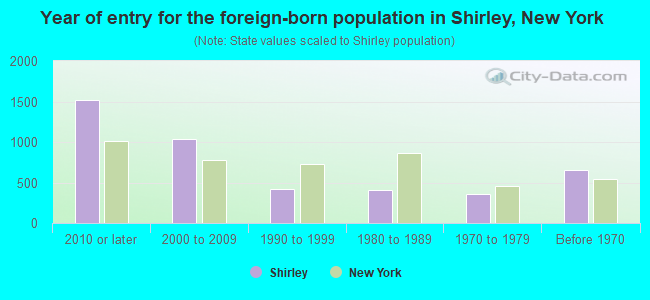
Year of entry for the foreign-born population in Shirley, New York
1,515 2010 or later 1,037 2000 to 2009 414 1990 to 1999 403 1980 to 1989 358 1970 to 1979 649 Before 1970
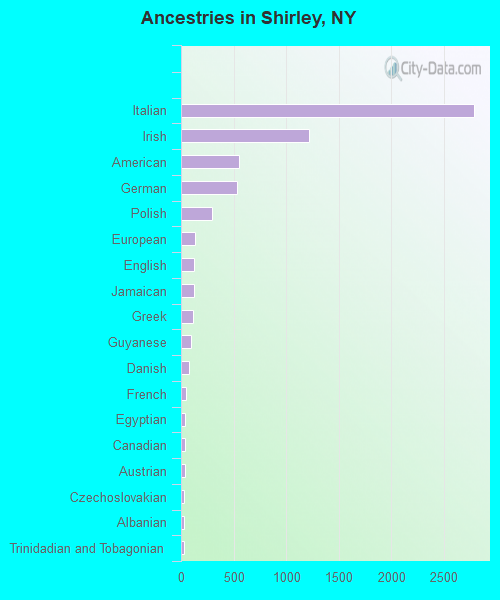
First ancestries reported:
Italian: 2,793 (23.0%)
Irish: 1,221 (10.1%)
American: 551 (4.5%)
German: 537 (4.4%)
Polish: 292 (2.4%)
European: 130 (1.1%)
English: 123 (1.0%)
Jamaican: 121 (1.0%)
Greek: 115 (0.9%)
Guyanese: 93 (0.8%)
Danish: 74 (0.6%)
French: 46 (0.4%)
Egyptian: 40 (0.3%)
Canadian: 37 (0.3%)
Austrian: 34 (0.3%)
Czechoslovakian: 32 (0.3%)
Albanian: 32 (0.3%)
Trinidadian and Tobagonian: 30 (0.2%)
Romanian: 25 (0.2%)
Haitian: 20 (0.2%)
Eastern European: 18 (0.1%)
Portuguese: 16 (0.1%)
Scottish: 14 (0.1%)
Norwegian: 13 (0.1%)
Turkish: 12 (0.10%)
Hungarian: 11 (0.09%)
Bulgarian: 11 (0.09%)
Russian: 10 (0.08%)
French Canadian: 9 (0.07%)
Ukrainian: 9 (0.07%)
Croatian: 8 (0.07%)
Welsh: 5 (0.04%)
Armenian: 3 (0.02%) Most common places of birth for foreign-born residents (%): Mexico Shirley:
14.3% (459)New York:
4.8% (214,559)
El Salvador Shirley:
13.6% (435)New York:
2.4% (108,067)
Pakistan Shirley:
13.0% (417)New York:
1.4% (62,442)
Honduras Shirley:
6.1% (197)New York:
1.2% (55,571)
China, excluding Hong Kong and Taiwan Shirley:
6.0% (191)New York:
9.1% (410,910)
Colombia Shirley:
4.1% (132)New York:
2.5% (111,920)
Jamaica Shirley:
3.4% (110)New York:
5.0% (227,557)
Dominican Republic Shirley:
3.4% (110)New York:
11.1% (501,040)
Venezuela Shirley:
3.2% (102)New York:
0.4% (19,652)
Guyana Shirley:
2.9% (94)New York:
3.8% (172,129)
India Shirley:
2.8% (90)New York:
3.5% (158,432)
Ecuador Shirley:
2.6% (84)New York:
3.9% (177,448)
Taiwan Shirley:
2.3% (75)New York:
0.7% (30,619)
Haiti Shirley:
2.3% (74)New York:
2.8% (126,936)
Canada Shirley:
1.7% (54)New York:
1.3% (59,107)
Poland Shirley:
1.6% (51)New York:
1.4% (65,102)
Italy Shirley:
1.6% (50)New York:
1.8% (81,374)
Place of birth for U.S.-born residents:
This state: 21,108Other state: 1,526Northeast: 504Midwest: 602South: 195West: 323 90.3% of Shirley residents lived in the same house 1 years ago.
Out of people who lived in different houses, 44.1% lived in this county.
Out of people who lived in different counties, 69.7% lived in New York.
Shirley:
90.3%State average:
89.6%
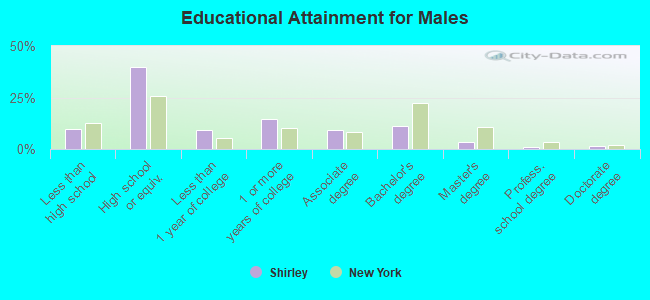
Education attainment for males 25 years and older:
No schooling: 268Nursery to 4th grade: 555th and 6th grade: 317th and 8th grade: 1049th grade: 8010th grade: 12011th grade: 8312th grade, no diploma: 157High school graduate (or equivalency): 3,638Less than 1 year of college: 847Some college more than 1 year, no degree: 1,342Associate degree: 856Bachelor's degree: 1,026Master's degree: 299Professional school degree: 66Doctorate degree: 115
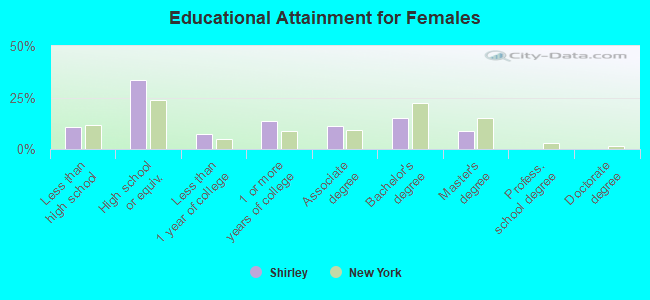
Education attainment for females 25 years and older:
No schooling: 257Nursery to 4th grade: 255th and 6th grade: 577th and 8th grade: 1229th grade: 6010th grade: 9311th grade: 12212th grade, no diploma: 251High school graduate (or equivalency): 3,026Less than 1 year of college: 677Some college more than 1 year, no degree: 1,212Associate degree: 995Bachelor's degree: 1,356Master's degree: 794Professional school degree: 11Doctorate degree: 0
Housing units in structures:
One, detached: 8,272One, attached: 129Two: 383 or 4: 545 to 9: 8310 to 19: 4320 to 49: 5650 or more: 19Mobile homes: 26Boats, RVs, vans, etc.: 15Housing units lacking complete plumbing facilities in 2022: 0.8%Housing units lacking complete kitchen facilities in 2022: 1.3%House/condo owner moved in on average 18 years ago
Renter moved in on average 6 years ago
Private vs. public school enrollment:
Students in private schools in grades 1 to 8 (elementary and middle school): 141 Students in private schools in grades 9 to 12 (high school): 0 Students in private undergraduate colleges: 160