Silver City, GA (Georgia) Houses and Residents
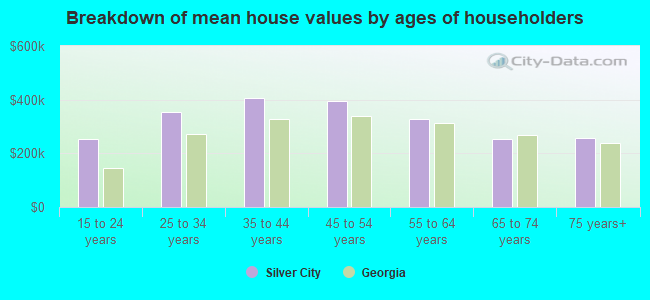
| Silver City: | $411,500 |
| Georgia: | $297,400 |
Total population: 15,128 (Urban population: 1,494, Rural population: 8,103 (41 farm, 8,062 nonfarm))
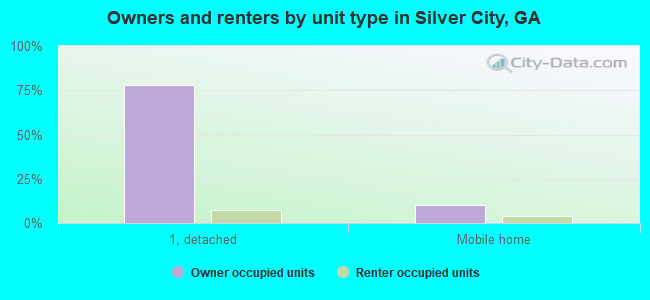
Houses: 3,545 (3,389 occupied: 2,997 owner occupied, 392 renter occupied)
| % of renters here: | 12% |
| State: | 34% |
Housing density: 77 houses/condos per square mile
Median price asked for vacant for-sale houses and condos in 2022 in this county: $364,790.
Median contract rent in 2022: $1,343 (lower quartile is $1,322, upper quartile is $1,486)
Median gross rent in Silver City, GA in 2022: $1,556
Housing units in Silver City with a mortgage: 2,020 (110 second mortgage, 223 home equity loan, 0 both second mortgage and home equity loan)
Houses without a mortgage: 346


Household type by relationship:
Households: 174,869- In family households: 159,797 (37,084 male householders, 10,539 female householders)
40,711 spouses, 60,030 children (56,251 natural, 1,374 adopted, 2,405 stepchildren), 2,047 grandchildren, 1,292 brothers or sisters, 1,684 parents, foster children, 1,958 other relatives, 3,072 non-relatives
- In nonfamily households: 15,072 (5,408 male householders (3,984 living alone)), 6,402 female householders (5,443 living alone)), 3,262 nonrelatives
- In group quarters: 642 (512 institutionalized population)
23,015 married couples with children.
2,825 single-parent households (735 men, 2,090 women).
96.4% of residents of Silver City speak English at home.
2.6% of residents speak Spanish at home (44% speak English very well, 18% speak English well, 37% speak English not well).
1.0% of residents speak other Indo-European language at home (80% speak English very well, 20% speak English well).
Foreign born population: 1,246 (4.8%)
(0.0% of them are naturalized citizens)
| Here: | 6.7 |
| State: | 6.8 |
| Here: | 6.8 |
| State: | 4.6 |
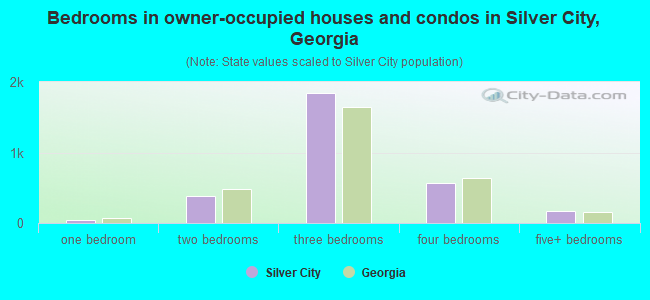
- Bedrooms in owner-occupied houses and condos in Silver City, Georgia
- 9no bedroom
- 381 bedroom
- 3792 bedrooms
- 1,8373 bedrooms
- 5614 bedrooms
- 1735+ bedrooms
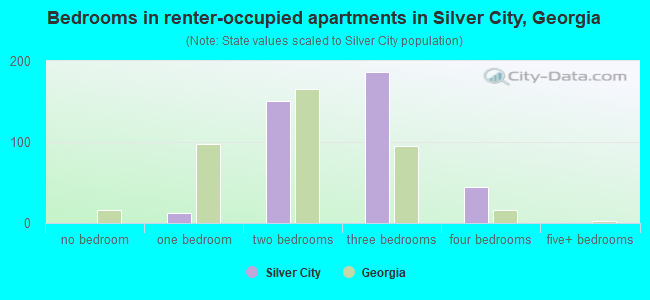
- Bedrooms in renter-occupied apartments in Silver City, Georgia
- 0no bedroom
- 121 bedroom
- 1502 bedrooms
- 1863 bedrooms
- 444 bedrooms
- 05+ bedrooms
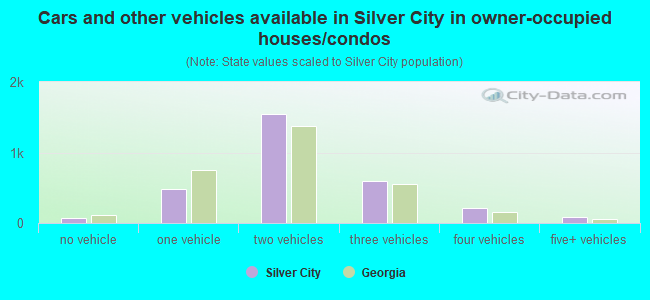
- Cars and other vehicles available in Silver City in owner-occupied houses/condos
- 66no vehicle
- 4871 vehicle
- 1,5492 vehicles
- 5893 vehicles
- 2194 vehicles
- 875+ vehicles
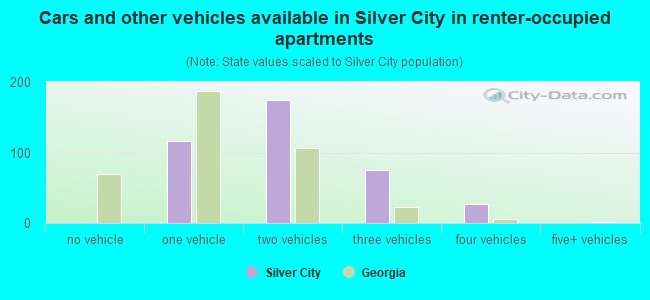
- Cars and other vehicles available in Silver City in renter-occupied apartments
- 0no vehicle
- 1161 vehicle
- 1742 vehicles
- 753 vehicles
- 274 vehicles
- 05+ vehicles
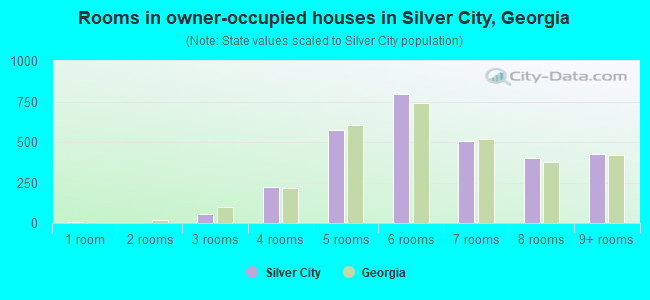
- Rooms in owner-occupied houses in Silver City, Georgia
- 91 room
- 02 rooms
- 553 rooms
- 2254 rooms
- 5745 rooms
- 7996 rooms
- 5047 rooms
- 4038 rooms
- 4289+ rooms
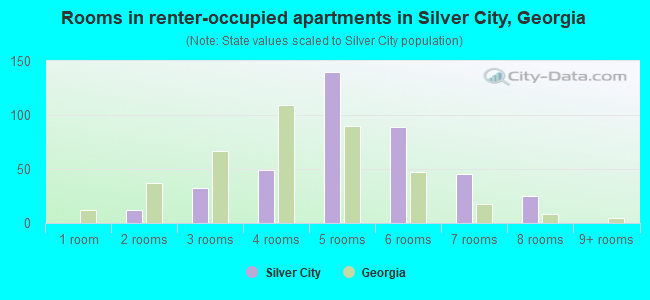
- Rooms in renter-occupied apartments in Silver City, Georgia
- 01 room
- 122 rooms
- 323 rooms
- 494 rooms
- 1405 rooms
- 896 rooms
- 457 rooms
- 258 rooms
- 09+ rooms
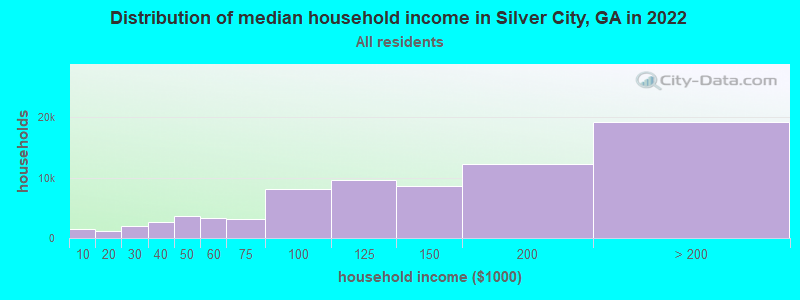
Silver City, GA household income distribution

- 1,416Less than $10,000
- 1,172$10,000 to $19,999
- 1,941$20,000 to $29,999
- 2,640$30,000 to $39,999
- 3,608$40,000 to $49,999
- 3,390$50,000 to $59,999
- 3,207$60,000 to $74,999
- 8,167$75,000 to $99,999
- 9,594$100,000 to $124,999
- 8,611$125,000 to $149,999
- 12,249$150,000 to $199,999
- 19,210$200,000 or more
Percentage of workers working in this county: 79.4%
Number of people working at home: 4,604 (33.9% of all workers)
Travel time to work (commute)
- Less than 5 minutes: 32
- 5 to 9 minutes: 167
- 10 to 14 minutes: 633
- 15 to 19 minutes: 772
- 20 to 24 minutes: 556
- 25 to 29 minutes: 213
- 30 to 34 minutes: 811
- 35 to 39 minutes: 266
- 40 to 44 minutes: 253
- 45 to 59 minutes: 571
- 60 to 89 minutes: 513
- 90 or more minutes: 108
Means of transportation to work:
- Drove a car alone: 4,247 (83.2%)
- Carpooled: 608 (11.9%)
- Walked: 15 (0.3%)
- Other means: 25 (0.5%)
- Worked at home: 208 (4.1%)
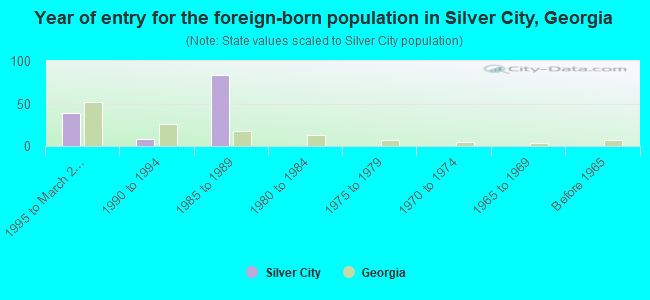
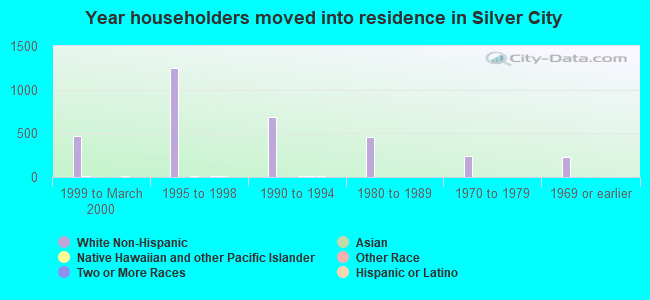
- Year of entry for the foreign-born population in Silver City, Georgia
- 391995 to March 2000
- 81990 to 1994
- 831985 to 1989
- 01980 to 1984
- 01975 to 1979
- 01970 to 1974
- 01965 to 1969
- 0Before 1965
Most common places of birth for foreign-born residents (%):
| Silver City: | 25.4% (33) |
| Georgia: | 4.8% (27,834) |
| Silver City: | 24.6% (32) |
| Georgia: | 0.2% (1,401) |
| Silver City: | 23.1% (30) |
| Georgia: | 0.5% (2,611) |
| Silver City: | 13.8% (18) |
| Georgia: | 3.3% (19,039) |
| Silver City: | 6.9% (9) |
| Georgia: | 2.9% (16,457) |
| Silver City: | 6.2% (8) |
| Georgia: | 0.6% (3,712) |
Place of birth for U.S.-born residents:
- This state: 6,081
- Other state: 3,284
- Northeast: 572
- Midwest: 672
- South: 1,746
- West: 294
51% of Silver City residents lived in the same house 5 years ago.
Out of people who lived in different houses, 30% lived in this county.
Out of people who lived in different counties, 57% lived in Georgia.
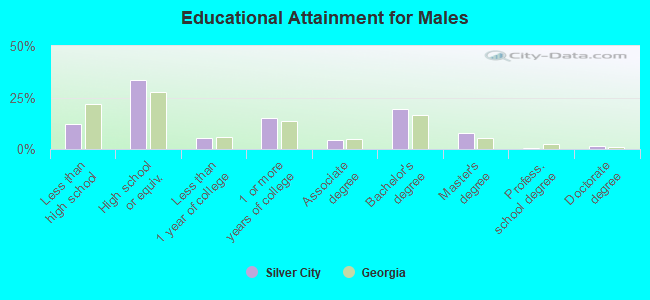
Education attainment for males 25 years and older:
- No schooling: 18
- Nursery to 4th grade: 0
- 5th and 6th grade: 29
- 7th and 8th grade: 69
- 9th grade: 97
- 10th grade: 77
- 11th grade: 37
- 12th grade, no diploma: 67
- High school graduate (or equivalency): 1,074
- Less than 1 year of college: 178
- Some college more than 1 year, no degree: 488
- Associate degree: 142
- Bachelor's degree: 620
- Master's degree: 254
- Professional school degree: 9
- Doctorate degree: 47
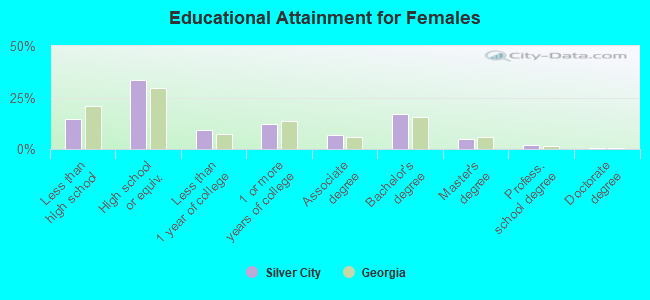
Education attainment for females 25 years and older:
- No schooling: 10
- Nursery to 4th grade: 0
- 5th and 6th grade: 29
- 7th and 8th grade: 127
- 9th grade: 77
- 10th grade: 60
- 11th grade: 101
- 12th grade, no diploma: 51
- High school graduate (or equivalency): 1,037
- Less than 1 year of college: 287
- Some college more than 1 year, no degree: 380
- Associate degree: 209
- Bachelor's degree: 523
- Master's degree: 151
- Professional school degree: 53
- Doctorate degree: 9
Housing units in structures:
- One, detached: 3,056
- Mobile homes: 480
- Boats, RVs, vans, etc.: 9
Median worth of mobile homes: $103,058
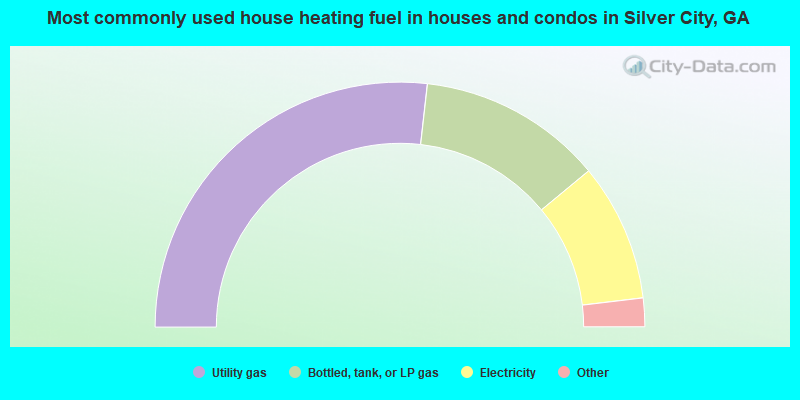
- 53.6%Utility gas
- 24.4%Bottled, tank, or LP gas
- 18.2%Electricity
- 2.5%Fuel oil, kerosene, etc.
- 1.3%Wood
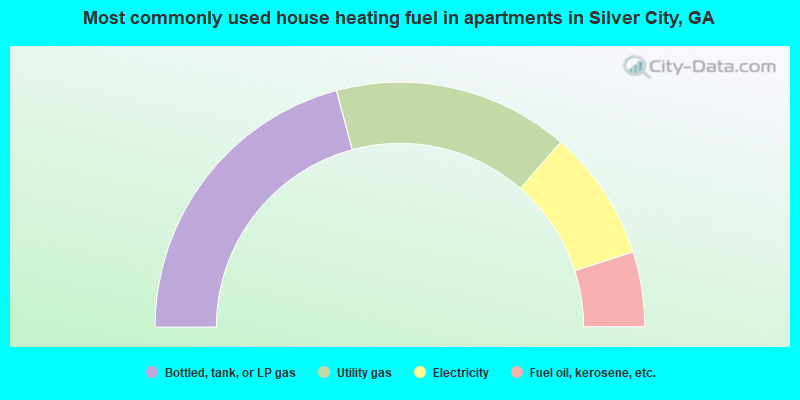
- 41.6%Bottled, tank, or LP gas
- 31.1%Utility gas
- 17.3%Electricity
- 9.9%Fuel oil, kerosene, etc.
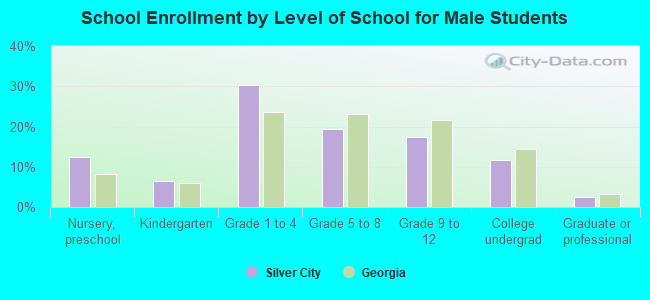
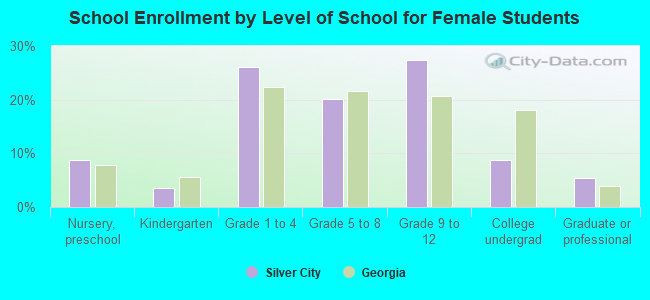
Private vs. public school enrollment:
| Here: | 9.6% |
| Georgia: | 8.4% |
| Here: | 4.5% |
| Georgia: | 8.5% |
| Here: | 17.0% |
| Georgia: | 22.9% |