Somerton, AZ (Arizona) Houses and Residents
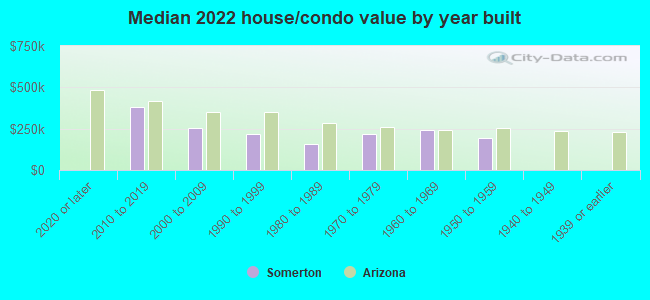
| Somerton: | $252,132 |
| Arizona: | $402,800 |
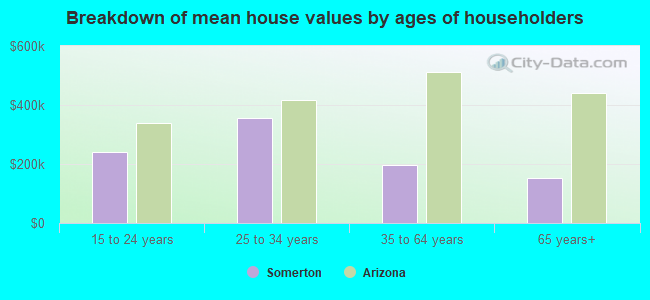
Mean price in 2022:
Detached houses: $189,088
Here: $189,088 State: $521,408 Mobile homes: $28,100
Here: $28,100 State: $141,516
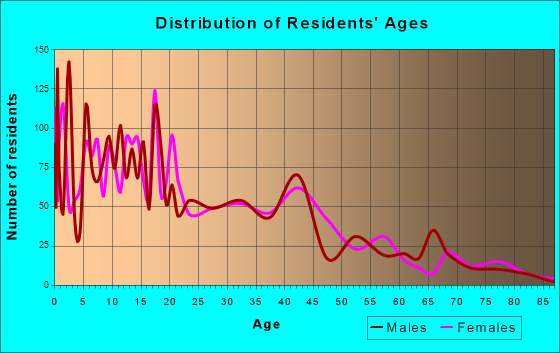
Total population: 14,912 (Urban population: 7,255 (all inside urban clusters), Rural population: 0)
Houses: 4,634 (4,468 occupied: 3,370 owner occupied, 1,333 renter occupied)
| % of renters here: | 28% |
| State: | 33% |
Housing density: 3,497 houses/condos per square mile
Median price asked for vacant for-sale houses and condos in 2022: $615,482.
Median contract rent in 2022: $799 (lower quartile is $368, upper quartile is $938)
Median rent asked for vacant for-rent units in 2022: $4,112
Median gross rent in Somerton, AZ in 2022: $895
Housing units in Somerton with a mortgage: 2,311 (64 second mortgage, 0 home equity loan, 56 both second mortgage and home equity loan)
Houses without a mortgage: 0
Median household income for houses/condos with a mortgage: $76,373
Median household income for apartments without a mortgage: $44,328
Median monthly housing costs: $947
Compare current foreclosures near Somerton, AZ:
| Photo | Address | Area | Beds / Baths | Price | Details |
|---|---|---|---|---|---|

|
#1
W Fresno St
Somerton, AZ 85350
|
1,326 sq. feet
|
2 baths 3 beds |
show details | |

|
#2
N Andrea Ave
Somerton, AZ 85350
|
1,201 sq. feet
|
2 baths 3 beds |
show details | |

|
#3
S Sunset Ave
Somerton, AZ 85350
|
1,017 sq. feet
|
- baths 3 beds |
show details | |

|
#4
S Avenue A 1/2
Somerton, AZ 85350
|
- sq. feet
|
- baths - beds |
show details | |

|
#5
E Hoyos St
Somerton, AZ 85350
|
- sq. feet
|
- baths - beds |
show details | |

|
#6
N Bingham Ave Apt K
Somerton, AZ 85350
|
- sq. feet
|
- baths - beds |
show details | |

|
#7
N Jennifer Ave
Somerton, AZ 85350
|
- sq. feet
|
- baths - beds |
show details | |

|
#8
N Van Brunt Ave
Somerton, AZ 85350
|
- sq. feet
|
- baths - beds |
show details | |

|
#9
E Blanca St
Somerton, AZ 85350
|
- sq. feet
|
- baths - beds |
show details | |

|
#10
W County 17 1/2 St
Somerton, AZ 85350
|
- sq. feet
|
- baths - beds |
show details |
| Photo | Address | Area | Beds / Baths | Price | Details |
|---|---|---|---|---|---|

|
#11
W Rosewood Dr
Yuma, AZ 85364
|
1,336 sq. feet
|
1 baths 3 beds |
show details | |

|
#12
E Rolish Street
San Luis, AZ 85349
|
1,232 sq. feet
|
2 baths 3 beds |
show details | |

|
#13
E Arena St
Gadsden, AZ 85336
|
- sq. feet
|
2 baths 3 beds |
show details | |

|
#14
E Edna Lopez Ct.
Gadsden, AZ 85336
|
1,494 sq. feet
|
2 baths 3 beds |
show details | |

|
#15
West 10th Lane
Yuma, AZ 85364
|
- sq. feet
|
2 baths 3 beds |
show details | |

|
#16
E Hoyos St
San Luis, AZ 85349
|
- sq. feet
|
2 baths 3 beds |
show details | |

|
#17
S Coconino Ln
Yuma, AZ 85364
|
1,008 sq. feet
|
1 baths 5 beds |
show details | |

|
#18
N Frank Sandoval Ct
San Luis, AZ 85349
|
1,301 sq. feet
|
2 baths 3 beds |
show details | |

|
#19
S 47th Ave
Yuma, AZ 85364
|
1,735 sq. feet
|
2 baths 4 beds |
show details | |

|
#20
W 18th St
Yuma, AZ 85364
|
1,918 sq. feet
|
2 baths 3 beds |
show details |
| Photo | Address | Area | Beds / Baths | Price | Details |
|---|---|---|---|---|---|

|
#21
E San Marcos St
San Luis, AZ 85349
|
- sq. feet
|
2 baths 3 beds |
show details | |

|
#22
North Rio Seco Street
San Luis, AZ 85349
|
989 sq. feet
|
1 baths 2 beds |
show details | |

|
#23
S 8th Ave
Yuma, AZ 85364
|
1,436 sq. feet
|
1 baths 2 beds |
show details | |

|
#24
S Barbara Ave
Yuma, AZ 85365
|
- sq. feet
|
1 baths 3 beds |
show details | |

|
#25
S 12th Ave
Yuma, AZ 85364
|
914 sq. feet
|
1 baths 3 beds |
show details | |

|
#26
E San Marcos Dr
Yuma, AZ 85365
|
1,900 sq. feet
|
2 baths 3 beds |
show details | |

|
#27
S 23rd Ave
Yuma, AZ 85364
|
1,263 sq. feet
|
2 baths 4 beds |
show details | |

|
#28
W 21st Ln
Yuma, AZ 85364
|
1,089 sq. feet
|
2 baths 3 beds |
show details | |

|
#29
S Madison Ave
Yuma, AZ 85364
|
1,344 sq. feet
|
1 baths 3 beds |
show details | |

|
#30
W 1st St
Yuma, AZ 85364
|
1,240 sq. feet
|
2 baths 3 beds |
show details |
| Photo | Address | Area | Beds / Baths | Price | Details |
|---|---|---|---|---|---|

|
#31
N 8th Ave
Yuma, AZ 85364
|
- sq. feet
|
2 baths 3 beds |
show details | |

|
#32
South Desert Willow Way
Yuma, AZ 85365
|
1,307 sq. feet
|
2 baths 4 beds |
show details | |

|
#33
S Hummingbird Ln
Yuma, AZ 85365
|
1,056 sq. feet
|
2 baths 3 beds |
show details | |

|
#34
Puestas Del Sol Ave
Yuma, AZ 85365
|
- sq. feet
|
2 baths 3 beds |
show details | |

|
#35
S Puesta Del Sol Ave
Yuma, AZ 85365
|
1,280 sq. feet
|
2 baths 3 beds |
show details | |

|
#36
S Recker Avenue
Yuma, AZ 85365
|
- sq. feet
|
2 baths 3 beds |
show details | |

|
#37
E County 16th St
Yuma, AZ 85365
|
4,565 sq. feet
|
4 baths 4 beds |
show details | |

|
#38
E 36th St
Yuma, AZ 85367
|
1,659 sq. feet
|
3 baths 4 beds |
show details | |

|
#39
North De La Vara Ave
San Luis, AZ 85349
|
- sq. feet
|
2 baths 3 beds |
show details | |

|
#40
S 34th Dr
Yuma, AZ 85364
|
2,857 sq. feet
|
3 baths 5 beds |
show details |
| Photo | Address | Area | Beds / Baths | Price | Details |
|---|---|---|---|---|---|

|
#41
W 20th Pl
Yuma, AZ 85364
|
972 sq. feet
|
2 baths 3 beds |
show details | |

|
#42
S 42nd Way
Yuma, AZ 85364
|
2,302 sq. feet
|
3 baths 4 beds |
show details | |

|
#43
W 29th Ln
Yuma, AZ 85364
|
1,601 sq. feet
|
2 baths 3 beds |
show details | |

|
#44
S 17th Ave
Yuma, AZ 85364
|
1,385 sq. feet
|
2 baths 3 beds |
show details | |

|
#45
S 46th Way
Yuma, AZ 85364
|
1,259 sq. feet
|
2 baths - beds |
show details | |

|
#46
W 4th St
Yuma, AZ 85364
|
- sq. feet
|
2 baths 4 beds |
show details | |

|
#47
S 34th Dr
Yuma, AZ 85364
|
2,159 sq. feet
|
- baths - beds |
show details | |

|
#48
S 44th Trl
Yuma, AZ 85364
|
- sq. feet
|
- baths - beds |
show details | |

|
#49
N 8th Ave
Yuma, AZ 85364
|
- sq. feet
|
- baths - beds |
show details | |

|
Check over 1 million property listings on Foreclosure.com!
|
browse all offers | |||

Latest news about housing in Somerton, AZ collected exclusively by city-data.com from local newspapers, TV, and radio stations

 | San Luis, AZ vs Yuma, AZ (5 replies) |
| How is yuma? (82 replies) |
| Bisbee and Sommerton (Yuma) (19 replies) |
| Somerton School District (1 reply) |
| Moving to Yuma - where is safe? (11 replies) |
| Snowbirds and Yuma (19 replies) |
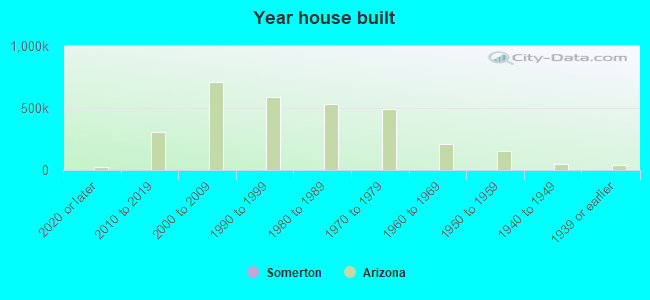
Median year apartment built: 1999
Household type by relationship:
Households: 14,520- Male householders: 1,996 (139 living alone), Female householders: 2,422 (371 living alone)
2,512 spouses (2,512 opposite-sex spouses), 255 unmarried partners, (255 opposite-sex unmarried partners), 5,322 children (5,023 natural, 26 adopted, 272 stepchildren), 665 grandchildren, 352 brothers or sisters, 357 parents, 0 foster children, 482 other relatives, 151 non-relatives
- In group quarters: 1
Size of family households: 1,171 2-persons, 757 3-persons, 789 4-persons, 585 5-persons, 419 6-persons, 305 7-or-more-persons.
Size of nonfamily households: 569 1-person, 26 2-persons.
2,165 married couples with children.
986 single-parent households (345 men, 641 women).
19.2% of residents of Somerton speak English at home.
81.1% of residents speak Spanish at home (67% speak English very well, 5% speak English well, 13% speak English not well, 15% don't speak English at all).
Foreign born population: 5,521 (38.0%)
(53.4% of them are naturalized citizens)
| Here: | 5.5 |
| State: | 6.0 |
| Here: | 4.5 |
| State: | 4.1 |
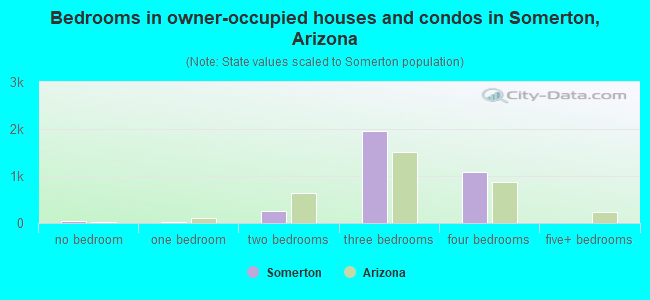
- Bedrooms in owner-occupied houses and condos in Somerton, Arizona
- 32no bedroom
- 261 bedroom
- 2572 bedrooms
- 1,9683 bedrooms
- 1,0874 bedrooms
- 05+ bedrooms
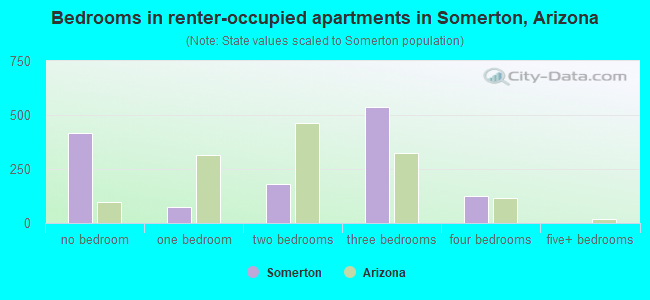
- Bedrooms in renter-occupied apartments in Somerton, Arizona
- 416no bedroom
- 751 bedroom
- 1802 bedrooms
- 5373 bedrooms
- 1274 bedrooms
- 05+ bedrooms
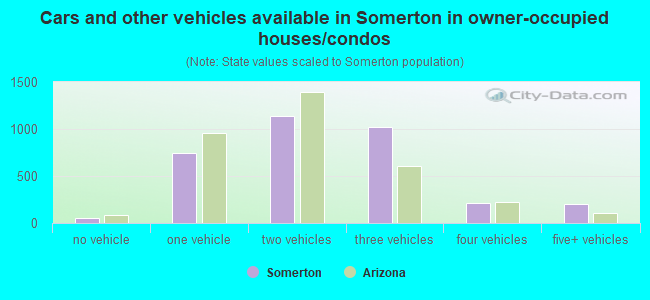
- Cars and other vehicles available in Somerton in owner-occupied houses/condos
- 54no vehicle
- 7401 vehicle
- 1,1342 vehicles
- 1,0223 vehicles
- 2174 vehicles
- 2055+ vehicles
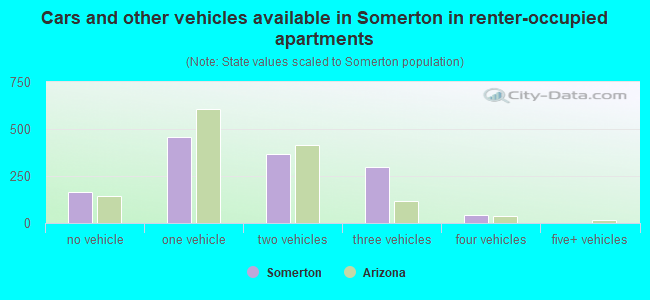
- Cars and other vehicles available in Somerton in renter-occupied apartments
- 166no vehicle
- 4581 vehicle
- 3682 vehicles
- 2983 vehicles
- 444 vehicles
- 05+ vehicles
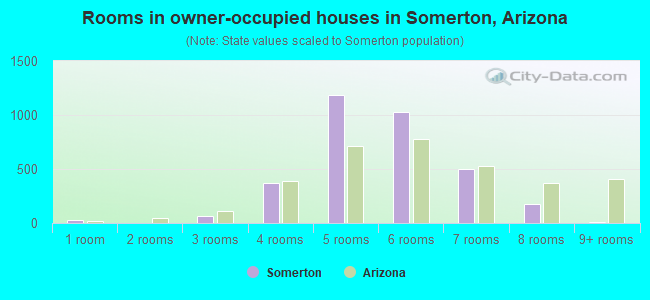
- Rooms in owner-occupied houses in Somerton, Arizona
- 321 room
- 02 rooms
- 623 rooms
- 3744 rooms
- 1,1875 rooms
- 1,0296 rooms
- 5027 rooms
- 1738 rooms
- 129+ rooms
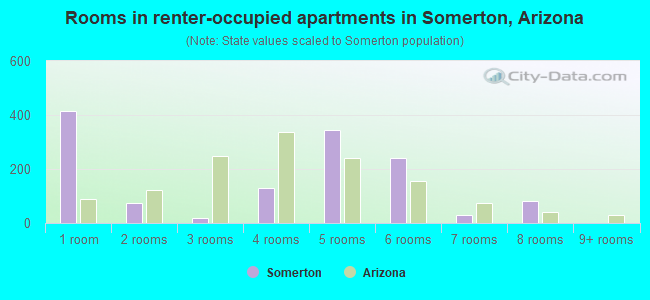
- Rooms in renter-occupied apartments in Somerton, Arizona
- 4161 room
- 752 rooms
- 183 rooms
- 1284 rooms
- 3435 rooms
- 2416 rooms
- 307 rooms
- 828 rooms
- 09+ rooms
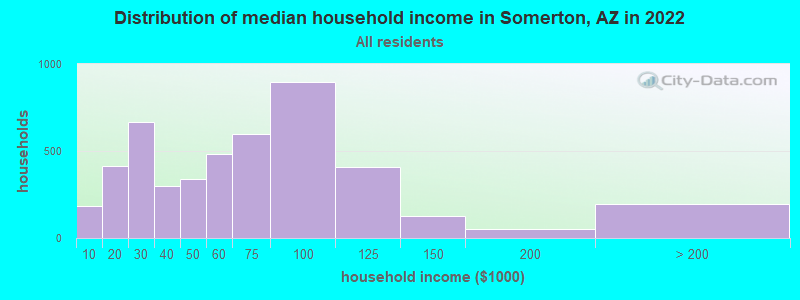
Somerton, AZ household income distribution

- 183Less than $10,000
- 416$10,000 to $19,999
- 668$20,000 to $29,999
- 296$30,000 to $39,999
- 338$40,000 to $49,999
- 482$50,000 to $59,999
- 597$60,000 to $74,999
- 895$75,000 to $99,999
- 406$100,000 to $124,999
- 125$125,000 to $149,999
- 52$150,000 to $199,999
- 195$200,000 or more
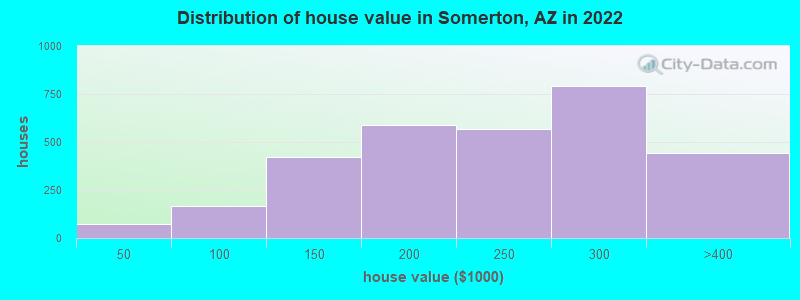
Home value of owner - occupied houses in 2022 in Somerton, AZ
-
- 27$10,000 to $14,999
- 29$15,000 to $19,999
- 17$35,000 to $39,999
- 92$50,000 to $59,999
- 18$60,000 to $69,999
- 21$80,000 to $89,999
- 32$90,000 to $99,999
- 126$100,000 to $124,999
- 295$125,000 to $149,999
- 291$150,000 to $174,999
- 297$175,000 to $199,999
- 567$200,000 to $249,999
- 793$250,000 to $299,999
- 442$300,000 to $399,999
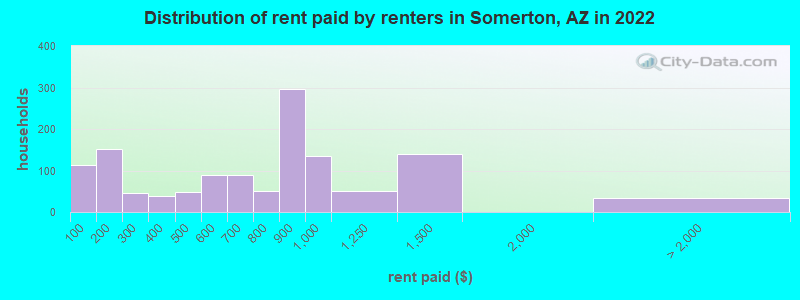
Rent paid by renters in 2022 in Somerton, AZ
-
- 113Less than $100
- 151$150 to $199
- 19$200 to $249
- 25$250 to $299
- 13$300 to $349
- 26$350 to $399
- 30$400 to $449
- 19$450 to $499
- 36$500 to $549
- 51$550 to $599
- 36$600 to $649
- 53$650 to $699
- 49$750 to $799
- 296$800 to $899
- 135$900 to $999
- 49$1,000 to $1,249
- 139$1,250 to $1,499
- 33No cash rent
Percentage of workers working in this county: 90.0%
Number of people working at home: 226 (3.7% of all workers)
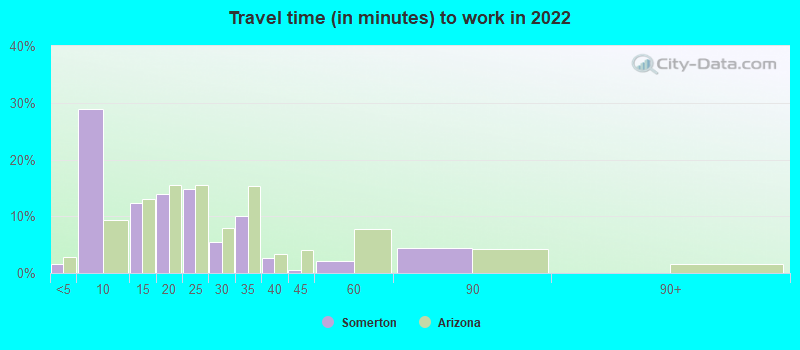
Travel time to work (commute)
- Less than 5 minutes: 50
- 5 to 9 minutes: 855
- 10 to 14 minutes: 281
- 15 to 19 minutes: 897
- 20 to 24 minutes: 1,116
- 25 to 29 minutes: 228
- 30 to 34 minutes: 1,497
- 35 to 39 minutes: 211
- 40 to 44 minutes: 106
- 45 to 59 minutes: 45
- 60 to 89 minutes: 219
- 90 or more minutes: 30
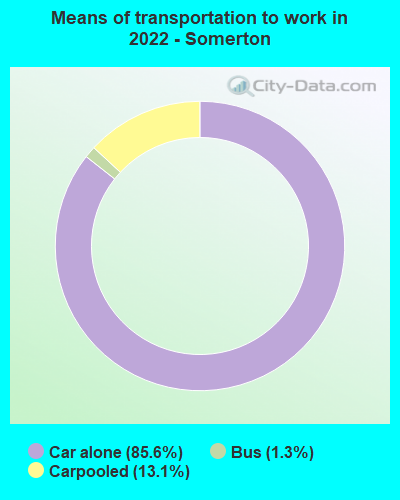
Means of transportation to work:
- Drove a car alone: 1,949 (75.0%)
- Carpooled: 312 (12.0%)
- Bus: 19 (0.7%)
- Walked: 1 (0.0%)
- Worked at home: 226 (8.7%)
- Unemployment by race in 2022
- Unemployment rate for White non-Hispanic residents
- 0.6%Males
- 1.9%Females
- Unemployment rate for other race residents
- 12.9%Males
- 18.2%Females
- Unemployment rate for two or more race residents
- 3.1%Males
- 1.5%Females
- Unemployment rate for Hispanic or Latino residents
- 4.1%Males
- 4.6%Females
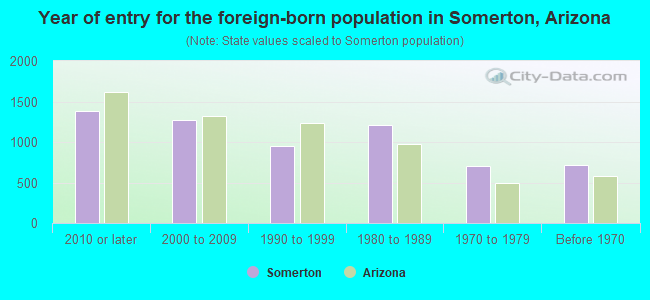
- Year of entry for the foreign-born population in Somerton, Arizona
- 1,3792010 or later
- 1,2712000 to 2009
- 9521990 to 1999
- 1,2061980 to 1989
- 7061970 to 1979
- 710Before 1970
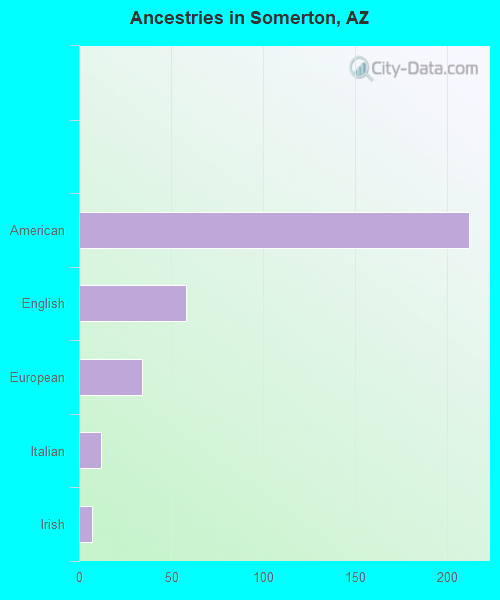
First ancestries reported:
- American: 212 (1.6%)
- English: 58 (0.5%)
- European: 34 (0.3%)
- Italian: 12 (0.09%)
- Irish: 7 (0.05%)
- Scottish: 1 (0.01%)
Most common places of birth for foreign-born residents (%):
| Somerton: | 94.9% (5,273) |
| Arizona: | 53.4% (500,086) |
Place of birth for U.S.-born residents:
- This state: 7,089
- Other state: 1,570
- Northeast: 61
- Midwest: 83
- South: 149
- West: 1,276
93.9% of Somerton residents lived in the same house 1 years ago.
Out of people who lived in different houses, 38.2% lived in this county.
Out of people who lived in different counties, 24.5% lived in Arizona.
| Somerton: | 93.9% |
| State average: | 86.0% |
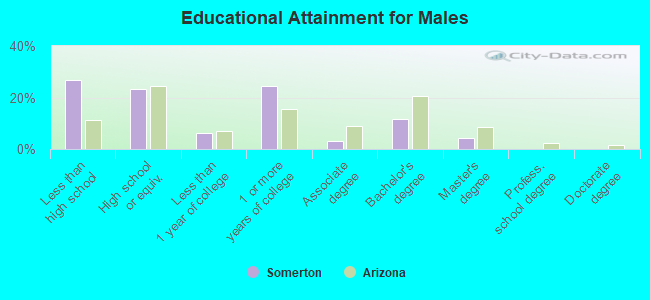
Education attainment for males 25 years and older:
- No schooling: 352
- Nursery to 4th grade: 69
- 5th and 6th grade: 142
- 7th and 8th grade: 111
- 9th grade: 137
- 10th grade: 109
- 11th grade: 61
- 12th grade, no diploma: 103
- High school graduate (or equivalency): 936
- Less than 1 year of college: 253
- Some college more than 1 year, no degree: 987
- Associate degree: 130
- Bachelor's degree: 470
- Master's degree: 167
- Professional school degree: 0
- Doctorate degree: 0
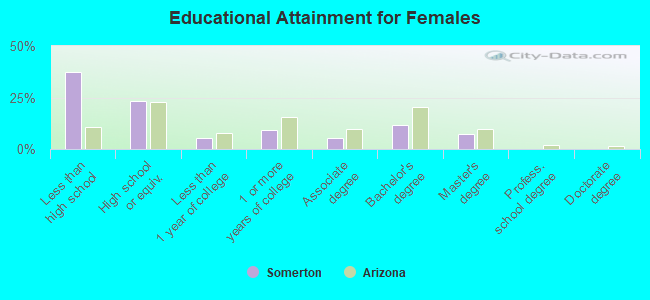
Education attainment for females 25 years and older:
- No schooling: 268
- Nursery to 4th grade: 111
- 5th and 6th grade: 285
- 7th and 8th grade: 81
- 9th grade: 626
- 10th grade: 13
- 11th grade: 206
- 12th grade, no diploma: 69
- High school graduate (or equivalency): 1,042
- Less than 1 year of college: 243
- Some college more than 1 year, no degree: 417
- Associate degree: 246
- Bachelor's degree: 522
- Master's degree: 333
- Professional school degree: 0
- Doctorate degree: 0
Housing units in structures:
- One, detached: 3,761
- One, attached: 20
- Two: 75
- 3 or 4: 442
- 5 to 9: 74
- 10 to 19: 45
- Mobile homes: 215
Median worth of mobile homes: $63,788
Housing units lacking complete kitchen facilities in 2022: 1.7%
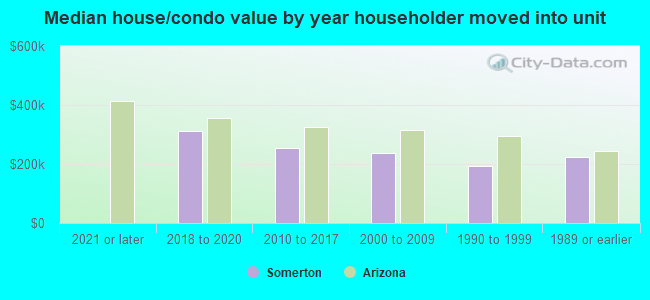
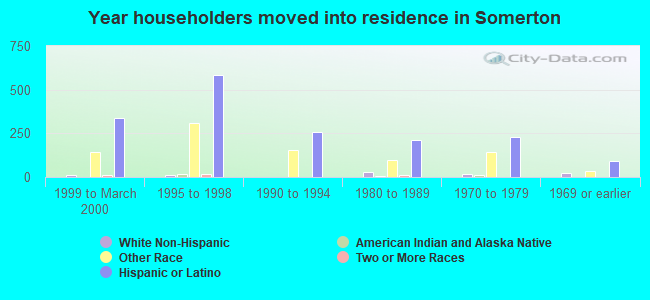
House/condo owner moved in on average 11 years ago
Renter moved in on average 4 years ago
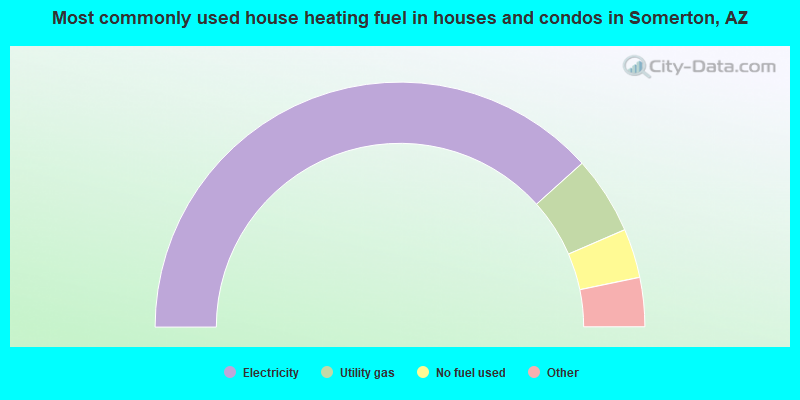
- 76.7%Electricity
- 10.3%Utility gas
- 6.5%No fuel used
- 2.7%Bottled, tank, or LP gas
- 2.4%Other fuel
- 1.3%Solar energy
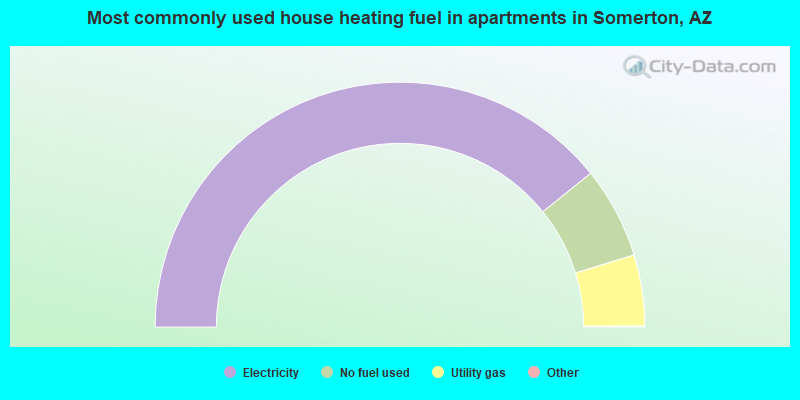
- 78.5%Electricity
- 12.1%No fuel used
- 9.4%Utility gas
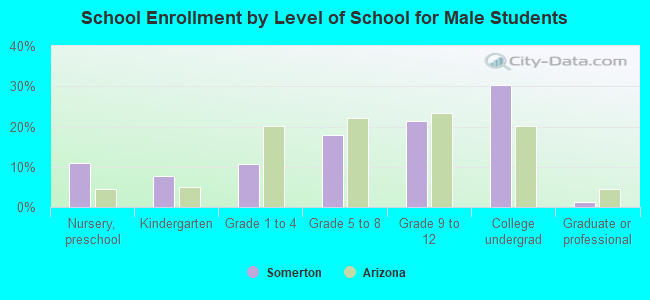
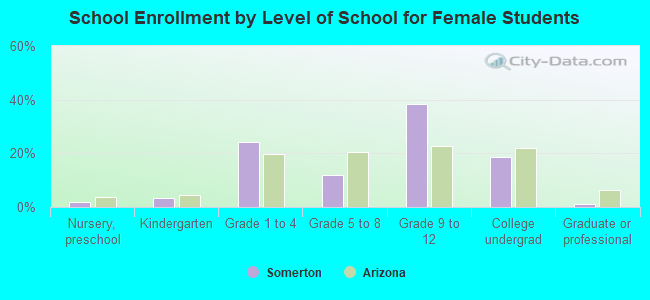
Private vs. public school enrollment:
| Here: | 1.1% |
| Arizona: | 10.4% |
| Here: | 2.3% |
| Arizona: | 8.8% |
| Here: | 1.8% |
| Arizona: | 13.1% |