South Amboy, NJ (New Jersey) Houses and Residents
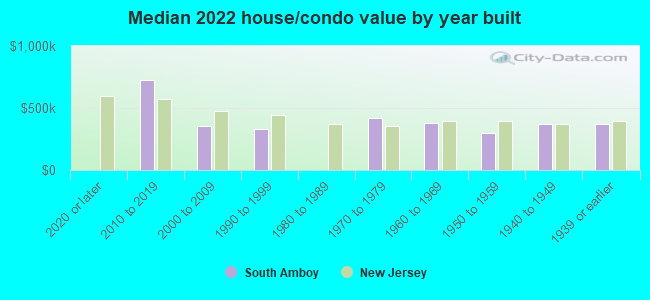
Estimated median house or condo value in 2022: $369,925 (it was $140,500 in 2000 )
South Amboy:
$369,925New Jersey:
$428,900
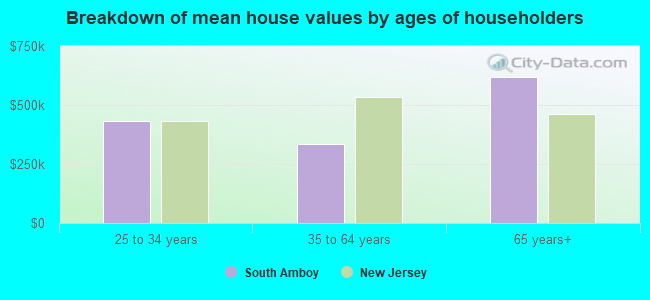
Lower value quartile - upper value quartile: $318,458 - $423,619Mean price in 2022: Detached houses: $364,792 Here:
$364,792State:
$537,591
Townhouses or other attached units: $628,870 Here:
$628,870State:
$381,113
In 2-unit structures: $192,947 Here:
$192,947State:
$444,476
In 3-to-4-unit structures: $422,881 Here:
$422,881State:
$457,463
In 5-or-more-unit structures: $210,107 Here:
$210,107State:
$368,745
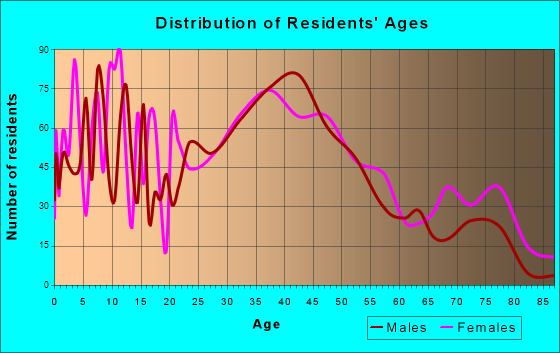
Total population: 8,853 (Urban population: 7,913, Rural population: 0)
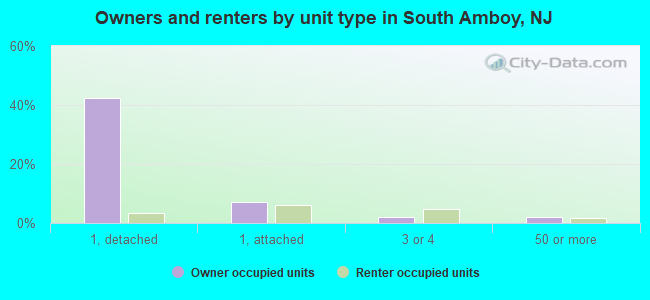
Houses: 4,290 (4,063 occupied: 2,211 owner occupied, 1,885 renter occupied )
% of renters here:
46%State:
35%
Housing density: 2,766 houses/condos per square mile
Median price asked for vacant for-sale houses and condos in 2022: $549,467.
Median contract rent in 2022: $1,530 (lower quartile is $849, upper quartile is $1,884)
Median rent asked for vacant for-rent units in 2022: $2,036
Median gross rent in South Amboy, NJ in 2022: $1,590
Housing units in South Amboy with a mortgage: 1,351 (158 second mortgage, 12 home equity loan, 112 both second mortgage and home equity loan )Houses without a mortgage: 94
Median household income for houses/condos with a mortgage: $126,100
Median household income for apartments without a mortgage: $70,142
Median monthly housing costs: $1,758
Data:
Median house or condo value ($)
Median house or condo value ($ change since 2000)
Median house or condo value ($) - White
Median house or condo value ($) - Black or African American
Median house or condo value ($) - Asian
Median house or condo value ($) - Hispanic or Latino
Median house or condo value ($) - American Indian and Alaska Native
Median house or condo value ($) - Multirace
Median house or condo value ($) - Other Race
Median price asked for mobile homes ($)
Household density (households per square mile)
Mean house or condo value by units in structure - 1, detached ($)
Mean house or condo value by units in structure - 1, attached ($)
Mean house or condo value by units in structure - 2 ($)
Mean house or condo value by units in structure by units in structure - 3 or 4 ($)
Mean house or condo value by units in structure - 5 or more ($)
Mean house or condo value by units in structure - Boat, RV, van, etc. ($)
Mean house or condo value by units in structure - Mobile home ($)
Median contract rent ($)
Median contract rent - Lower quartile ($)
Median contract rent - Upper quartile ($)
Median gross rent ($)
Urban houses (%)
Rural houses (%)
Houses occupied (%)
Houses occupied (% change since 2000)
Houses owner occupied (%)
Houses owner occupied (% change since 2000)
Houses renter occupied (%)
Houses renter occupied (% change since 2000)
Vacant housing units - For rent (%)
Vacant housing units - For rent (% change since 2000)
Vacant housing units - For sale only (%)
Vacant housing units - For sale only (% change since 2000)
Vacant housing units - Rented or sold, not occupied (%)
Vacant housing units - Rented or sold, not occupied (% change since 2000)
Vacant housing units - For seasonal, recreational, or occasional use (%)
Vacant housing units - For seasonal, recreational, or occasional use (% change since 2000)
Vacant housing units - For migrant workers (%)
Vacant housing units - For migrant workers (% change since 2000)
Vacant housing units - Other vacant (%)
Vacant housing units - Other vacant (% change since 2000)
Median monthly housing costs ($)
Median household income for houses/condos with a mortgage ($)
Median household income for houses/condos without a mortgage ($)
Median household income ($)
Median household income ($) - White
Median household income ($) - Black or African American
Median household income ($) - Asian
Median household income ($) - Hispanic or Latino
Median household income ($) - American Indian and Alaska Native
Median household income ($) - Multirace
Median household income ($) - Other Race
Mortgage status - with mortgage (%)
Mortgage status - with second mortgage (%)
Mortgage status - with home equity loan (%)
Mortgage status - with both second mortgage and home equity loan (%)
Mortgage status - without a mortgage (%)
Median year house/condo built
Median year apartment built
Household type by relationship - Male householder living alone (%)
Household type by relationship - Male householder not living alone (%)
Household type by relationship - Female householder living alone (%)
Household type by relationship - Female householder not living alone (%)
Household type by relationship - Opposite-Sex spouse (%)
Household type by relationship - Same-Sex spouse (%)
Household type by relationship - Opposite-Sex unmarried partner (%)
Household type by relationship - Same-Sex unmarried partner (%)
Household type by relationship - In group quarters (%)
Size of family households - 2-person household (%)
Size of family households - 3-person household (%)
Size of family households - 4-person household (%)
Size of family households - 5-person household (%)
Size of family households - 6-person household (%)
Size of family households - 7-or-more-person household (%)
Size of nonfamily households - 1-person household (%)
Size of nonfamily households - 2-person household (%)
Size of nonfamily households - 3-person household (%)
Size of nonfamily households - 4-person household (%)
Size of nonfamily households - 5-person household (%)
Size of nonfamily households - 6-person household (%)
Size of nonfamily households - 7-or-moreperson household (%)
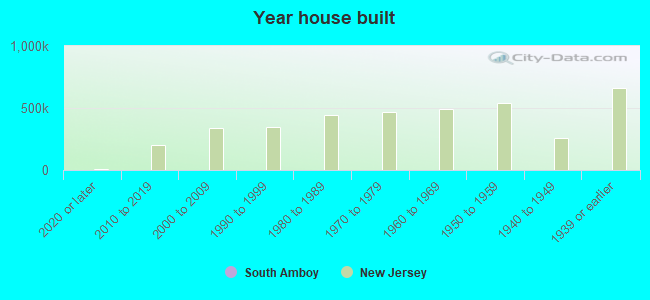
Year house built - Built 2010 or later (%)
Year house built - Built 2000 to 2009 (%)
Year house built - Built 1990 to 1999 (%)
Year house built - Built 1980 to 1989 (%)
Year house built - Built 1970 to 1979 (%)
Year house built - Built 1960 to 1969 (%)
Year house built - Built 1950 to 1959 (%)
Year house built - Built 1940 to 1949 (%)
Year house built - Built 1939 or earlier (%)
Median number of rooms in houses and condos
Median number of rooms in apartments
Median number of bedrooms in owner occupied houses
Mean number of bedrooms in owner occupied houses
Median number of bedrooms in renter occupied houses
Mean number of bedrooms in renter occupied houses
Median number of vehichles in owner occupied houses
Mean number of vehichles in owner occupied houses
Median number of vehichles in renter occupied houses
Mean number of vehichles in renter occupied houses
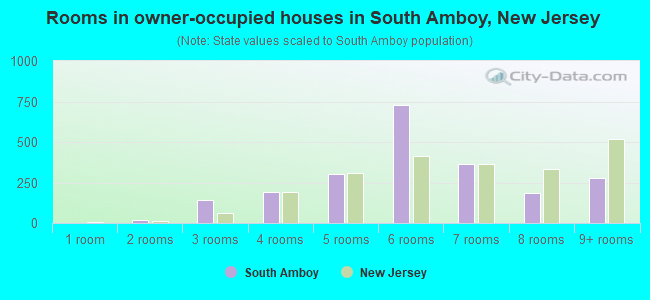
Rooms in owner-occupied houses - 1 room (%)
Rooms in owner-occupied houses - 2 rooms (%)
Rooms in owner-occupied houses - 3 rooms (%)
Rooms in owner-occupied houses - 4 rooms (%)
Rooms in owner-occupied houses - 5 rooms (%)
Rooms in owner-occupied houses - 6 rooms (%)
Rooms in owner-occupied houses - 7 rooms (%)
Rooms in owner-occupied houses - 8 rooms (%)
Rooms in owner-occupied houses - 9+ rooms (%)
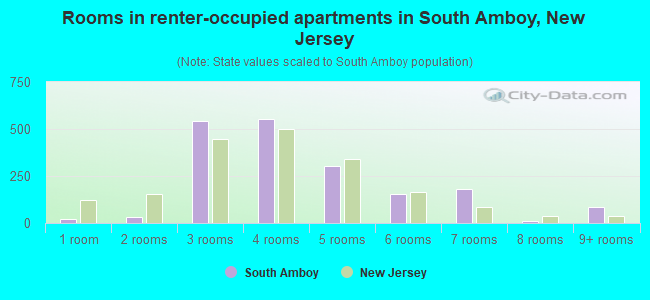
Rooms in renter-occupied houses - 1 room (%)
Rooms in renter-occupied houses - 2 rooms (%)
Rooms in renter-occupied houses - 3 rooms (%)
Rooms in renter-occupied houses - 4 rooms (%)
Rooms in renter-occupied houses - 5 rooms (%)
Rooms in renter-occupied houses - 6 rooms (%)
Rooms in renter-occupied houses - 7 rooms (%)
Rooms in renter-occupied houses - 8 rooms (%)
Rooms in renter-occupied houses - 9+ rooms (%)
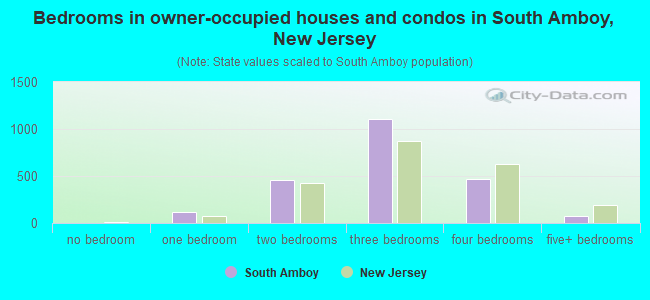
Bedrooms in owner-occupied houses - no bedrooms (%)
Bedrooms in owner-occupied houses - 1 bedroom (%)
Bedrooms in owner-occupied houses - 2 bedrooms (%)
Bedrooms in owner-occupied houses - 3 bedrooms (%)
Bedrooms in owner-occupied houses - 4 bedrooms (%)
Bedrooms in owner-occupied houses - 5+ bedrooms (%)
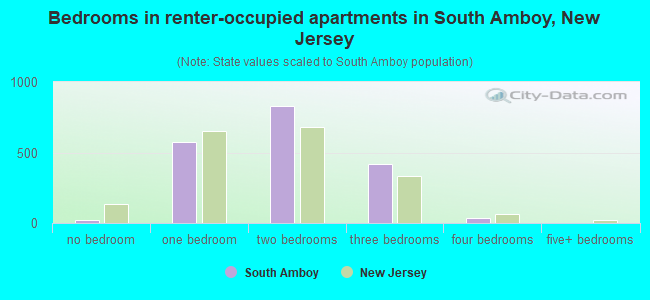
Bedrooms in renter-occupied houses - no bedrooms (%)
Bedrooms in renter-occupied houses - 1 bedroom (%)
Bedrooms in renter-occupied houses - 2 bedrooms (%)
Bedrooms in renter-occupied houses - 3 bedrooms (%)
Bedrooms in renter-occupied houses - 4 bedrooms (%)
Bedrooms in renter-occupied houses - 5+ bedrooms (%)
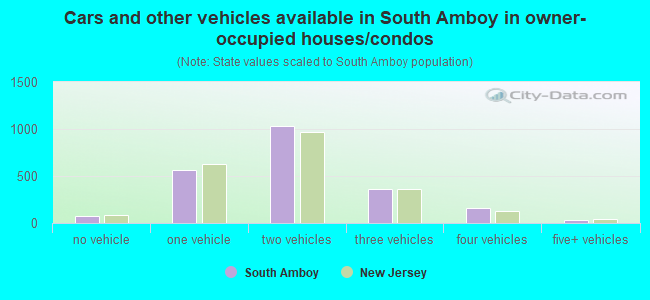
Vehicles available in owner-occupied houses - no vehicle available (%)
Vehicles available in owner-occupied houses - 1 vehicle available(%)
Vehicles available in owner-occupied houses - 2 Vehicles available (%)
Vehicles available in owner-occupied houses - 3 Vehicles available (%)
Vehicles available in owner-occupied houses - 4 Vehicles available (%)
Vehicles available in owner-occupied houses - 5+ Vehicles available (%)
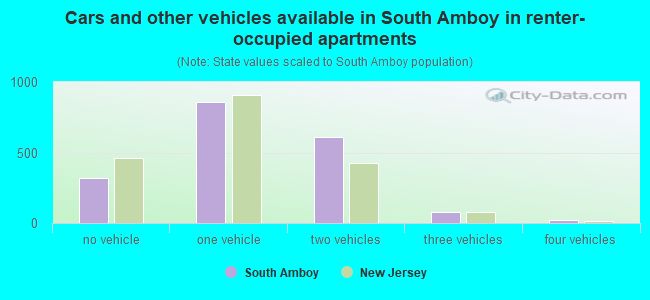
Vehicles available in renter-occupied houses - no vehicle available (%)
Vehicles available in renter-occupied houses - 1 vehicle available (%)
Vehicles available in renter-occupied houses - 2 Vehicles available (%)
Vehicles available in renter-occupied houses - 3 Vehicles available (%)
Vehicles available in renter-occupied houses - 4 Vehicles available (%)
Vehicles available in renter-occupied houses - 5+ Vehicles available (%)
Housing units in structures - 1, detached (%)
Housing units in structures - 1, attached (%)
Housing units in structures - 2 (%)
Housing units in structures - 3 or 4 (%)
Housing units in structures - 5 to 9 (%)
Housing units in structures - 10 to 19 (%)
Housing units in structures - 20 to 49 (%)
Housing units in structures - 50 or more (%)
Housing units in structures - Mobile home (%)
Housing units in structures - Boat, RV, van, etc. (%)
Housing units in structures - Owners - 1, detached (%)
Housing units in structures - Owners - 1, attached (%)
Housing units in structures - Owners - 2 (%)
Housing units in structures - Owners - 3 or 4 (%)
Housing units in structures - Owners - 5 to 9 (%)
Housing units in structures - Owners - 10 to 19 (%)
Housing units in structures - Owners - 20 to 49 (%)
Housing units in structures - Owners - 50 or more (%)
Housing units in structures - Owners - Mobile home (%)
Housing units in structures - Owners - Boat, RV, van, etc. (%)
Housing units in structures - Renters - 1, detached (%)
Housing units in structures - Renters - 1, attached (%)
Housing units in structures - Renters - 2 (%)
Housing units in structures - Renters - 3 or 4 (%)
Housing units in structures - Renters - 5 to 9 (%)
Housing units in structures - Renters - 10 to 19 (%)
Housing units in structures - Renters - 20 to 49 (%)
Housing units in structures - Renters - 50 or more (%)
Housing units in structures - Renters - Mobile home (%)
Housing units in structures - Renters - Boat, RV, van, etc. (%)
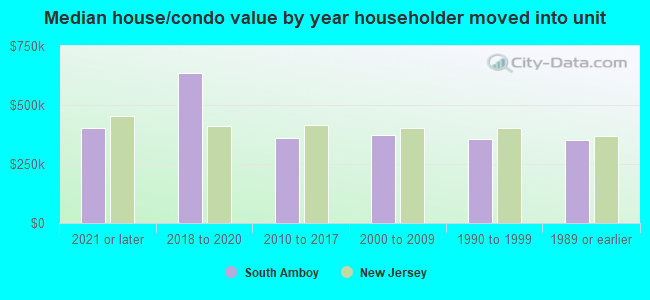
House/condo owner moved in on average (years ago)
Renter moved in on average (years ago)
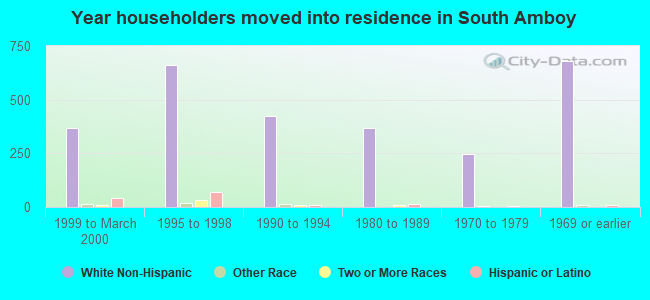
Year householder moved into unit - Moved in 1999 to March 2000 (%)
Year householder moved into unit - Moved in 1999 to March 2000 (%) - White
Year householder moved into unit - Moved in 1999 to March 2000 (%) - Black or African American
Year householder moved into unit - Moved in 1999 to March 2000 (%) - Asian
Year householder moved into unit - Moved in 1999 to March 2000 (%) - Hispanic or Latino
Year householder moved into unit - Moved in 1999 to March 2000 (%) - American Indian and Alaska Native
Year householder moved into unit - Moved in 1999 to March 2000 (%) - Multirace
Year householder moved into unit - Moved in 1999 to March 2000 (%) - Other Race
Year householder moved into unit - Moved in 1995 to 1998 (%)
Year householder moved into unit - Moved in 1995 to 1998 (%) - White
Year householder moved into unit - Moved in 1995 to 1998 (%) - Black or African American
Year householder moved into unit - Moved in 1995 to 1998 (%) - Asian
Year householder moved into unit - Moved in 1995 to 1998 (%) - Hispanic or Latino
Year householder moved into unit - Moved in 1995 to 1998 (%) - American Indian and Alaska Native
Year householder moved into unit - Moved in 1995 to 1998 (%) - Multirace
Year householder moved into unit - Moved in 1995 to 1998 (%) - Other Race
Year householder moved into unit - Moved in 1990 to 1994 (%)
Year householder moved into unit - Moved in 1990 to 1994 (%) - White
Year householder moved into unit - Moved in 1990 to 1994 (%) - Black or African American
Year householder moved into unit - Moved in 1990 to 1994 (%) - Asian
Year householder moved into unit - Moved in 1990 to 1994 (%) - Hispanic or Latino
Year householder moved into unit - Moved in 1990 to 1994 (%) - American Indian and Alaska Native
Year householder moved into unit - Moved in 1990 to 1994 (%) - Multirace
Year householder moved into unit - Moved in 1990 to 1994 (%) - Other Race
Year householder moved into unit - Moved in 1980 to 1989 (%)
Year householder moved into unit - Moved in 1980 to 1989 (%) - White
Year householder moved into unit - Moved in 1980 to 1989 (%) - Black or African American
Year householder moved into unit - Moved in 1980 to 1989 (%) - Asian
Year householder moved into unit - Moved in 1980 to 1989 (%) - Hispanic or Latino
Year householder moved into unit - Moved in 1980 to 1989 (%) - American Indian and Alaska Native
Year householder moved into unit - Moved in 1980 to 1989 (%) - Multirace
Year householder moved into unit - Moved in 1980 to 1989 (%) - Other Race
Year householder moved into unit - Moved in 1970 to 1979 (%)
Year householder moved into unit - Moved in 1970 to 1979 (%) - White
Year householder moved into unit - Moved in 1970 to 1979 (%) - Black or African American
Year householder moved into unit - Moved in 1970 to 1979 (%) - Asian
Year householder moved into unit - Moved in 1970 to 1979 (%) - Hispanic or Latino
Year householder moved into unit - Moved in 1970 to 1979 (%) - American Indian and Alaska Native
Year householder moved into unit - Moved in 1970 to 1979 (%) - Multirace
Year householder moved into unit - Moved in 1970 to 1979 (%) - Other Race
Year householder moved into unit - Moved in 1969 or earlier (%)
Year householder moved into unit - Moved in 1969 or earlier (%) - White
Year householder moved into unit - Moved in 1969 or earlier (%) - Black or African American
Year householder moved into unit - Moved in 1969 or earlier (%) - Asian
Year householder moved into unit - Moved in 1969 or earlier (%) - Hispanic or Latino
Year householder moved into unit - Moved in 1969 or earlier (%) - American Indian and Alaska Native
Year householder moved into unit - Moved in 1969 or earlier (%) - Multirace
Year householder moved into unit - Moved in 1969 or earlier (%) - Other Race
Housing units lacking complete plumbing facilities (%)
Housing units lacking complete kitchen facilities (%)
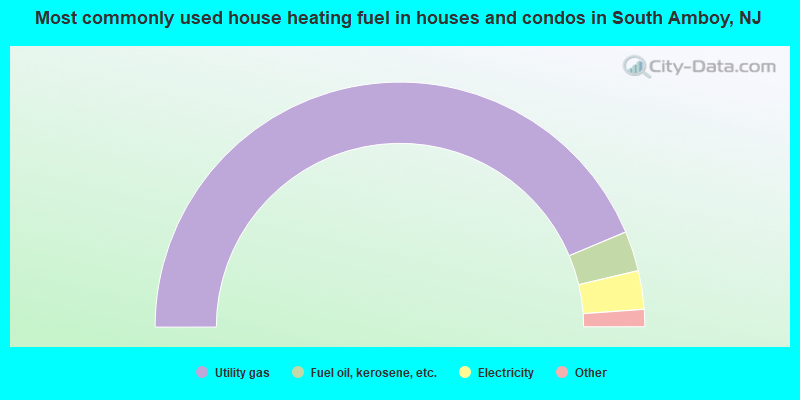
House heating fuel used in houses and condos - Utility gas (%)
House heating fuel used in houses and condos - Bottled, tank, or LP gas (%)
House heating fuel used in houses and condos - Electricity (%)
House heating fuel used in houses and condos - Fuel oil, kerosene, etc. (%)
House heating fuel used in houses and condos - Coal or coke (%)
House heating fuel used in houses and condos - Wood (%)
House heating fuel used in houses and condos - Solar energy (%)
House heating fuel used in houses and condos - Other fuel (%)
House heating fuel used in houses and condos - No fuel used (%)
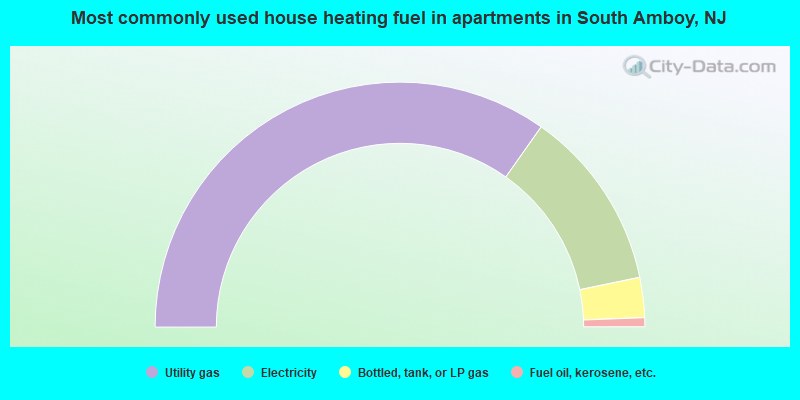
House heating fuel used in apartments - Utility gas (%)
House heating fuel used in apartments - Bottled, tank, or LP gas (%)
House heating fuel used in apartments - Electricity (%)
House heating fuel used in apartments - Fuel oil, kerosene, etc. (%)
House heating fuel used in apartments - Coal or coke (%)
House heating fuel used in apartments - Wood (%)
House heating fuel used in apartments - Solar energy (%)
House heating fuel used in apartments - Other fuel (%)
House heating fuel used in apartments - No fuel used (%)
Median year house/condo built: 1950Median year apartment built: 1962Household type by relationship:
Households: 9,349
Male householders: 1,963 (615 living alone ), Female householders: 2,073 (356 living alone )1,929 spouses (1,919 opposite-sex spouses ), 106 unmarried partners , (106 opposite-sex unmarried partners ), 2,741 children (2,608 natural , 0 adopted , 132 stepchildren ), 40 grandchildren , 95 brothers or sisters , 142 parents , 0 foster children , 91 other relatives , 129 non-relatives In group quarters: 38
Size of family households: 1,597 2-persons , 673 3-persons , 458 4-persons , 120 5-persons , 60 6-persons .
Size of nonfamily households: 988 1-person , 207 2-persons , 10 3-persons .
833 married couples with children. single-parent households (0 men , 590 women ).
71.0% of residents of South Amboy speak English at home. of residents speak Spanish at home (68% speak English very well , 16% speak English well , 10% speak English not well , 5% don't speak English at all ).of residents speak other Indo-European language at home (48% speak English very well , 9% speak English well , 42% speak English not well , 1% don't speak English at all ).of residents speak Asian or Pacific Island language at home (70% speak English very well , 25% speak English well , 1% speak English not well , 5% don't speak English at all ).of residents speak other language at home (100% speak English very well ).
Foreign born population: 1,826 (19.5%)of them are naturalized citizens )
Median number of rooms in houses and condos:
Median number of rooms in apartments
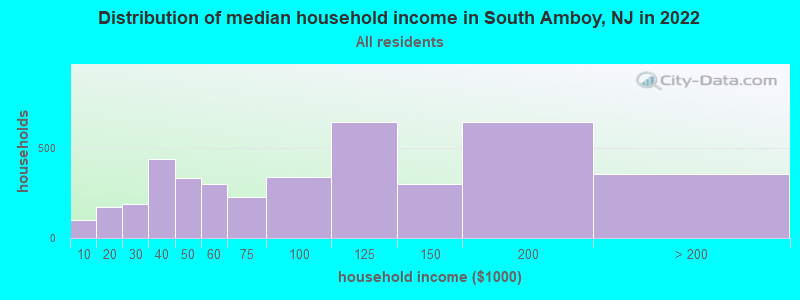
South Amboy, NJ household income distribution 102 Less than $10,000171 $10,000 to $19,999187 $20,000 to $29,999439 $30,000 to $39,999333 $40,000 to $49,999298 $50,000 to $59,999228 $60,000 to $74,999336 $75,000 to $99,999642 $100,000 to $124,999297 $125,000 to $149,999643 $150,000 to $199,999357 $200,000 or more
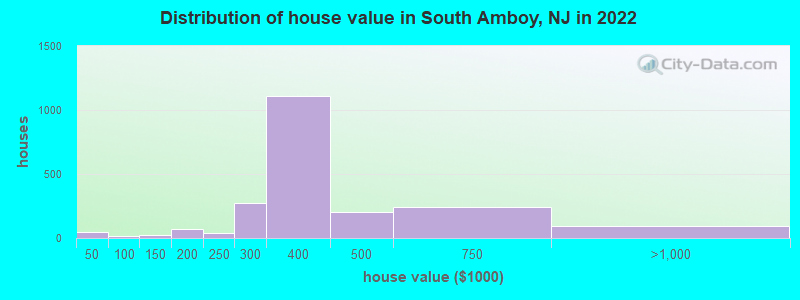
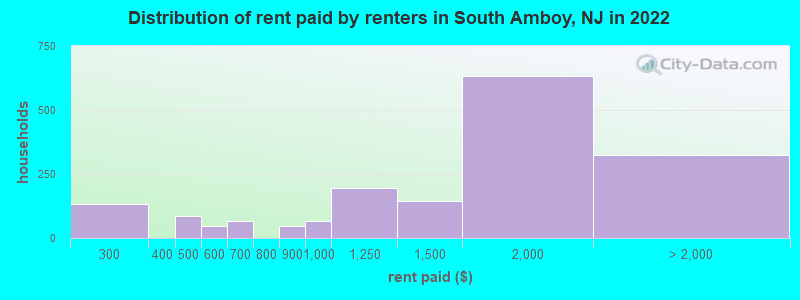
Home value of owner - occupied houses in 2022 in South Amboy, NJ 10 Less than $10,00013 $30,000 to $34,9996 $35,000 to $39,99913 $40,000 to $49,99923 $125,000 to $149,99946 $150,000 to $174,99925 $175,000 to $199,99938 $200,000 to $249,999273 $250,000 to $299,9991,110 $300,000 to $399,999199 $400,000 to $499,999244 $500,000 to $749,99979 $750,000 to $999,99915 $2,000,000 or moreRent paid by renters in 2022 in South Amboy, NJ 131 $250 to $29986 $450 to $49944 $550 to $59965 $600 to $64944 $800 to $89968 $900 to $999194 $1,000 to $1,249145 $1,250 to $1,499633 $1,500 to $1,99966 $2,000 to $2,499234 $2,500 to $2,99925 No cash rent
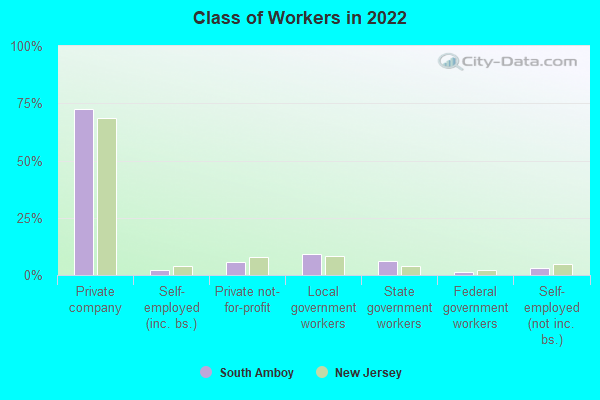
Percentage of workers working in this county: 63.8%Number of people working at home: 643 (12.0% of all workers )
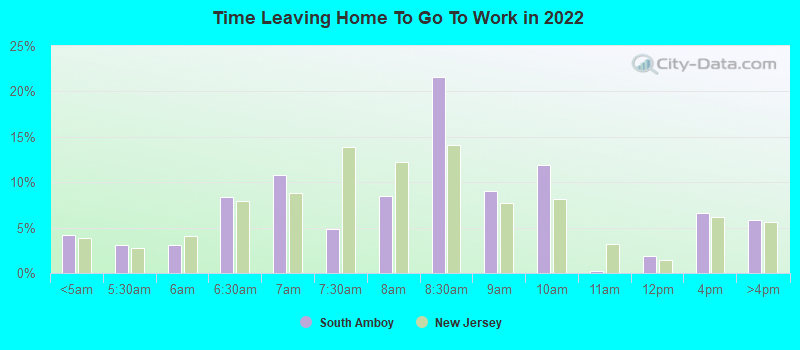
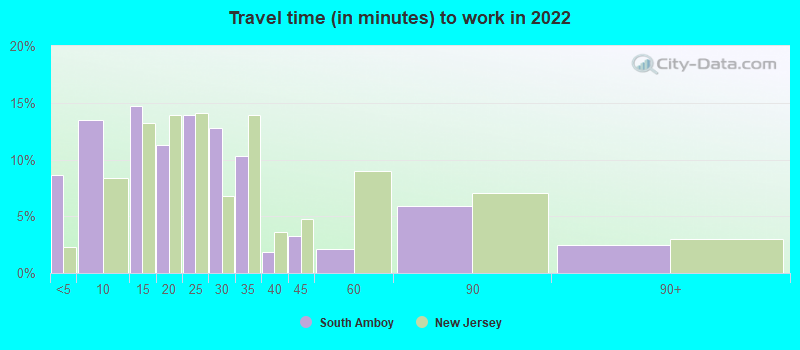
Travel time to work (commute)
Less than 5 minutes: 2565 to 9 minutes: 16010 to 14 minutes: 31015 to 19 minutes: 71020 to 24 minutes: 1,00425 to 29 minutes: 33730 to 34 minutes: 57135 to 39 minutes: 12540 to 44 minutes: 15545 to 59 minutes: 40360 to 89 minutes: 29290 or more minutes: 293
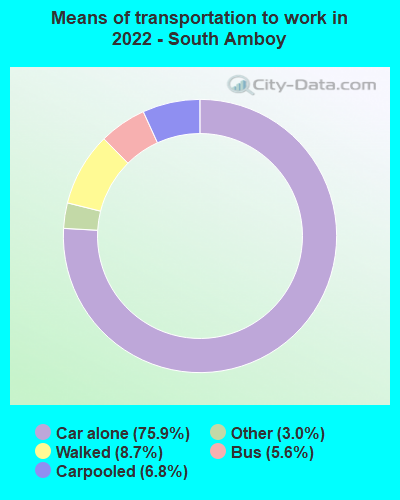
Means of transportation to work:
Drove a car alone: 1,278 (54.5%)Carpooled: 135 (5.8%)Bus : 42 (1.8%)Taxi: 68 (2.9%)Walked: 217 (9.2%)Worked at home: 643 (27.4%)
Unemployment by race in 2022
Unemployment rate for White non-Hispanic residents 2.8% Males0.3% FemalesUnemployment rate for American Indian and Alaska Native residents 100.0% FemalesUnemployment rate for Asian residents 14.9% MalesUnemployment rate for other race residents 12.8% Males12.0% FemalesUnemployment rate for two or more race residents 14.5% Males42.7% FemalesUnemployment rate for Hispanic or Latino residents 7.2% Males17.4% Females
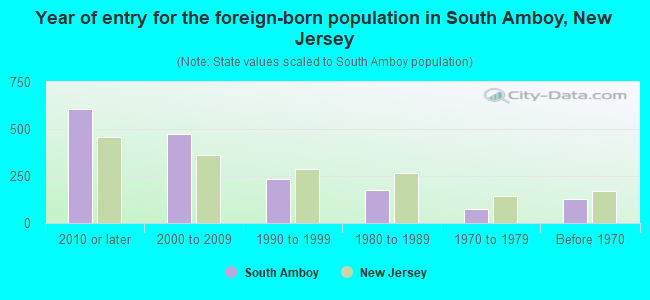
Year of entry for the foreign-born population in South Amboy, New Jersey
605 2010 or later 472 2000 to 2009 235 1990 to 1999 177 1980 to 1989 75 1970 to 1979 126 Before 1970
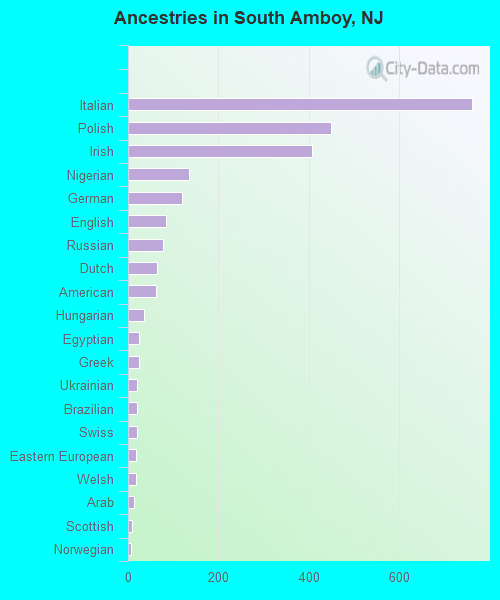
First ancestries reported:
Italian: 760 (16.0%)
Polish: 449 (9.5%)
Irish: 407 (8.6%)
Nigerian: 135 (2.8%)
German: 120 (2.5%)
English: 83 (1.8%)
Russian: 77 (1.6%)
Dutch: 64 (1.4%)
American: 63 (1.3%)
Hungarian: 35 (0.7%)
Egyptian: 25 (0.5%)
Greek: 24 (0.5%)
Ukrainian: 21 (0.4%)
Brazilian: 20 (0.4%)
Swiss: 19 (0.4%)
Eastern European: 18 (0.4%)
Welsh: 17 (0.4%)
Arab: 13 (0.3%)
Scottish: 8 (0.2%)
Norwegian: 7 (0.1%) Most common places of birth for foreign-born residents (%): Dominican Republic South Amboy:
22.0% (391)New Jersey:
9.7% (209,055)
Poland South Amboy:
19.8% (351)New Jersey:
2.3% (48,811)
Colombia South Amboy:
6.6% (118)New Jersey:
4.2% (90,817)
India South Amboy:
5.5% (98)New Jersey:
12.8% (274,609)
Philippines South Amboy:
5.3% (94)New Jersey:
4.0% (85,934)
Peru South Amboy:
5.2% (92)New Jersey:
2.7% (58,563)
Mexico South Amboy:
4.3% (77)New Jersey:
4.8% (102,527)
China, excluding Hong Kong and Taiwan South Amboy:
4.1% (72)New Jersey:
3.7% (78,969)
Taiwan South Amboy:
3.8% (68)New Jersey:
0.7% (15,548)
Brazil South Amboy:
3.2% (57)New Jersey:
2.1% (46,020)
Germany South Amboy:
2.0% (36)New Jersey:
0.8% (17,217)
Netherlands South Amboy:
2.0% (35)New Jersey:
0.1% (2,616)
Russia South Amboy:
2.0% (35)New Jersey:
0.9% (20,371)
Uruguay South Amboy:
1.9% (34)New Jersey:
0.3% (6,972)
Cuba South Amboy:
1.8% (32)New Jersey:
2.1% (45,435)
Venezuela South Amboy:
1.7% (30)New Jersey:
0.6% (12,929)
Place of birth for U.S.-born residents:
This state: 5,697Other state: 1,487Northeast: 1,010Midwest: 55South: 302West: 87 90.9% of South Amboy residents lived in the same house 1 years ago.
Out of people who lived in different houses, 19.8% lived in this county.
Out of people who lived in different counties, 57.6% lived in New Jersey.
South Amboy:
90.9%State average:
90.4%
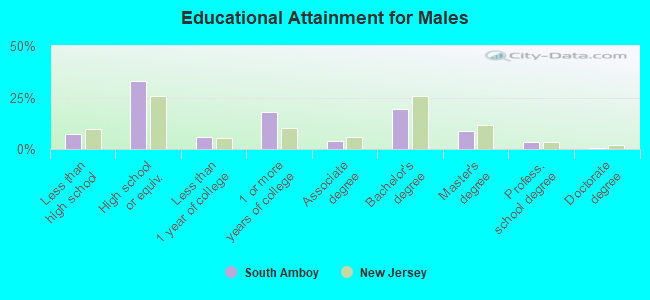
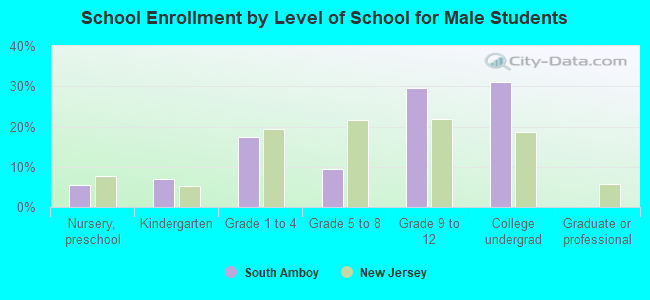
Education attainment for males 25 years and older:
No schooling: 61Nursery to 4th grade: 345th and 6th grade: 07th and 8th grade: 139th grade: 010th grade: 811th grade: 2412th grade, no diploma: 98High school graduate (or equivalency): 1,089Less than 1 year of college: 198Some college more than 1 year, no degree: 587Associate degree: 128Bachelor's degree: 650Master's degree: 285Professional school degree: 115Doctorate degree: 21
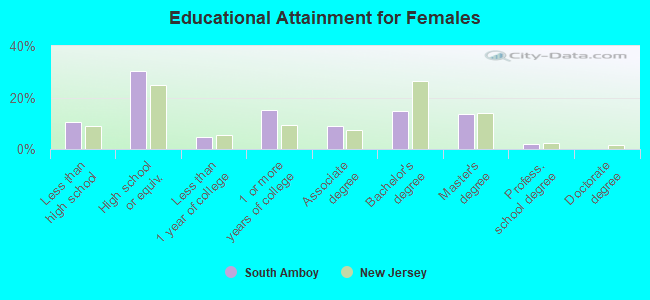
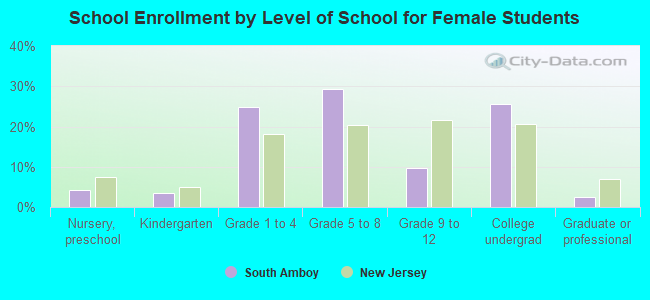
Education attainment for females 25 years and older:
No schooling: 79Nursery to 4th grade: 05th and 6th grade: 07th and 8th grade: 179th grade: 010th grade: 20411th grade: 4412th grade, no diploma: 44High school graduate (or equivalency): 1,117Less than 1 year of college: 172Some college more than 1 year, no degree: 555Associate degree: 330Bachelor's degree: 547Master's degree: 501Professional school degree: 67Doctorate degree: 0
Housing units in structures:
One, detached: 1,874One, attached: 535Two: 7123 or 4: 2965 to 9: 38920 to 49: 26450 or more: 217Housing units lacking complete plumbing facilities in 2022: 1.2%Housing units lacking complete kitchen facilities in 2022: 1.6%House/condo owner moved in on average 16 years ago
Renter moved in on average 5 years ago
Private vs. public school enrollment:
Students in private schools in grades 1 to 8 (elementary and middle school): 63 Here:
9.3%New Jersey:
12.3%
Students in private schools in grades 9 to 12 (high school): 14 Here:
5.0%New Jersey:
13.1%
Students in private undergraduate colleges: 243 Here:
52.8%New Jersey:
33.2%