Housing density: 3,589 houses/condos per square mile
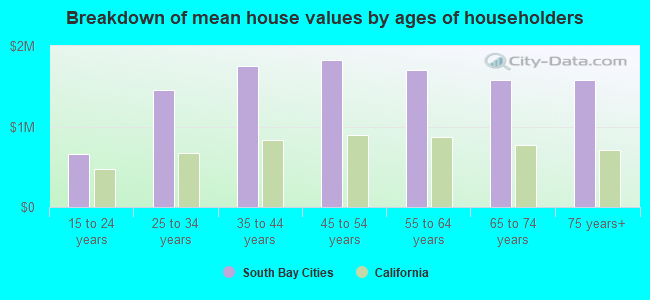
Median price asked for vacant for-sale houses and condos in 2022 in this county: $1,291,802.
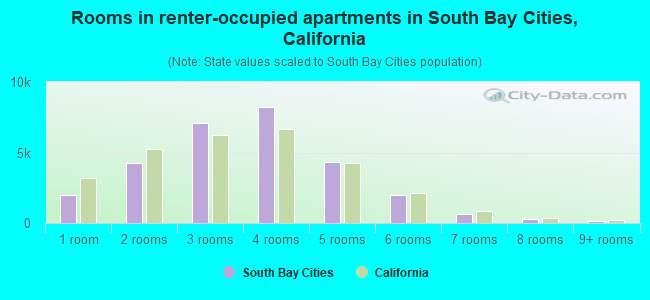
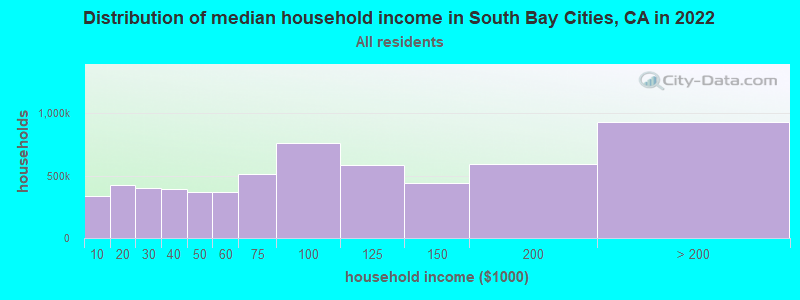
Median contract rent in 2022: over $2,000 (lower quartile is $1,884, upper quartile is over $2,000)
Median rent asked for vacant for-rent units in 2022: $3,141
Median gross rent in South Bay Cities, CA in 2022: over $2,000
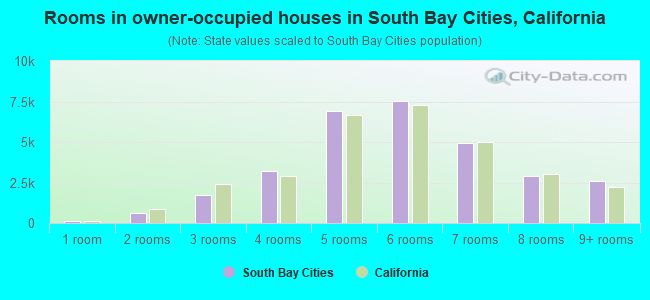
Housing units in South Bay Cities with a mortgage: 20,832 (2,736 second mortgage, 2,171 home equity loan, 35 both second mortgage and home equity loan) Houses without a mortgage: 4,909
Compare current foreclosures near South Bay Cities, CA:
In family households: 8,234,154 (1,430,848 male householders, 763,232 female householders)
1,480,665 spouses, 3,033,524 children (2,872,074 natural, 53,496 adopted, 107,954 stepchildren), 308,856 grandchildren, 205,746 brothers or sisters, 184,807 parents, foster children, 318,669 other relatives, 372,007 non-relatives
In nonfamily households: 1,412,770 (510,532 male householders (360,530 living alone)), 536,592 female householders (424,398 living alone)), 365,646 nonrelatives
In group quarters: 171,681 (68,682 institutionalized population)
1,648,001 married couples with children.
626,289 single-parent households (146,085 men, 480,204 women).
83.6% of residents of South Bay Cities speak English at home.
6.7% of residents speak Spanish at home (72% speak English very well, 18% speak English well, 8% speak English not well, 1% don't speak English at all).
4.9% of residents speak other Indo-European language at home (75% speak English very well, 18% speak English well, 6% speak English not well, 1% don't speak English at all).
4.0% of residents speak Asian or Pacific Island language at home (58% speak English very well, 27% speak English well, 14% speak English not well, 1% don't speak English at all).
0.8% of residents speak other language at home (72% speak English very well, 18% speak English well, 8% speak English not well, 2% don't speak English at all).
Foreign born population: 16,161 (12.0%)
(75.2% of them are naturalized citizens)
Percentage of workers working in this county: 94.8% Number of people working at home: 16,501 (17.0% of all workers)
Travel time to work (commute)
Less than 5 minutes: 1,653
5 to 9 minutes: 6,680
10 to 14 minutes: 9,758
15 to 19 minutes: 11,208
20 to 24 minutes: 9,948
25 to 29 minutes: 3,653
30 to 34 minutes: 8,710
35 to 39 minutes: 2,314
40 to 44 minutes: 3,815
45 to 59 minutes: 9,477
60 to 89 minutes: 6,043
90 or more minutes: 1,523
Means of transportation to work:
Drove a car alone: 65,787 (83.7%)
Carpooled: 5,527 (7.0%)
Bus or trolley bus: 657 (0.8%)
Streetcar or trolley car: 36 (0.0%)
Subway or elevated: 34 (0.0%)
Ferryboat: 26 (0.0%)
Taxi: 104 (0.1%)
Motorcycle: 332 (0.4%)
Bicycle: 448 (0.6%)
Walked: 1,342 (1.7%)
Other means: 489 (0.6%)
Worked at home: 3,785 (4.8%)
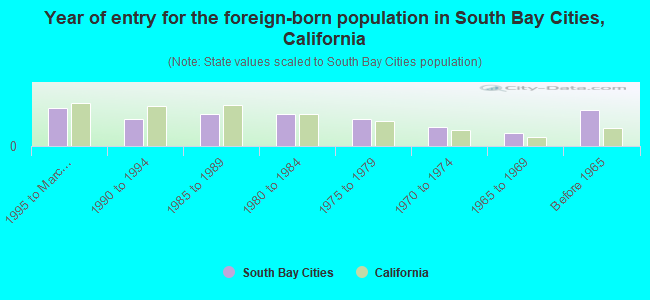
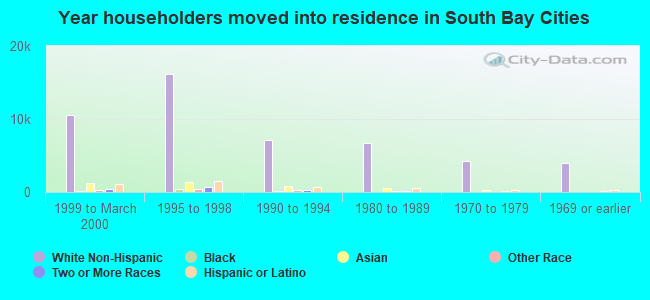
Year of entry for the foreign-born population in South Bay Cities, California
2,9501995 to March 2000
2,1161990 to 1994
2,4681985 to 1989
2,5001980 to 1984
2,0581975 to 1979
1,4301970 to 1974
1,0121965 to 1969
2,774Before 1965
Most common places of birth for foreign-born residents (%):
Mexico
South Bay Cities:
9.6% (1,663)
California:
44.3% (3,928,701)
United Kingdom
South Bay Cities:
7.6% (1,310)
California:
1.5% (133,090)
Canada
South Bay Cities:
7.4% (1,288)
California:
1.6% (141,181)
Japan
South Bay Cities:
5.9% (1,023)
California:
1.3% (112,212)
Philippines
South Bay Cities:
5.2% (899)
California:
7.5% (664,935)
Iran
South Bay Cities:
4.2% (730)
California:
1.8% (158,613)
Korea
South Bay Cities:
3.8% (651)
California:
3.0% (268,452)
India
South Bay Cities:
3.6% (617)
California:
2.2% (198,201)
Germany
South Bay Cities:
3.1% (539)
California:
1.1% (98,160)
China, excluding Hong Kong and Taiwan
South Bay Cities:
2.8% (487)
California:
3.7% (327,611)
Vietnam
South Bay Cities:
2.6% (454)
California:
4.7% (418,249)
Brazil
South Bay Cities:
2.6% (453)
California:
0.3% (22,931)
Taiwan
South Bay Cities:
2.5% (438)
California:
1.7% (151,775)
France
South Bay Cities:
1.8% (303)
California:
0.4% (32,279)
Argentina
South Bay Cities:
1.7% (299)
California:
0.3% (29,335)
Hong Kong
South Bay Cities:
1.6% (274)
California:
1.0% (91,101)
Peru
South Bay Cities:
1.5% (267)
California:
0.6% (53,250)
Place of birth for U.S.-born residents:
This state: 64,405
Other state: 48,389
Northeast: 14,991
Midwest: 17,063
South: 9,367
West: 6,968
50% of South Bay Cities residents lived in the same house 5 years ago. Out of people who lived in different houses, 67% lived in this county. Out of people who lived in different counties, 40% lived in California.
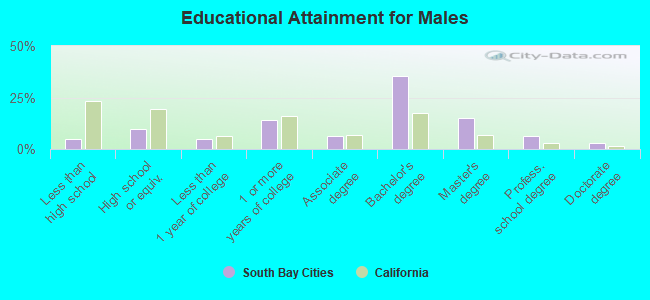
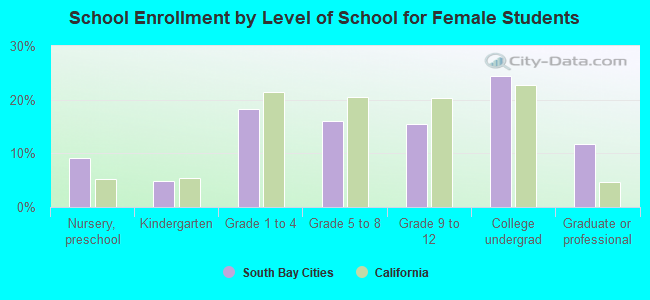
Education attainment for males 25 years and older:
No schooling: 147
Nursery to 4th grade: 45
5th and 6th grade: 203
7th and 8th grade: 198
9th grade: 182
10th grade: 315
11th grade: 399
12th grade, no diploma: 998
High school graduate (or equivalency): 4,918
Less than 1 year of college: 2,451
Some college more than 1 year, no degree: 7,127
Associate degree: 3,185
Bachelor's degree: 17,839
Master's degree: 7,478
Professional school degree: 3,216
Doctorate degree: 1,365
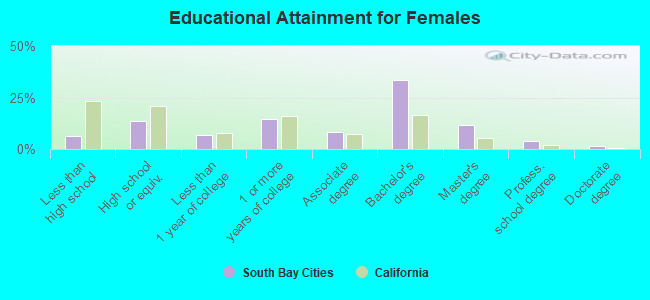
Education attainment for females 25 years and older:
No schooling: 207
Nursery to 4th grade: 95
5th and 6th grade: 214
7th and 8th grade: 297
9th grade: 333
10th grade: 354
11th grade: 460
12th grade, no diploma: 1,118
High school graduate (or equivalency): 6,680
Less than 1 year of college: 3,435
Some college more than 1 year, no degree: 7,293
Associate degree: 4,035
Bachelor's degree: 16,471
Master's degree: 5,856
Professional school degree: 1,960
Doctorate degree: 671
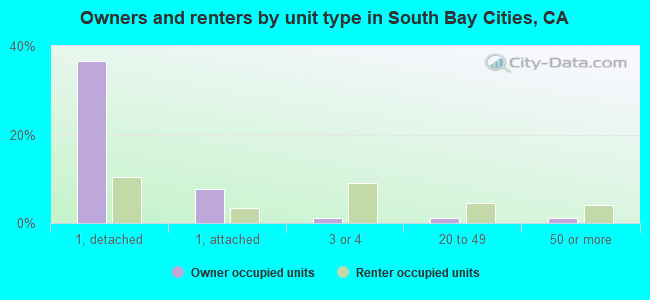
Housing units in structures:
One, detached: 28,746
One, attached: 6,951
Two: 3,506
3 or 4: 6,169
5 to 9: 5,335
10 to 19: 3,565
20 to 49: 3,510
50 or more: 3,390
Mobile homes: 215
Boats, RVs, vans, etc.: 291
Median worth of mobile homes: $100,662
Housing units lacking complete plumbing facilities: 0.5%
Housing units lacking complete kitchen facilities: 0.6%