South Bloomfield, OH (Ohio) Houses and Residents
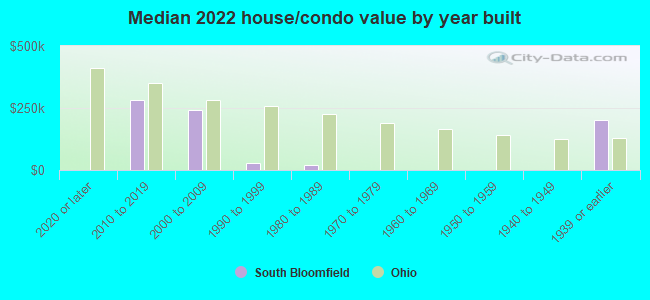
| South Bloomfield: | $213,787 |
| Ohio: | $204,100 |
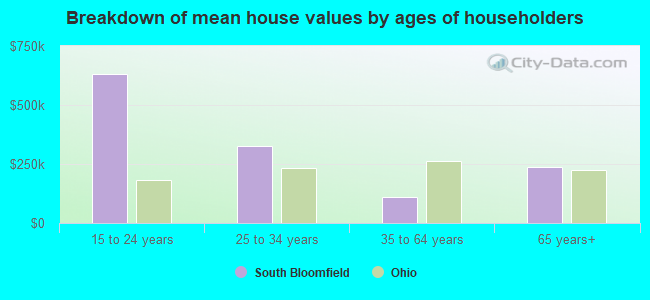
Mean price in 2022:
Detached houses: $188,461
Here: $188,461 State: $254,366 Mobile homes: $48,356
Here: $48,356 State: $62,719
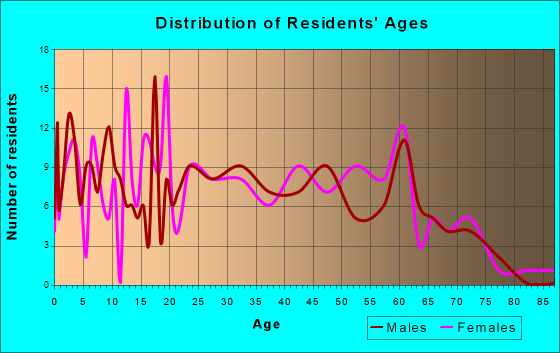
Total population: 1,812 (Urban population: 1,137 (all inside urban clusters), Rural population: 45 (5 farm, 40 nonfarm))
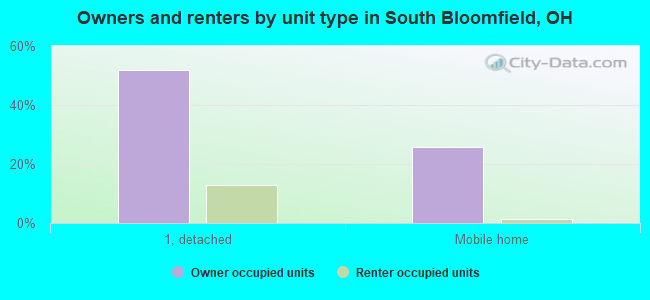
Houses: 897 (840 occupied: 658 owner occupied, 190 renter occupied)
| % of renters here: | 22% |
| State: | 33% |
Housing density: 781 houses/condos per square mile
Median price asked for vacant for-sale houses and condos in 2022 in this county: $44,402.
Median contract rent in 2022: $814 (lower quartile is $683, upper quartile is $1,169)
Median rent asked for vacant for-rent units in 2022: $806
Median gross rent in South Bloomfield, OH in 2022: $1,205
Housing units in South Bloomfield with a mortgage: 443 (30 second mortgage, 0 home equity loan, 21 both second mortgage and home equity loan)
Houses without a mortgage: 0
Median household income for houses/condos with a mortgage: $97,164
Median household income for apartments without a mortgage: $53,047
Median monthly housing costs: $1,151
Compare current foreclosures near South Bloomfield, OH:
| Photo | Address | Area | Beds / Baths | Price | Details |
|---|---|---|---|---|---|

|
#1
Bayberry Cir
Columbus, OH 43207
|
1,564 sq. feet
|
1 baths 3 beds |
$127,500
|
show details |

|
#2
Us Highway 23 N
Circleville, OH 43113
|
1,014 sq. feet
|
1 baths 3 beds |
$19,900
|
show details |

|
#3
1 2 Sullivant Avenue
Columbus, OH 43204
|
2,288 sq. feet
|
2 baths 4 beds |
show details | |

|
#4
Meadowbrook Dr
Columbus, OH 43207
|
1,752 sq. feet
|
2 baths 4 beds |
show details | |

|
#5
S Hague Ave
Columbus, OH 43204
|
979 sq. feet
|
1 baths 2 beds |
show details | |

|
#6
3rd St
Williamsport, OH 43164
|
864 sq. feet
|
1 baths 2 beds |
show details | |

|
#7
Wrexham Ave
Columbus, OH 43223
|
1,235 sq. feet
|
1 baths 3 beds |
show details | |

|
#8
E Welch Ave
Columbus, OH 43207
|
1,864 sq. feet
|
2 baths 3 beds |
show details | |

|
#9
S Richardson Ave
Columbus, OH 43204
|
1,520 sq. feet
|
2 baths 3 beds |
show details | |

|
#10
Tonda Ln
Grove City, OH 43123
|
1,376 sq. feet
|
2 baths 3 beds |
show details |
| Photo | Address | Area | Beds / Baths | Price | Details |
|---|---|---|---|---|---|

|
#11
S Cassingham Rd
Columbus, OH 43209
|
3,088 sq. feet
|
2 baths 6 beds |
show details | |

|
#12
Argus Rd
Columbus, OH 43227
|
1,176 sq. feet
|
2 baths 3 beds |
show details | |

|
#13
Village Grove Ln
Canal Winchester, OH 43110
|
2,040 sq. feet
|
1 baths 3 beds |
show details | |

|
#14
Algean Dr
Canal Winchester, OH 43110
|
1,484 sq. feet
|
2 baths 3 beds |
show details | |

|
#15
Black Pine Dr
Grove City, OH 43123
|
1,466 sq. feet
|
2 baths 3 beds |
show details | |

|
#16
Manley Way
Grove City, OH 43123
|
1,443 sq. feet
|
3 baths 2 beds |
show details | |

|
#17
Coble Bowman Way
Canal Winchester, OH 43110
|
1,950 sq. feet
|
2 baths 3 beds |
show details | |

|
#18
Glendalough St
Canal Winchester, OH 43110
|
1,356 sq. feet
|
2 baths 3 beds |
show details | |

|
#19
Remington Ridge Rd
Columbus, OH 43232
|
1,224 sq. feet
|
2 baths 3 beds |
show details | |

|
#20
Wade Rd
Columbus, OH 43232
|
1,192 sq. feet
|
1 baths 2 beds |
show details |
| Photo | Address | Area | Beds / Baths | Price | Details |
|---|---|---|---|---|---|

|
#21
Albany Dr
Columbus, OH 43232
|
1,650 sq. feet
|
2 baths 4 beds |
show details | |

|
#22
Coble Bowman Way
Canal Winchester, OH 43110
|
1,420 sq. feet
|
2 baths 3 beds |
show details | |

|
#23
Glendalough St
Canal Winchester, OH 43110
|
1,176 sq. feet
|
2 baths 3 beds |
show details | |

|
#24
Bowman Meadow Dr
Canal Winchester, OH 43110
|
1,950 sq. feet
|
2 baths 3 beds |
show details | |

|
#25
Joyful St
Columbus, OH 43204
|
988 sq. feet
|
1 baths 3 beds |
show details | |

|
#26
Evanston Rd
Columbus, OH 43232
|
1,512 sq. feet
|
1 baths 3 beds |
show details | |

|
#27
Shannon Square Dr
Canal Winchester, OH 43110
|
2,088 sq. feet
|
2 baths 4 beds |
show details | |

|
#28
Glengate Dr
Columbus, OH 43232
|
1,136 sq. feet
|
1 baths 3 beds |
show details | |

|
#29
Bentler Dr
Columbus, OH 43232
|
1,186 sq. feet
|
1 baths 3 beds |
show details | |

|
#30
Bonita Rd
Columbus, OH 43232
|
950 sq. feet
|
1 baths 3 beds |
show details |
| Photo | Address | Area | Beds / Baths | Price | Details |
|---|---|---|---|---|---|

|
#31
Bowman Meadow Dr # 17
Canal Winchester, OH 43110
|
2,420 sq. feet
|
3 baths 4 beds |
show details | |

|
#32
Joyful St
Columbus, OH 43204
|
988 sq. feet
|
1 baths 3 beds |
show details | |

|
#33
Moyer Ln
Grove City, OH 43123
|
1,350 sq. feet
|
2 baths 3 beds |
show details | |

|
#34
S Oakley Ave
Columbus, OH 43204
|
992 sq. feet
|
2 baths 3 beds |
show details | |

|
#35
Basil Dr
Columbus, OH 43227
|
1,604 sq. feet
|
2 baths 4 beds |
show details | |

|
#36
Shamrock Dr
Columbus, OH 43227
|
1,155 sq. feet
|
1 baths 3 beds |
show details | |

|
#37
Majestic Dr E
Columbus, OH 43232
|
936 sq. feet
|
1 baths 3 beds |
show details | |

|
#38
E Livingston Ave
Columbus, OH 43205
|
1,304 sq. feet
|
1 baths 3 beds |
show details | |

|
#39
Berrancher Dr
Columbus, OH 43228
|
1,522 sq. feet
|
2 baths 2 beds |
show details | |

|
#40
Sand Dollar Dr
Columbus, OH 43232
|
1,560 sq. feet
|
1 baths 3 beds |
show details |
| Photo | Address | Area | Beds / Baths | Price | Details |
|---|---|---|---|---|---|

|
#41
Knights Bridge Dr N
Pickerington, OH 43147
|
2,338 sq. feet
|
2 baths 4 beds |
show details | |

|
#42
Englecrest Dr
Canal Winchester, OH 43110
|
2,312 sq. feet
|
2 baths 4 beds |
show details | |

|
#43
Norton Rd
Grove City, OH 43123
|
1,876 sq. feet
|
2 baths 4 beds |
show details | |

|
#44
Aven Dr
Columbus, OH 43227
|
999 sq. feet
|
1 baths 3 beds |
show details | |

|
#45
Little Water Dr
Columbus, OH 43223
|
1,448 sq. feet
|
3 baths 3 beds |
show details | |

|
#46
Alkire Rd
Grove City, OH 43123
|
1,120 sq. feet
|
1 baths 3 beds |
show details | |

|
#47
Smith Rd
Columbus, OH 43207
|
910 sq. feet
|
1 baths 3 beds |
show details | |

|
#48
Amherst Ave
Columbus, OH 43223
|
725 sq. feet
|
1 baths 2 beds |
show details | |

|
#49
Rambling Brook Dr
Pickerington, OH 43147
|
2,147 sq. feet
|
2 baths 4 beds |
show details | |

|
Check over 1 million property listings on Foreclosure.com!
|
browse all offers | |||


 | Shifty's Bar in South Bloomfield..... (7 replies) |
| Country Living around Columbus.. Please help! (53 replies) |
| Recently out of the USMC, Looking for a house to rent. (1 reply) |
| best areas to live in (21 replies) |
| NEED HELP finding affordable, SAFE areas around Columbus (19 replies) |
| Areas withint 45 minutes of Columbus? (8 replies) |
Median year apartment built: 2002
Household type by relationship:
Households: 2,672- Male householders: 380 (97 living alone), Female householders: 452 (113 living alone)
443 spouses (443 opposite-sex spouses), 100 unmarried partners, (63 opposite-sex unmarried partners), 961 children (781 natural, 18 adopted, 160 stepchildren), 47 grandchildren, 42 brothers or sisters, 65 parents, 0 foster children, 95 other relatives, 81 non-relatives
Size of family households: 179 2-persons, 113 3-persons, 108 4-persons, 80 5-persons, 71 6-persons, 22 7-or-more-persons.
Size of nonfamily households: 218 1-person, 44 2-persons, 5 3-persons.
451 married couples with children.
213 single-parent households (115 men, 98 women).
95.3% of residents of South Bloomfield speak English at home.
4.1% of residents speak Spanish at home (36% speak English very well, 23% speak English well, 20% speak English not well, 21% don't speak English at all).
Foreign born population: 50 (1.9%)
(12.0% of them are naturalized citizens)
| Here: | 6.1 |
| State: | 6.7 |
| Here: | 4.9 |
| State: | 4.4 |
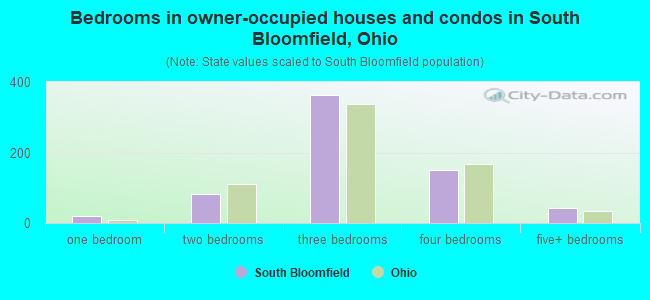
- Bedrooms in owner-occupied houses and condos in South Bloomfield, Ohio
- 0no bedroom
- 211 bedroom
- 812 bedrooms
- 3643 bedrooms
- 1514 bedrooms
- 425+ bedrooms
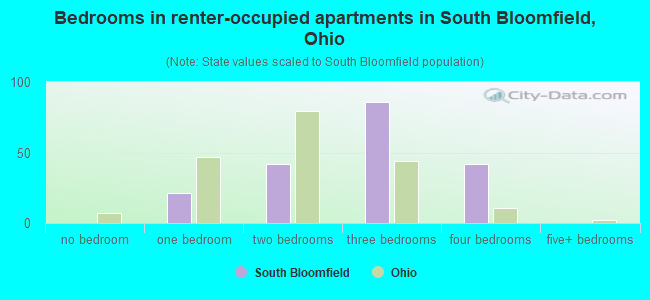
- Bedrooms in renter-occupied apartments in South Bloomfield, Ohio
- 0no bedroom
- 211 bedroom
- 422 bedrooms
- 863 bedrooms
- 424 bedrooms
- 05+ bedrooms
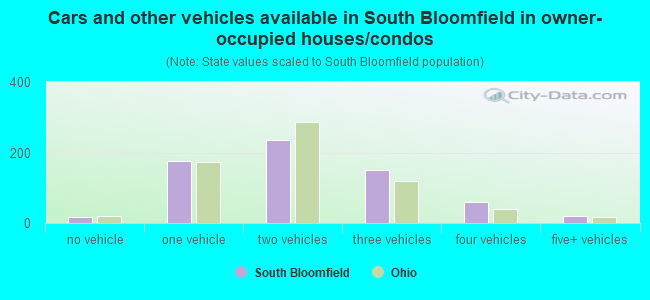
- Cars and other vehicles available in South Bloomfield in owner-occupied houses/condos
- 16no vehicle
- 1771 vehicle
- 2352 vehicles
- 1503 vehicles
- 604 vehicles
- 205+ vehicles
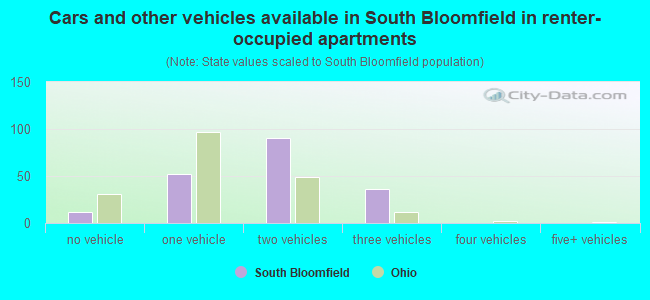
- Cars and other vehicles available in South Bloomfield in renter-occupied apartments
- 11no vehicle
- 521 vehicle
- 912 vehicles
- 373 vehicles
- 04 vehicles
- 05+ vehicles
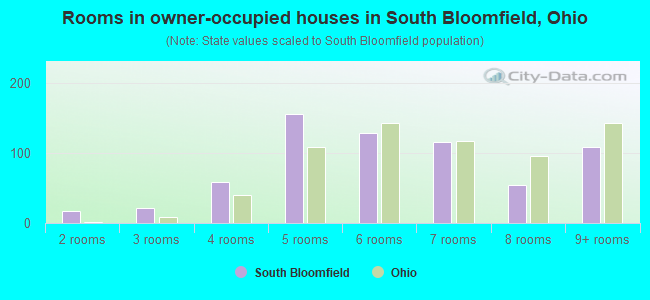
- Rooms in owner-occupied houses in South Bloomfield, Ohio
- 01 room
- 172 rooms
- 213 rooms
- 584 rooms
- 1555 rooms
- 1286 rooms
- 1167 rooms
- 548 rooms
- 1099+ rooms
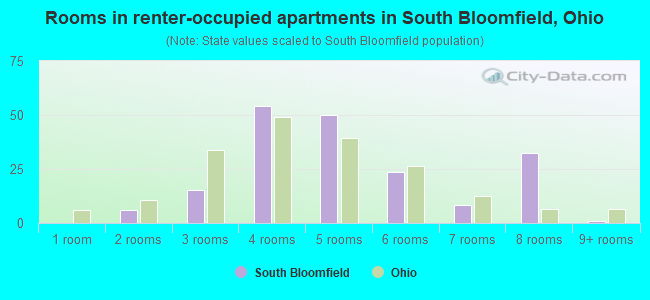
- Rooms in renter-occupied apartments in South Bloomfield, Ohio
- 01 room
- 62 rooms
- 153 rooms
- 544 rooms
- 505 rooms
- 236 rooms
- 87 rooms
- 338 rooms
- 19+ rooms
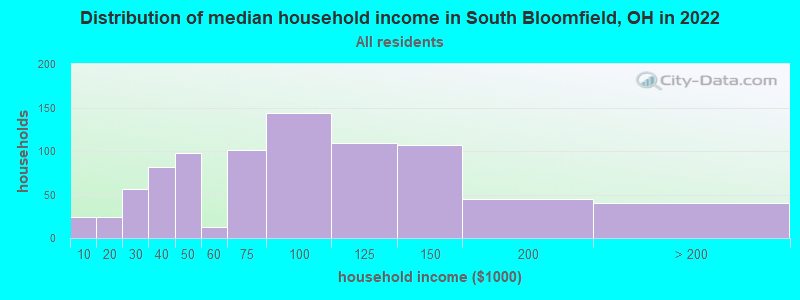
South Bloomfield, OH household income distribution

- 24Less than $10,000
- 24$10,000 to $19,999
- 56$20,000 to $29,999
- 82$30,000 to $39,999
- 98$40,000 to $49,999
- 13$50,000 to $59,999
- 101$60,000 to $74,999
- 144$75,000 to $99,999
- 109$100,000 to $124,999
- 107$125,000 to $149,999
- 45$150,000 to $199,999
- 40$200,000 or more
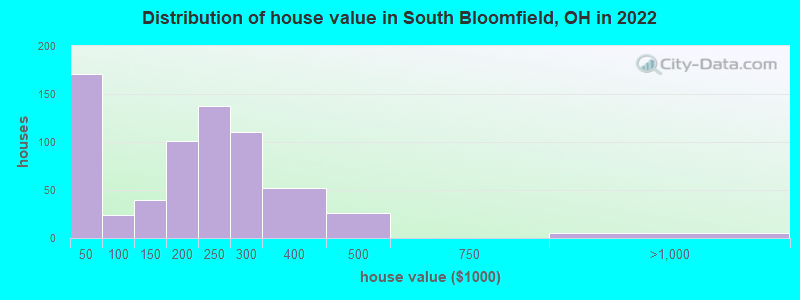
Home value of owner - occupied houses in 2022 in South Bloomfield, OH
-
- 8Less than $10,000
- 14$10,000 to $14,999
- 76$15,000 to $19,999
- 12$20,000 to $24,999
- 33$25,000 to $29,999
- 22$30,000 to $34,999
- 3$40,000 to $49,999
- 2$50,000 to $59,999
- 12$70,000 to $79,999
- 5$90,000 to $99,999
- 28$100,000 to $124,999
- 11$125,000 to $149,999
- 39$150,000 to $174,999
- 61$175,000 to $199,999
- 138$200,000 to $249,999
- 110$250,000 to $299,999
- 51$300,000 to $399,999
- 26$400,000 to $499,999
- 5$750,000 to $999,999
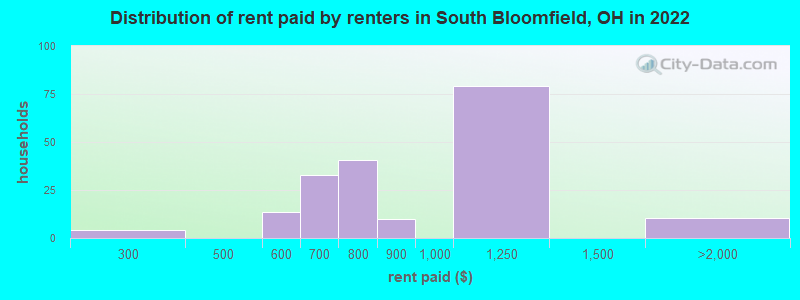
Rent paid by renters in 2022 in South Bloomfield, OH
-
- 4$250 to $299
- 13$500 to $549
- 25$600 to $649
- 7$650 to $699
- 25$700 to $749
- 15$750 to $799
- 10$800 to $899
- 79$1,000 to $1,249
- 9$1,500 to $1,999
- 1No cash rent
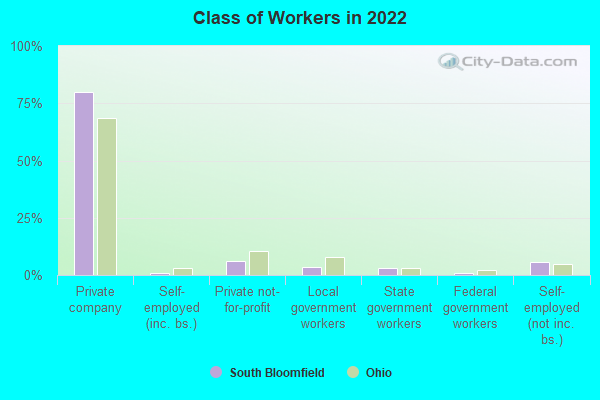
Percentage of workers working in this county: 27.8%
Number of people working at home: 173 (13.0% of all workers)
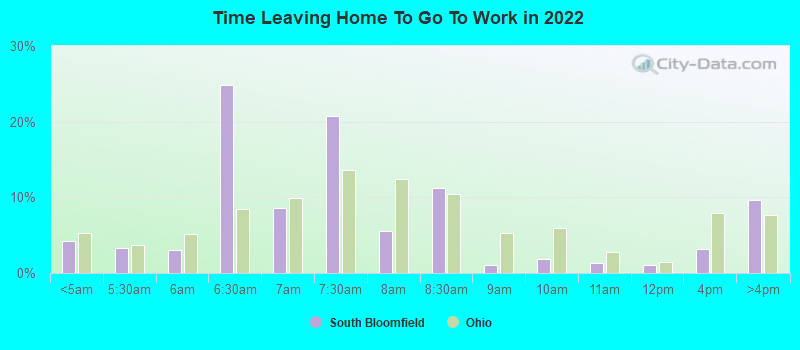
Travel time to work (commute)
- Less than 5 minutes: 87
- 5 to 9 minutes: 6
- 10 to 14 minutes: 42
- 15 to 19 minutes: 58
- 20 to 24 minutes: 96
- 25 to 29 minutes: 140
- 30 to 34 minutes: 302
- 35 to 39 minutes: 125
- 40 to 44 minutes: 10
- 45 to 59 minutes: 183
- 60 to 89 minutes: 61
- 90 or more minutes: 24
Means of transportation to work:
- Drove a car alone: 465 (81.7%)
- Carpooled: 81 (14.2%)
- Walked: 14 (2.5%)
- Worked at home: 9 (1.6%)
- Unemployment by race in 2022
- Unemployment rate for White non-Hispanic residents
- 2.4%Males
- 6.7%Females
- Unemployment rate for two or more race residents
- 9.0%Males
- Unemployment rate for Hispanic or Latino residents
- 7.8%Males
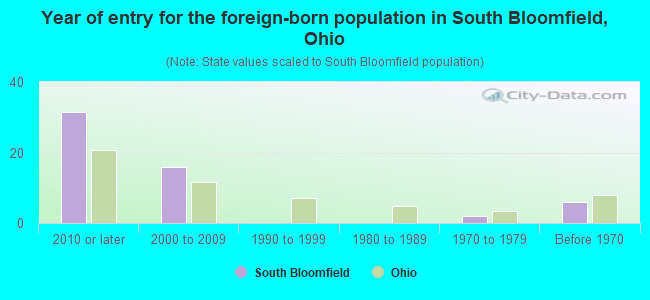
- Year of entry for the foreign-born population in South Bloomfield, Ohio
- 322010 or later
- 162000 to 2009
- 01990 to 1999
- 01980 to 1989
- 21970 to 1979
- 6Before 1970
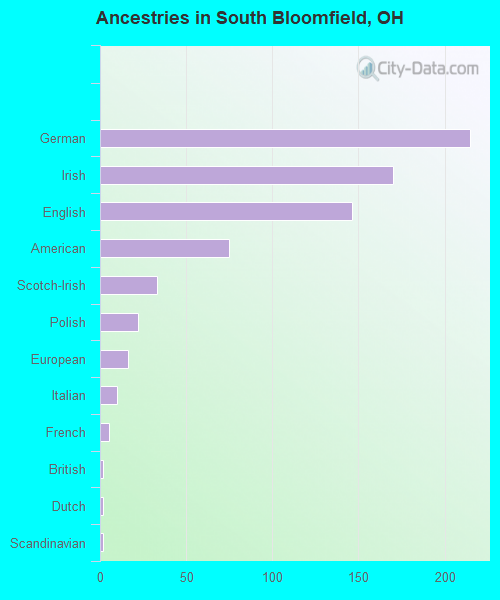
First ancestries reported:
- German: 215 (25.0%)
- Irish: 170 (19.7%)
- English: 146 (17.0%)
- American: 75 (8.7%)
- Scotch-Irish: 33 (3.8%)
- Polish: 22 (2.6%)
- European: 16 (1.9%)
- Italian: 10 (1.2%)
- French: 5 (0.6%)
- British: 2 (0.2%)
- Dutch: 2 (0.2%)
- Scandinavian: 2 (0.2%)
Most common places of birth for foreign-born residents (%):
| South Bloomfield: | 106.0% (53) |
| Ohio: | 7.8% (44,796) |
Place of birth for U.S.-born residents:
- This state: 2,045
- Other state: 564
- Northeast: 133
- Midwest: 68
- South: 299
- West: 61
86.0% of South Bloomfield residents lived in the same house 1 years ago.
Out of people who lived in different houses, 21.3% lived in this county.
Out of people who lived in different counties, 81.2% lived in Ohio.
| South Bloomfield: | 86.0% |
| State average: | 87.8% |
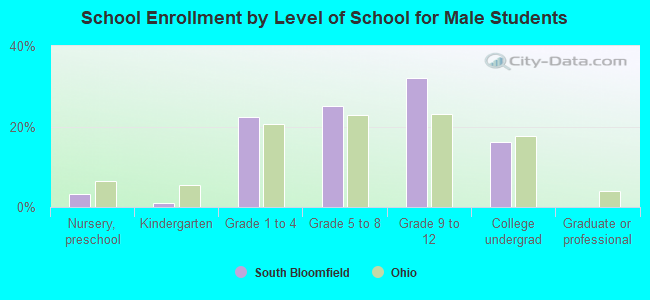
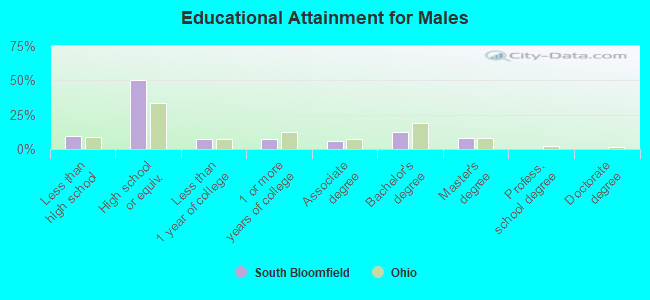
Education attainment for males 25 years and older:
- No schooling: 25
- Nursery to 4th grade: 0
- 5th and 6th grade: 0
- 7th and 8th grade: 16
- 9th grade: 9
- 10th grade: 19
- 11th grade: 0
- 12th grade, no diploma: 7
- High school graduate (or equivalency): 407
- Less than 1 year of college: 57
- Some college more than 1 year, no degree: 61
- Associate degree: 49
- Bachelor's degree: 98
- Master's degree: 63
- Professional school degree: 0
- Doctorate degree: 0
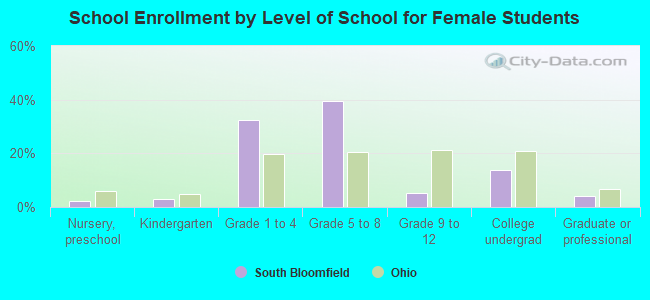
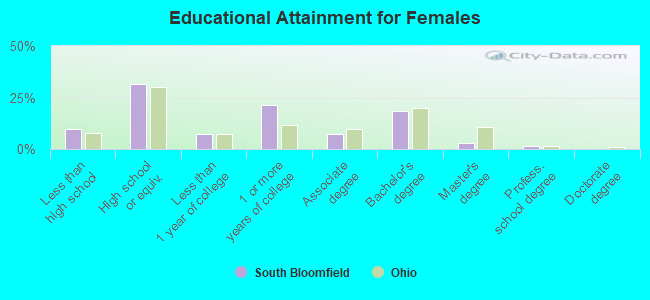
Education attainment for females 25 years and older:
- No schooling: 4
- Nursery to 4th grade: 0
- 5th and 6th grade: 0
- 7th and 8th grade: 12
- 9th grade: 17
- 10th grade: 23
- 11th grade: 3
- 12th grade, no diploma: 20
- High school graduate (or equivalency): 253
- Less than 1 year of college: 57
- Some college more than 1 year, no degree: 172
- Associate degree: 60
- Bachelor's degree: 149
- Master's degree: 24
- Professional school degree: 10
- Doctorate degree: 0
Housing units in structures:
- One, detached: 601
- One, attached: 32
- Two: 11
- 3 or 4: 6
- Mobile homes: 224
- Boats, RVs, vans, etc.: 21
Median worth of mobile homes: $21,143
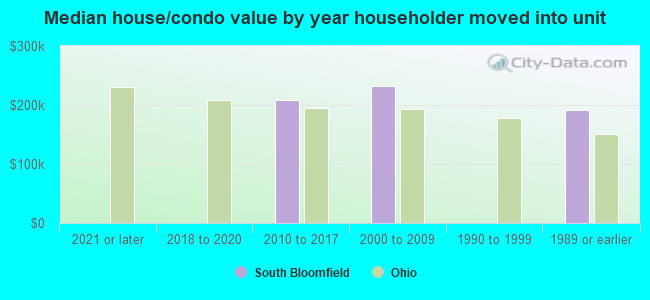
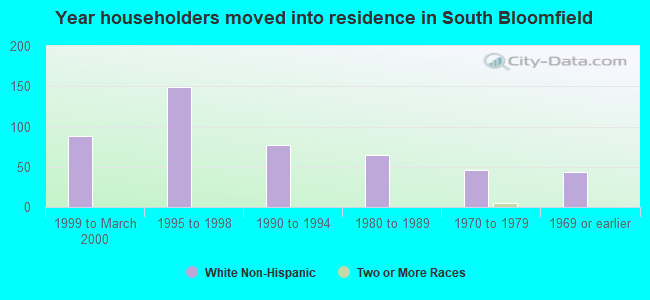
House/condo owner moved in on average 6 years ago
Renter moved in on average 7 years ago
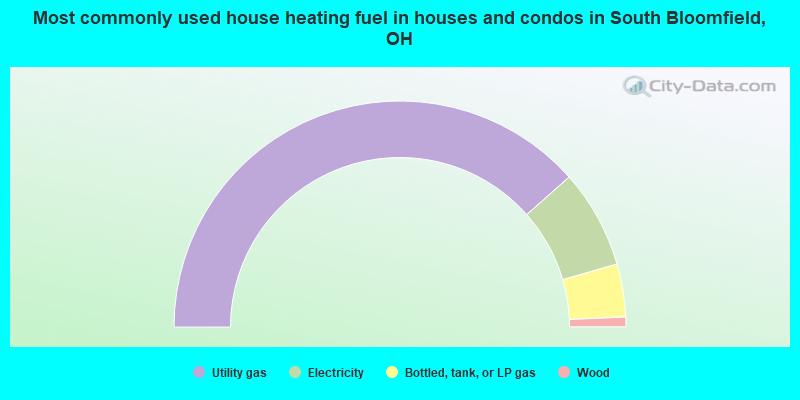
- 77.0%Utility gas
- 14.1%Electricity
- 7.6%Bottled, tank, or LP gas
- 1.4%Wood
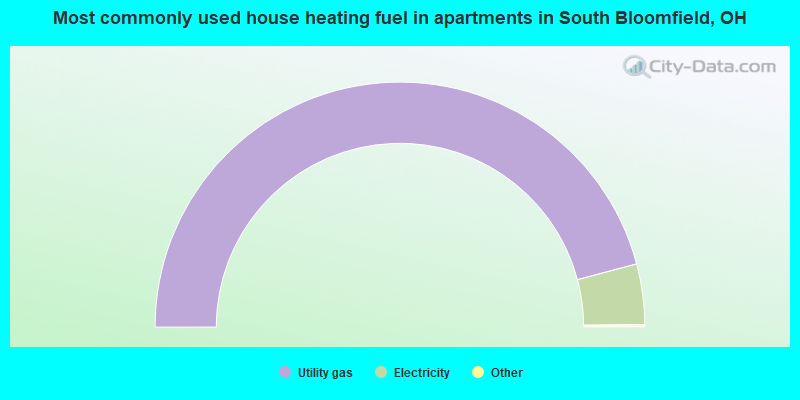
- 92.0%Utility gas
- 8.0%Electricity
Private vs. public school enrollment:
| Here: | 1.8% |
| Ohio: | 16.0% |
| Here: | 13.5% |
| Ohio: | 13.1% |
| Here: | 7.2% |
| Ohio: | 22.3% |