South Boston, VA (Virginia) Houses and Residents
| South Boston: | $154,007 |
| Virginia: | $365,700 |
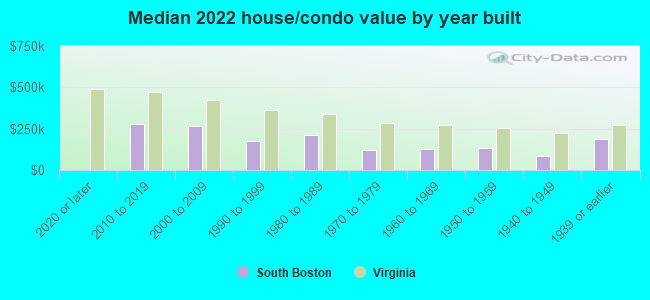
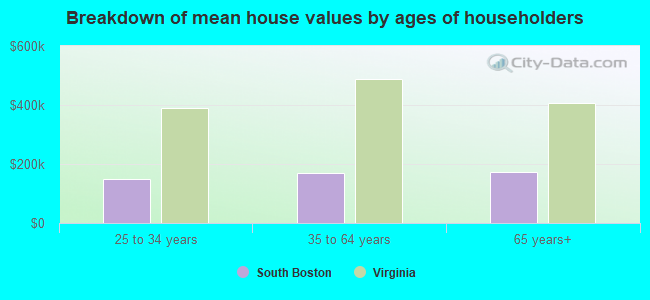
Mean price in 2022:
Detached houses: $220,122
Here: $220,122 State: $472,865 Mobile homes: $34,909
Here: $34,909 State: $100,736
Total population: 7,986 (Urban population: 7,550 (all inside urban clusters), Rural population: 803 (all nonfarm))
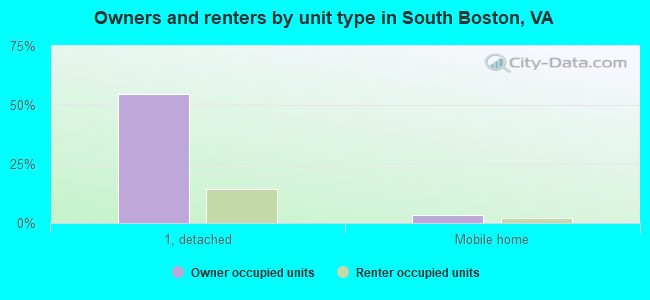
Houses: 3,785 (2,984 occupied: 1,601 owner occupied, 1,416 renter occupied)
| % of renters here: | 47% |
| State: | 33% |
Housing density: 310 houses/condos per square mile
Median price asked for vacant for-sale houses and condos in 2022 in this county: $221,563.
Median contract rent in 2022: $507 (lower quartile is $433, upper quartile is $604)
Median rent asked for vacant for-rent units in 2022: $547
Median gross rent in South Boston, VA in 2022: $703
Housing units in South Boston with a mortgage: 661 (28 second mortgage, 0 home equity loan, 14 both second mortgage and home equity loan)
Houses without a mortgage: 85
Median household income for houses/condos with a mortgage: $63,685
Median household income for apartments without a mortgage: $61,109
Median monthly housing costs: $655
Compare current foreclosures near South Boston, VA:
| Photo | Address | Area | Beds / Baths | Price | Details |
|---|---|---|---|---|---|

|
#1
Old Cluster Springs Rd
South Boston, VA 24592
|
1,568 sq. feet
|
2 baths 3 beds |
$224,900
|
show details |

|
#2
Lewis Ferrell Rd
South Boston, VA 24592
|
1,560 sq. feet
|
- baths 3 beds |
show details | |

|
#3
Spring Ave
South Boston, VA 24592
|
900 sq. feet
|
- baths 1 beds |
show details | |

|
#4
Watkins Ave
South Boston, VA 24592
|
1,020 sq. feet
|
- baths 2 beds |
show details | |

|
#5
Marshall Ave
South Boston, VA 24592
|
1,664 sq. feet
|
- baths 4 beds |
show details | |

|
#6
Halifax Rd
South Boston, VA 24592
|
2,058 sq. feet
|
- baths 4 beds |
show details | |

|
#7
Myrtle St
South Boston, VA 24592
|
1,080 sq. feet
|
- baths 3 beds |
show details | |

|
#8
Bold Springs Rd
South Boston, VA 24592
|
960 sq. feet
|
- baths 2 beds |
show details | |

|
#9
Grove Ave
South Boston, VA 24592
|
1,120 sq. feet
|
- baths 3 beds |
show details | |

|
#10
Irish St
South Boston, VA 24592
|
1,639 sq. feet
|
- baths 3 beds |
show details |
| Photo | Address | Area | Beds / Baths | Price | Details |
|---|---|---|---|---|---|

|
#11
E Forest Trl
South Boston, VA 24592
|
1,092 sq. feet
|
- baths 3 beds |
show details | |

|
#12
Wildflower Dr
South Boston, VA 24592
|
1,485 sq. feet
|
- baths 3 beds |
show details | |

|
#13
N Main St
South Boston, VA 24592
|
1,333 sq. feet
|
- baths 2 beds |
show details | |

|
#14
Eastover Dr
South Boston, VA 24592
|
1,032 sq. feet
|
- baths 3 beds |
show details | |

|
#15
N Main St
South Boston, VA 24592
|
2,252 sq. feet
|
- baths 3 beds |
show details | |

|
#16
Vaughan St
South Boston, VA 24592
|
- sq. feet
|
- baths - beds |
show details | |

|
#17
Old Grubby Rd
South Boston, VA 24592
|
- sq. feet
|
- baths - beds |
show details | |

|
#18
N Main St
South Boston, VA 24592
|
- sq. feet
|
- baths - beds |
show details | |

|
#19
Willow St
South Boston, VA 24592
|
- sq. feet
|
- baths - beds |
show details | |

|
#20
Chamberlain St
South Boston, VA 24592
|
- sq. feet
|
- baths - beds |
show details |
| Photo | Address | Area | Beds / Baths | Price | Details |
|---|---|---|---|---|---|

|
#21
Fenton St
South Boston, VA 24592
|
- sq. feet
|
- baths - beds |
show details | |

|
#22
Norwood Ave
South Boston, VA 24592
|
- sq. feet
|
- baths - beds |
show details | |

|
#23
Edmunds St
South Boston, VA 24592
|
- sq. feet
|
- baths - beds |
show details | |

|
#24
Jones Ferry Rd
South Boston, VA 24592
|
- sq. feet
|
- baths - beds |
show details | |

|
#25
South Ave
South Boston, VA 24592
|
- sq. feet
|
- baths - beds |
show details | |

|
#26
L P Bailey Memorial Hwy
Halifax, VA 24558
|
1,698 sq. feet
|
1 baths 3 beds |
show details | |

|
#27
Dryburg Rd
Scottsburg, VA 24589
|
1,782 sq. feet
|
2 baths 3 beds |
show details | |

|
#28
Henrys Mill Ct
Vernon Hill, VA 24597
|
3,174 sq. feet
|
3 baths 3 beds |
show details | |

|
#29
Glennie Irvin Rd
Semora, NC 27343
|
1,232 sq. feet
|
2 baths - beds |
show details | |

|
#30
Roy Frazier Rd
Oxford, NC 27565
|
1,568 sq. feet
|
- baths 3 beds |
show details |
| Photo | Address | Area | Beds / Baths | Price | Details |
|---|---|---|---|---|---|

|
#31
C P And L Access Rd.
Semora, NC 27343
|
1,025 sq. feet
|
1 baths - beds |
show details | |

|
#32
Black Walnut Rd
Randolph, VA 23962
|
1,568 sq. feet
|
- baths 3 beds |
show details | |

|
#33
Peartree Ln
Nathalie, VA 24577
|
1,568 sq. feet
|
- baths 3 beds |
show details | |

|
#34
Leda Rd
Nathalie, VA 24577
|
1,484 sq. feet
|
- baths 3 beds |
show details | |

|
#35
Red Bank Rd
Virgilina, VA 24598
|
1,296 sq. feet
|
- baths 3 beds |
show details | |

|
#36
Red Bank Rd
Virgilina, VA 24598
|
1,364 sq. feet
|
- baths 2 beds |
show details | |

|
#37
Mountain Rd
Vernon Hill, VA 24597
|
1,568 sq. feet
|
- baths 3 beds |
show details | |

|
#38
Reverend Coleman Rd
Clover, VA 24534
|
1,560 sq. feet
|
- baths 3 beds |
show details | |

|
#39
Macdonald Rd
Scottsburg, VA 24589
|
1,152 sq. feet
|
- baths 3 beds |
show details | |

|
#40
Glennie Irvin Rd
Semora, NC 27343
|
1,232 sq. feet
|
2 baths - beds |
show details |
| Photo | Address | Area | Beds / Baths | Price | Details |
|---|---|---|---|---|---|

|
#41
N Terrys Bridge Rd
Halifax, VA 24558
|
1,008 sq. feet
|
- baths 3 beds |
show details | |

|
#42
Mountain Rd
Halifax, VA 24558
|
1,976 sq. feet
|
- baths 3 beds |
show details | |

|
#43
Grubby Rd
Halifax, VA 24558
|
2,432 sq. feet
|
- baths 3 beds |
show details | |

|
#44
Chatham Rd
Halifax, VA 24558
|
1,268 sq. feet
|
- baths 3 beds |
show details | |

|
#45
Ball Park Loop
Halifax, VA 24558
|
744 sq. feet
|
- baths 4 beds |
show details | |

|
#46
White St # 18
Buffalo Junction, VA 24529
|
- sq. feet
|
- baths - beds |
show details | |

|
#47
Ridgeway Rd
Vernon Hill, VA 24597
|
- sq. feet
|
- baths - beds |
show details | |

|
#48
Kerns Mill Rd
Sutherlin, VA 24594
|
- sq. feet
|
- baths - beds |
show details | |

|
#49
Williamson Farm Rd
Buffalo Junction, VA 24529
|
- sq. feet
|
- baths - beds |
show details | |

|
Check over 1 million property listings on Foreclosure.com!
|
browse all offers | |||


 | Pimmit Hills Builder tearing down 22 homes (50 replies) |
| Southern Virginia and Northern Virginia like two different states (33 replies) |
| South Boston, VA vs Roxboro, Nc (20 replies) |
| South Boston VA (10 replies) |
| Retire to...South Boston? Kenbridge? Lynchburg? Clarksville ? (48 replies) |
| Tri-quad level homes? (7 replies) |

Median year apartment built: 1967
Household type by relationship:
Households: 7,996- Male householders: 808 (308 living alone), Female householders: 2,147 (882 living alone)
834 spouses (834 opposite-sex spouses), 159 unmarried partners, (159 opposite-sex unmarried partners), 2,532 children (2,486 natural, 32 adopted, 13 stepchildren), 126 grandchildren, 91 brothers or sisters, 157 parents, 0 foster children, 179 other relatives, 233 non-relatives
- In group quarters: 725
Size of family households: 798 2-persons, 508 3-persons, 263 4-persons, 93 5-persons, 14 6-persons, 6 7-or-more-persons.
Size of nonfamily households: 1,224 1-person, 91 2-persons, 14 3-persons.
663 married couples with children.
1,249 single-parent households (41 men, 1,208 women).
96.7% of residents of South Boston speak English at home.
0.8% of residents speak Spanish at home (79% speak English very well, 7% speak English well, 14% speak English not well).
0.5% of residents speak other Indo-European language at home (100% speak English very well).
0.5% of residents speak Asian or Pacific Island language at home (94% speak English very well, 6% speak English well).
1.7% of residents speak other language at home (100% speak English very well).
Foreign born population: 205 (2.6%)
(55.6% of them are naturalized citizens)
| Here: | 6.6 |
| State: | 7.0 |
| Here: | 4.4 |
| State: | 4.3 |
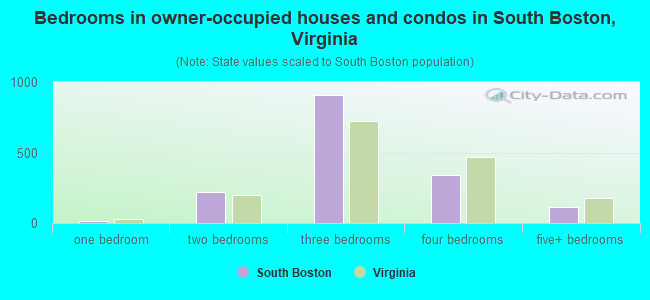
- Bedrooms in owner-occupied houses and condos in South Boston, Virginia
- 0no bedroom
- 171 bedroom
- 2202 bedrooms
- 9063 bedrooms
- 3414 bedrooms
- 1165+ bedrooms
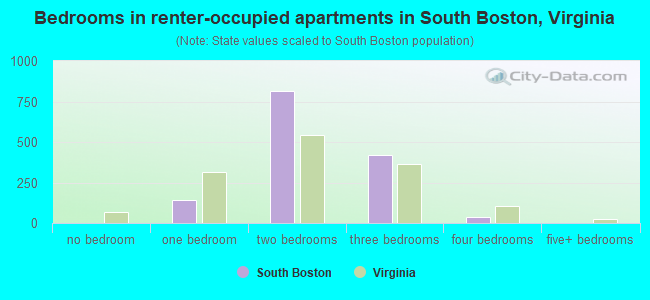
- Bedrooms in renter-occupied apartments in South Boston, Virginia
- 0no bedroom
- 1421 bedroom
- 8152 bedrooms
- 4193 bedrooms
- 404 bedrooms
- 05+ bedrooms
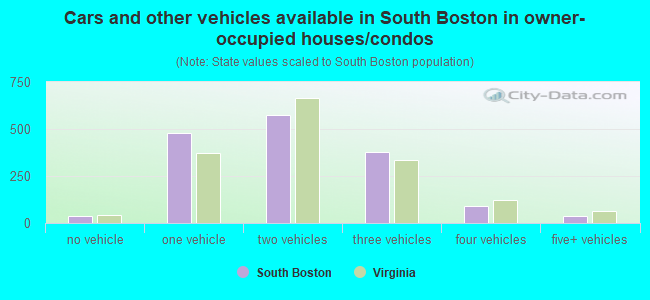
- Cars and other vehicles available in South Boston in owner-occupied houses/condos
- 39no vehicle
- 4791 vehicle
- 5752 vehicles
- 3783 vehicles
- 924 vehicles
- 375+ vehicles
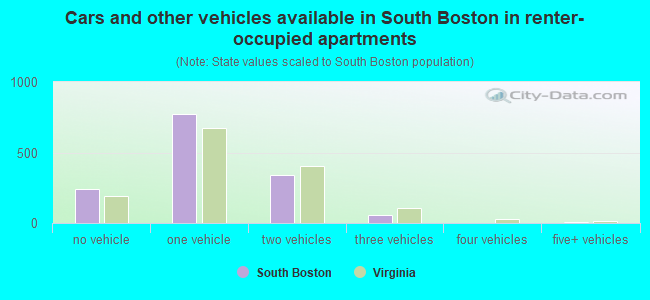
- Cars and other vehicles available in South Boston in renter-occupied apartments
- 239no vehicle
- 7721 vehicle
- 3412 vehicles
- 573 vehicles
- 04 vehicles
- 75+ vehicles
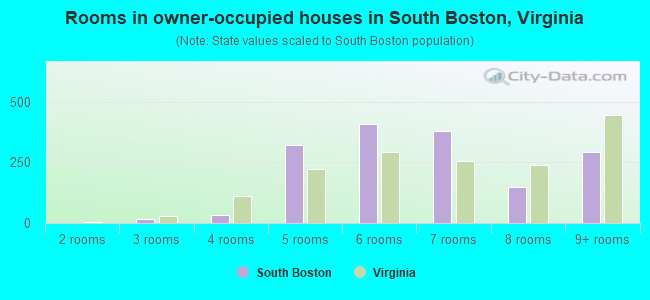
- Rooms in owner-occupied houses in South Boston, Virginia
- 01 room
- 02 rooms
- 173 rooms
- 354 rooms
- 3235 rooms
- 4066 rooms
- 3807 rooms
- 1488 rooms
- 2929+ rooms
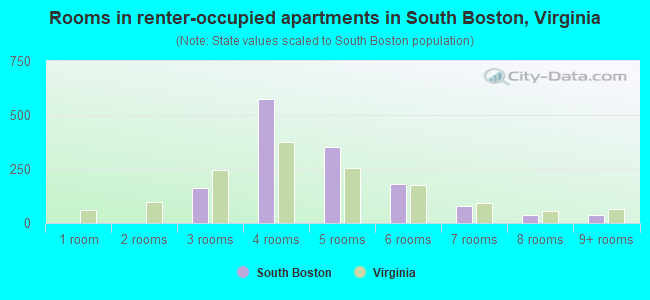
- Rooms in renter-occupied apartments in South Boston, Virginia
- 01 room
- 02 rooms
- 1613 rooms
- 5724 rooms
- 3525 rooms
- 1796 rooms
- 777 rooms
- 358 rooms
- 399+ rooms
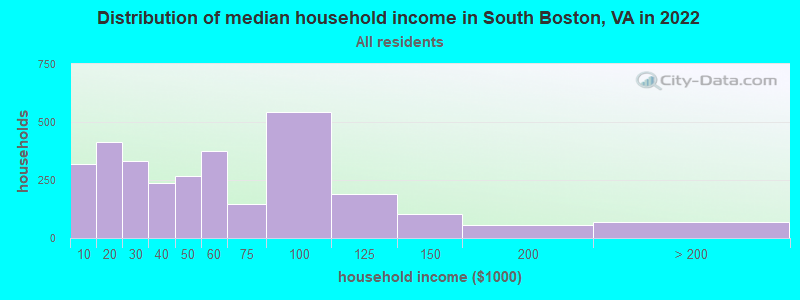
South Boston, VA household income distribution

- 317Less than $10,000
- 412$10,000 to $19,999
- 333$20,000 to $29,999
- 236$30,000 to $39,999
- 269$40,000 to $49,999
- 376$50,000 to $59,999
- 147$60,000 to $74,999
- 543$75,000 to $99,999
- 190$100,000 to $124,999
- 103$125,000 to $149,999
- 56$150,000 to $199,999
- 71$200,000 or more
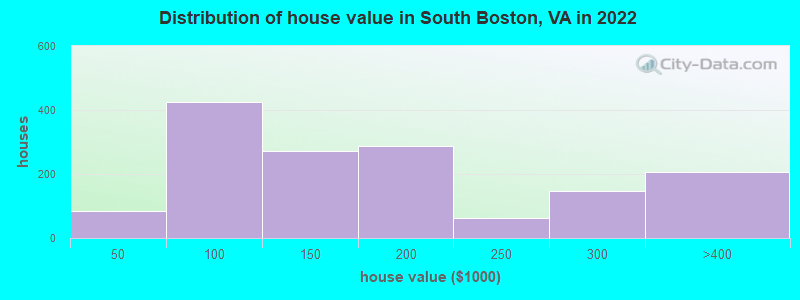
Home value of owner - occupied houses in 2022 in South Boston, VA
-
- 13$10,000 to $14,999
- 11$20,000 to $24,999
- 10$30,000 to $34,999
- 8$35,000 to $39,999
- 39$40,000 to $49,999
- 51$50,000 to $59,999
- 32$60,000 to $69,999
- 174$70,000 to $79,999
- 39$80,000 to $89,999
- 87$90,000 to $99,999
- 178$100,000 to $124,999
- 95$125,000 to $149,999
- 136$150,000 to $174,999
- 152$175,000 to $199,999
- 63$200,000 to $249,999
- 146$250,000 to $299,999
- 206$300,000 to $399,999
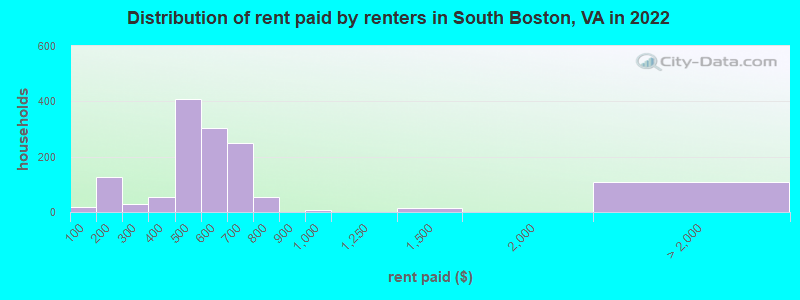
Rent paid by renters in 2022 in South Boston, VA
-
- 16Less than $100
- 20$100 to $149
- 107$150 to $199
- 17$200 to $249
- 10$250 to $299
- 14$300 to $349
- 40$350 to $399
- 166$400 to $449
- 240$450 to $499
- 180$500 to $549
- 122$550 to $599
- 122$600 to $649
- 127$650 to $699
- 52$700 to $749
- 9$900 to $999
- 12$1,250 to $1,499
- 107No cash rent
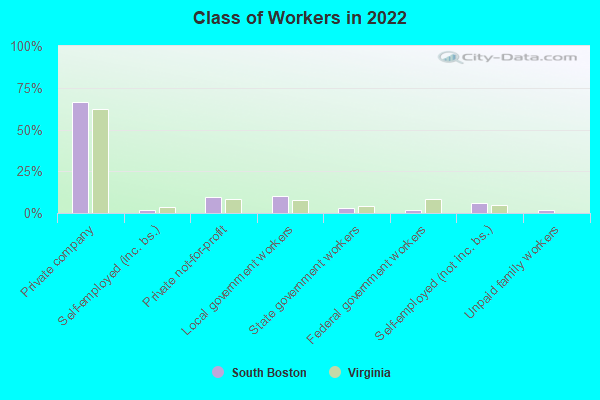
Percentage of workers working in this county: 92.7%
Number of people working at home: 146 (5.2% of all workers)
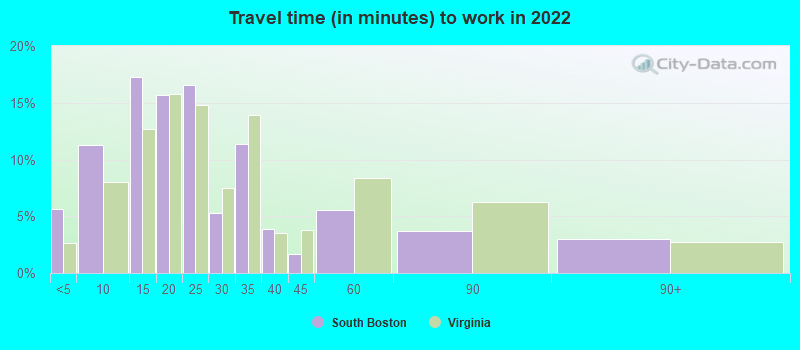
Travel time to work (commute)
- Less than 5 minutes: 318
- 5 to 9 minutes: 696
- 10 to 14 minutes: 923
- 15 to 19 minutes: 231
- 20 to 24 minutes: 126
- 25 to 29 minutes: 0
- 30 to 34 minutes: 110
- 35 to 39 minutes: 27
- 40 to 44 minutes: 46
- 45 to 59 minutes: 83
- 60 to 89 minutes: 76
- 90 or more minutes: 10
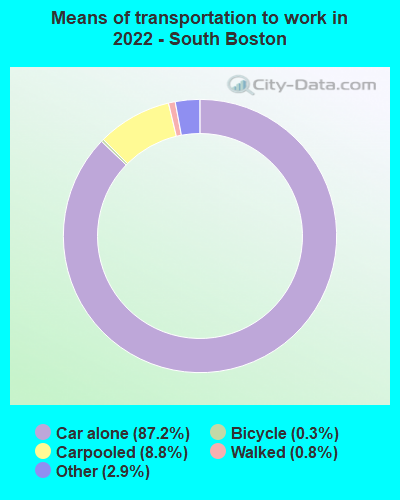
Means of transportation to work:
- Drove a car alone: 4,558 (81.3%)
- Carpooled: 468 (8.3%)
- Bus: 2 (0.0%)
- Taxi: 183 (3.3%)
- Bicycle: 15 (0.3%)
- Walked: 43 (0.8%)
- Worked at home: 146 (2.6%)
- Unemployment by race in 2022
- Unemployment rate for White non-Hispanic residents
- 3.4%Males
- Unemployment rate for Black residents
- 9.6%Males
- 3.5%Females
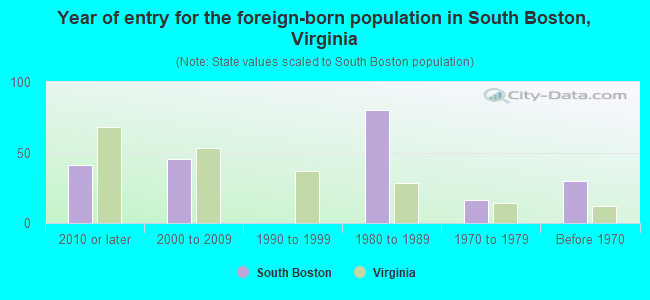
- Year of entry for the foreign-born population in South Boston, Virginia
- 412010 or later
- 462000 to 2009
- 01990 to 1999
- 801980 to 1989
- 161970 to 1979
- 30Before 1970
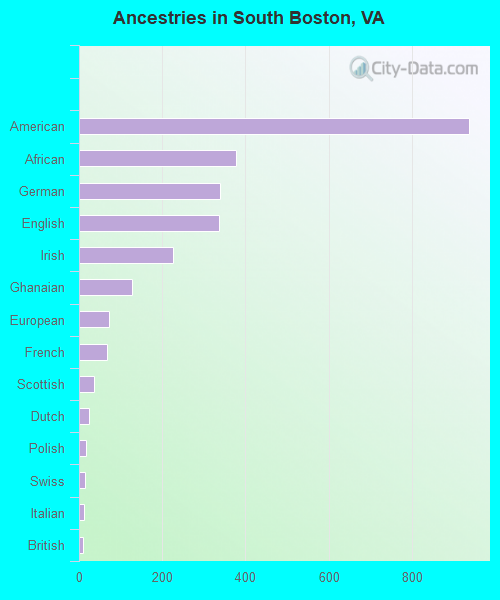
First ancestries reported:
- American: 939 (15.5%)
- African: 377 (6.2%)
- German: 340 (5.6%)
- English: 337 (5.6%)
- Irish: 227 (3.8%)
- Ghanaian: 128 (2.1%)
- European: 71 (1.2%)
- French: 68 (1.1%)
- Scottish: 37 (0.6%)
- Dutch: 24 (0.4%)
- Polish: 18 (0.3%)
- Swiss: 14 (0.2%)
- Italian: 11 (0.2%)
- British: 9 (0.1%)
- Lebanese: 6 (0.10%)
- Eastern European: 6 (0.10%)
- Welsh: 5 (0.08%)
Most common places of birth for foreign-born residents (%):
| South Boston: | 33.7% (69) |
| Virginia: | 0.8% (8,513) |
| South Boston: | 27.8% (57) |
| Virginia: | 1.6% (17,346) |
| South Boston: | 12.7% (26) |
| Virginia: | 4.8% (52,629) |
| South Boston: | 7.3% (15) |
| Virginia: | 1.3% (14,435) |
| South Boston: | 5.9% (12) |
| Virginia: | 4.2% (45,750) |
| South Boston: | 5.4% (11) |
| Virginia: | 5.3% (57,498) |
| South Boston: | 2.9% (6) |
| Virginia: | 4.9% (52,857) |
| South Boston: | 2.4% (5) |
| Virginia: | 0.5% (5,428) |
Place of birth for U.S.-born residents:
- This state: 5,912
- Other state: 1,811
- Northeast: 835
- Midwest: 180
- South: 732
- West: 57
91.5% of South Boston residents lived in the same house 1 years ago.
Out of people who lived in different houses, 32.2% lived in this county.
Out of people who lived in different counties, 22.8% lived in Virginia.
| South Boston: | 91.5% |
| State average: | 86.6% |
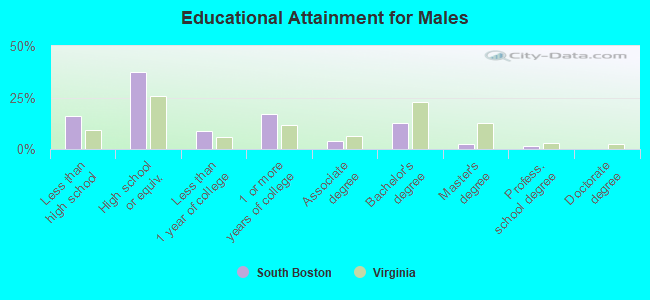
Education attainment for males 25 years and older:
- No schooling: 19
- Nursery to 4th grade: 0
- 5th and 6th grade: 0
- 7th and 8th grade: 40
- 9th grade: 0
- 10th grade: 102
- 11th grade: 146
- 12th grade, no diploma: 47
- High school graduate (or equivalency): 828
- Less than 1 year of college: 199
- Some college more than 1 year, no degree: 383
- Associate degree: 88
- Bachelor's degree: 283
- Master's degree: 55
- Professional school degree: 37
- Doctorate degree: 0
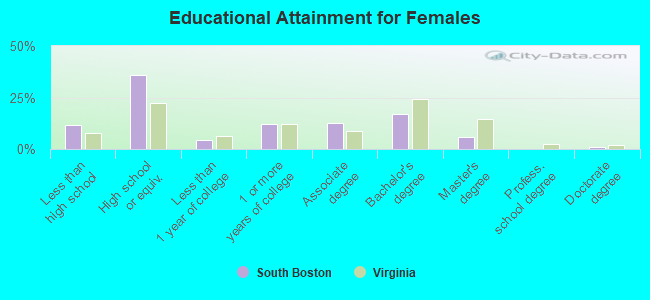
Education attainment for females 25 years and older:
- No schooling: 68
- Nursery to 4th grade: 0
- 5th and 6th grade: 9
- 7th and 8th grade: 76
- 9th grade: 38
- 10th grade: 34
- 11th grade: 124
- 12th grade, no diploma: 10
- High school graduate (or equivalency): 1,120
- Less than 1 year of college: 142
- Some college more than 1 year, no degree: 371
- Associate degree: 390
- Bachelor's degree: 527
- Master's degree: 174
- Professional school degree: 7
- Doctorate degree: 24


Housing units in structures:
- One, detached: 2,747
- One, attached: 165
- Two: 38
- 3 or 4: 387
- 5 to 9: 193
- 10 to 19: 38
- 20 to 49: 93
- 50 or more: 17
- Mobile homes: 103
Housing units lacking complete kitchen facilities in 2022: 2.8%
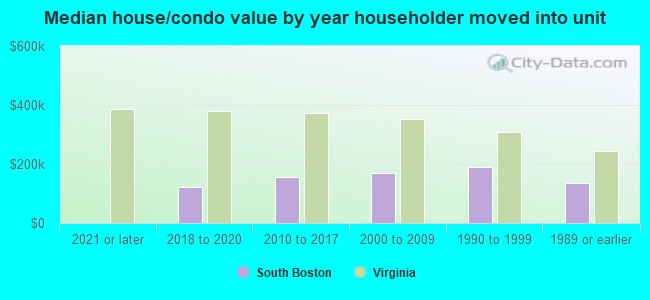
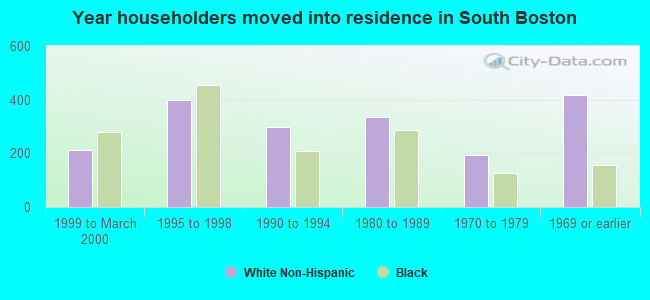
House/condo owner moved in on average 20 years ago
Renter moved in on average 6 years ago
- 68.8%Electricity
- 19.6%Fuel oil, kerosene, etc.
- 7.2%Bottled, tank, or LP gas
- 3.3%No fuel used
- 1.1%Wood
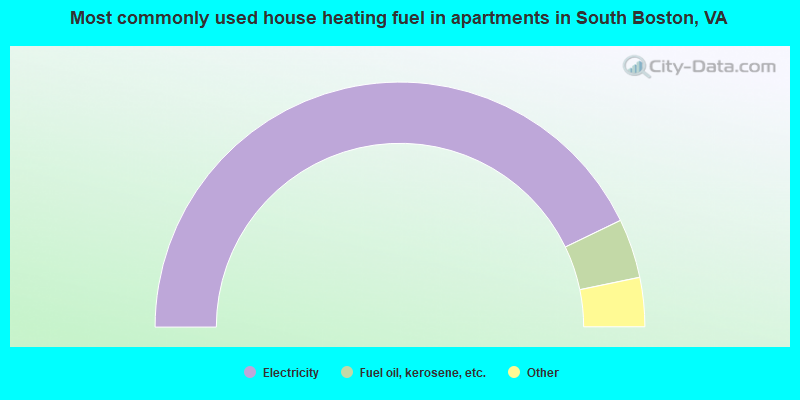
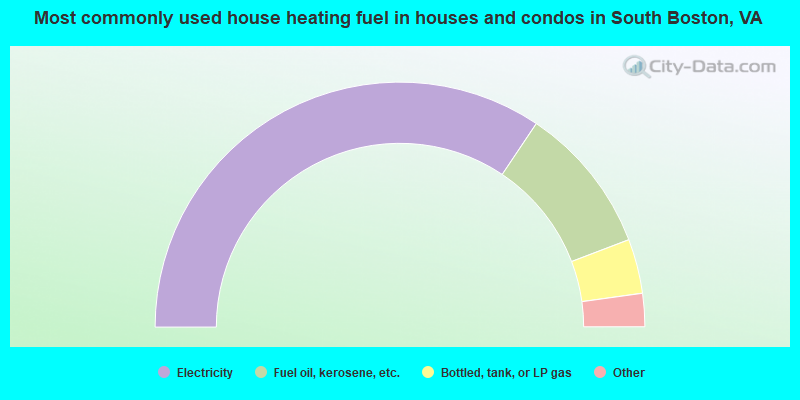
- 85.6%Electricity
- 7.8%Fuel oil, kerosene, etc.
- 3.8%Bottled, tank, or LP gas
- 1.3%Utility gas
- 0.9%Other fuel
- 0.6%No fuel used
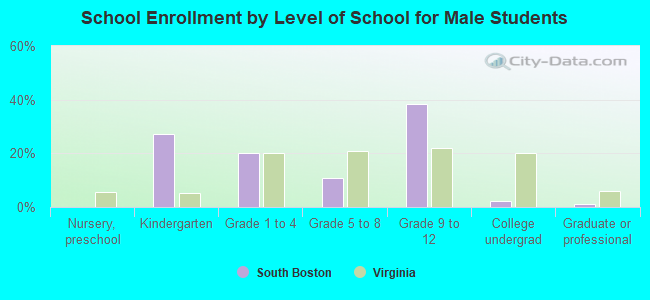
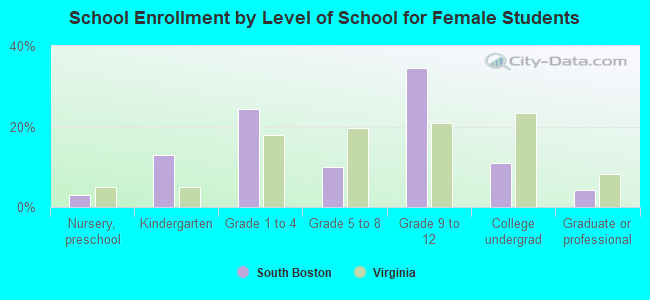
Private vs. public school enrollment:
| Here: | 8.2% |
| Virginia: | 13.2% |
| Here: | 13.3% |
| Virginia: | 10.2% |
| Here: | 10.6% |
| Virginia: | 18.7% |