South Coventry, CT (Connecticut) Houses and Residents
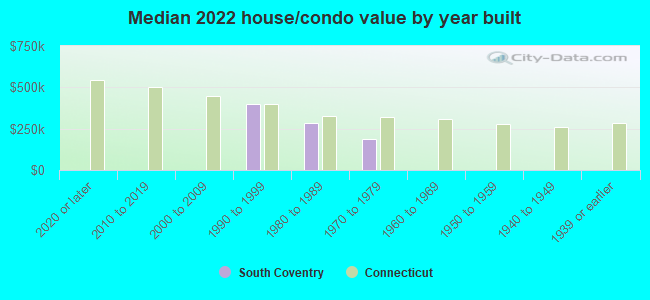
| South Coventry: | $336,689 |
| Connecticut: | $347,200 |
Total population: 1,483 (Urban population: 1,135 (all inside urban clusters), Rural population: 193 (all nonfarm))
Houses: 668 (651 occupied: 536 owner occupied, 122 renter occupied)
| % of renters here: | 19% |
| State: | 34% |
Housing density: 208 houses/condos per square mile
Median price asked for vacant for-sale houses and condos in 2022 in this county: $251,692.
Median contract rent in 2022: $757 (lower quartile is $541, upper quartile is $801)
Median rent asked for vacant for-rent units in 2022: $1,054
Median gross rent in South Coventry, CT in 2022: $859
Housing units in South Coventry with a mortgage: 234 (23 second mortgage, 0 home equity loan, 23 both second mortgage and home equity loan)
Houses without a mortgage: 0
Median household income for houses/condos with a mortgage: $93,243
Median household income for apartments without a mortgage: $104,099
Median monthly housing costs: $1,109
Compare current foreclosures near South Coventry, CT:
| Photo | Address | Area | Beds / Baths | Price | Details |
|---|---|---|---|---|---|

|
#1
Talcott Ave
Vernon Rockville, CT 06066
|
1,832 sq. feet
|
2 baths 4 beds |
$148,000
|
show details |

|
#2
Mountain Rd
Stafford Springs, CT 06076
|
1,235 sq. feet
|
2 baths 3 beds |
$299,900
|
show details |

|
#3
Westchester Rd
Colchester, CT 06415
|
900 sq. feet
|
1 baths 2 beds |
$309,900
|
show details |

|
#4
Shares Ln
South Windsor, CT 06074
|
1,850 sq. feet
|
2 baths 4 beds |
$385,000
|
show details |

|
#5
Tolland Ave
Stafford Springs, CT 06076
|
896 sq. feet
|
1 baths 3 beds |
$100,000
|
show details |

|
#6
Middle Tpke E
Manchester, CT 06040
|
1,310 sq. feet
|
1 baths 4 beds |
$279,900
|
show details |

|
#7
Main St
Coventry, CT 06238
|
2,398 sq. feet
|
2 baths 3 beds |
$359,900
|
show details |

|
#8
Irving St
Manchester, CT 06042
|
1,335 sq. feet
|
2 baths 3 beds |
$265,000
|
show details |

|
#9
Newberry Rd
South Windsor, CT 06074
|
3,386 sq. feet
|
2 baths 4 beds |
$669,900
|
show details |

|
#10
Route 87
Columbia, CT 06237
|
1,796 sq. feet
|
1 baths 3 beds |
show details |
| Photo | Address | Area | Beds / Baths | Price | Details |
|---|---|---|---|---|---|

|
#11
Bell Ct Apt C1
East Hartford, CT 06108
|
890 sq. feet
|
1 baths 2 beds |
show details | |

|
#12
Leonard Bridge Rd
Lebanon, CT 06249
|
1,798 sq. feet
|
1 baths 2 beds |
show details | |

|
#13
Ferncrest Dr
East Hartford, CT 06118
|
1,890 sq. feet
|
3 baths 4 beds |
show details | |

|
#14
Avalon Ln
Marlborough, CT 06447
|
3,740 sq. feet
|
2 baths 4 beds |
show details | |

|
#15
Hope Valley Rd
Amston, CT 06231
|
2,128 sq. feet
|
2 baths 3 beds |
show details | |

|
#16
Colburn Rd
Stafford Springs, CT 06076
|
1,114 sq. feet
|
1 baths 2 beds |
show details | |

|
#17
Llynwood Dr
Bolton, CT 06043
|
1,335 sq. feet
|
1 baths 4 beds |
show details | |

|
#18
Mansfield Ave
Willimantic, CT 06226
|
920 sq. feet
|
1 baths 3 beds |
show details | |

|
#19
Hollister Dr
East Hartford, CT 06118
|
1,300 sq. feet
|
1 baths 3 beds |
show details | |

|
#20
Park Rd
Marlborough, CT 06447
|
1,134 sq. feet
|
1 baths 3 beds |
show details |
| Photo | Address | Area | Beds / Baths | Price | Details |
|---|---|---|---|---|---|

|
#21
Main St
Somers, CT 06071
|
3,092 sq. feet
|
2 baths 3 beds |
show details | |

|
#22
Circle Dr
Mansfield Center, CT 06250
|
1,152 sq. feet
|
1 baths 3 beds |
show details | |

|
#23
Bausola Rd
Andover, CT 06232
|
2,324 sq. feet
|
2 baths 4 beds |
show details | |

|
#24
Route 66
Columbia, CT 06237
|
932 sq. feet
|
1 baths 2 beds |
show details | |

|
#25
Kennedy Dr
Colchester, CT 06415
|
1,132 sq. feet
|
2 baths 3 beds |
show details | |

|
#26
Heron Rd
East Hartford, CT 06118
|
1,238 sq. feet
|
1 baths 3 beds |
show details | |

|
#27
Conestoga Way
Glastonbury, CT 06033
|
1,360 sq. feet
|
2 baths 3 beds |
show details | |

|
#28
Old Monson Rd
Stafford Springs, CT 06076
|
3,698 sq. feet
|
3 baths 6 beds |
show details | |

|
#29
Higbie Dr
East Hartford, CT 06108
|
1,081 sq. feet
|
2 baths 2 beds |
show details | |

|
#30
Woodlawn Cir
East Hartford, CT 06108
|
1,826 sq. feet
|
2 baths 5 beds |
show details |
| Photo | Address | Area | Beds / Baths | Price | Details |
|---|---|---|---|---|---|

|
#31
Hillcrest Rd
East Hartford, CT 06108
|
1,882 sq. feet
|
1 baths 4 beds |
show details | |

|
#32
Forest St
East Hartford, CT 06118
|
1,040 sq. feet
|
2 baths 3 beds |
show details | |

|
#33
Chester St
East Hartford, CT 06108
|
1,344 sq. feet
|
2 baths 3 beds |
show details | |

|
#34
Burke St
East Hartford, CT 06118
|
1,058 sq. feet
|
1 baths 3 beds |
show details | |

|
#35
Mulcahy Dr
East Hartford, CT 06118
|
1,703 sq. feet
|
1 baths 3 beds |
show details | |

|
#36
Hopyard Rd
Stafford Springs, CT 06076
|
1,792 sq. feet
|
2 baths 3 beds |
show details | |

|
#37
Saner Rd
Marlborough, CT 06447
|
2,386 sq. feet
|
2 baths 4 beds |
show details | |

|
#38
Hopyard Rd
Stafford Springs, CT 06076
|
1,908 sq. feet
|
2 baths 4 beds |
show details | |

|
#39
White Birch Rd
East Hampton, CT 06424
|
1,729 sq. feet
|
1 baths 2 beds |
show details | |

|
#40
Park Ave
Colchester, CT 06415
|
1,224 sq. feet
|
1 baths 3 beds |
show details |
| Photo | Address | Area | Beds / Baths | Price | Details |
|---|---|---|---|---|---|

|
#41
Roberts Rd
Marlborough, CT 06447
|
1,881 sq. feet
|
1 baths 3 beds |
show details | |

|
#42
Joan Cir
Manchester, CT 06040
|
1,856 sq. feet
|
2 baths 3 beds |
show details | |

|
#43
Route 32
North Franklin, CT 06254
|
1,152 sq. feet
|
1 baths 3 beds |
show details | |

|
#44
Robinson Hill Rd
North Franklin, CT 06254
|
739 sq. feet
|
1 baths 2 beds |
show details | |

|
#45
Route 32
North Franklin, CT 06254
|
1,152 sq. feet
|
1 baths 3 beds |
show details | |

|
#46
East St
Stafford Springs, CT 06076
|
936 sq. feet
|
1 baths 3 beds |
show details | |

|
#47
Willington Ave
Stafford Springs, CT 06076
|
1,550 sq. feet
|
2 baths 4 beds |
show details | |

|
#48
Center St
Manchester, CT 06040
|
1,008 sq. feet
|
1 baths 3 beds |
show details | |

|
#49
Clearview Dr
Stafford Springs, CT 06076
|
1,576 sq. feet
|
2 baths 3 beds |
show details | |

|
Check over 1 million property listings on Foreclosure.com!
|
browse all offers | |||


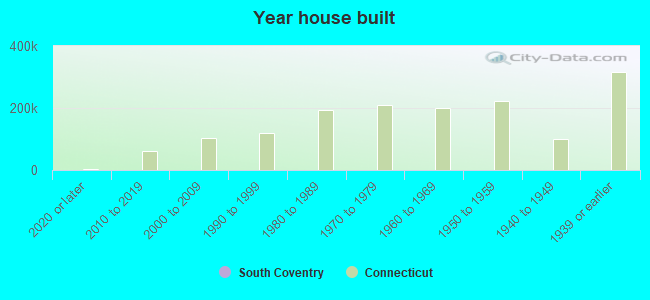
Median year apartment built: 1961
Household type by relationship:
Households: 1,474- Male householders: 142 (0 living alone), Female householders: 508 (65 living alone)
448 spouses (448 opposite-sex spouses), 0 unmarried partners, (0 opposite-sex unmarried partners), 278 children (278 natural, 0 adopted, 0 stepchildren), 0 grandchildren, 0 brothers or sisters, 14 parents, 43 foster children, 0 other relatives, 15 non-relatives
- In group quarters: 24
Size of family households: 371 2-persons, 93 3-persons, 42 4-persons, 32 5-persons.
Size of nonfamily households: 68 1-person, 43 2-persons.
121 married couples with children.
119 single-parent households (0 men, 119 women).
98.4% of residents of South Coventry speak English at home.
1.2% of residents speak other Indo-European language at home (100% speak English very well).
Foreign born population: 178 (12.1%)
(14.0% of them are naturalized citizens)
| Here: | 7.3 |
| State: | 6.5 |
| Here: | 2.8 |
| State: | 4.0 |
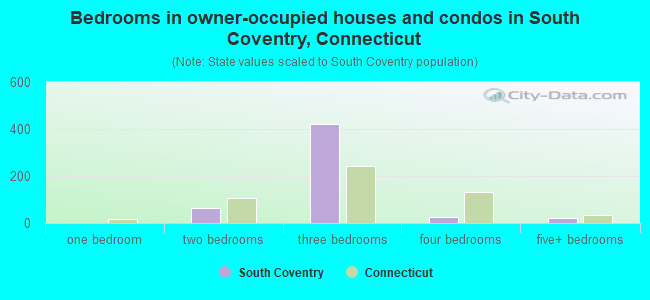
- Bedrooms in owner-occupied houses and condos in South Coventry, Connecticut
- 0no bedroom
- 01 bedroom
- 642 bedrooms
- 4233 bedrooms
- 274 bedrooms
- 225+ bedrooms
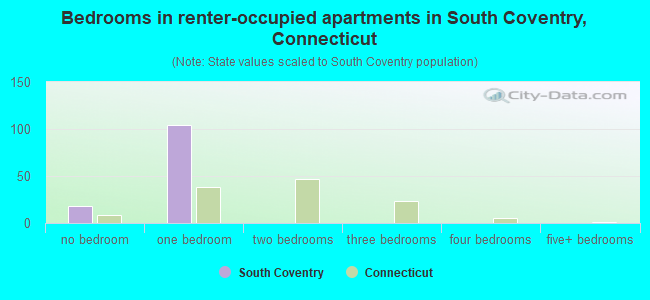
- Bedrooms in renter-occupied apartments in South Coventry, Connecticut
- 18no bedroom
- 1041 bedroom
- 02 bedrooms
- 03 bedrooms
- 04 bedrooms
- 05+ bedrooms
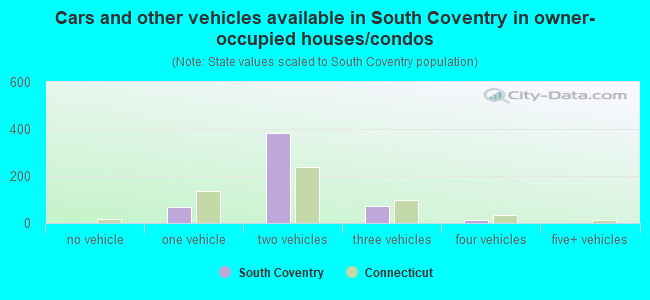
- Cars and other vehicles available in South Coventry in owner-occupied houses/condos
- 0no vehicle
- 671 vehicle
- 3812 vehicles
- 743 vehicles
- 144 vehicles
- 05+ vehicles
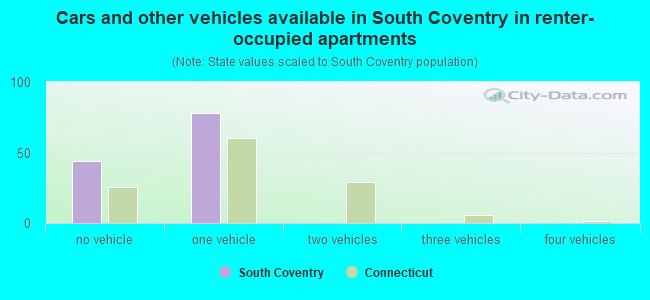
- Cars and other vehicles available in South Coventry in renter-occupied apartments
- 44no vehicle
- 781 vehicle
- 02 vehicles
- 03 vehicles
- 04 vehicles
- 05+ vehicles
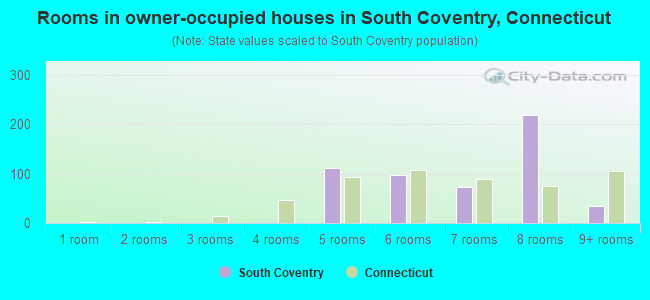
- Rooms in owner-occupied houses in South Coventry, Connecticut
- 01 room
- 02 rooms
- 03 rooms
- 04 rooms
- 1125 rooms
- 976 rooms
- 747 rooms
- 2208 rooms
- 359+ rooms
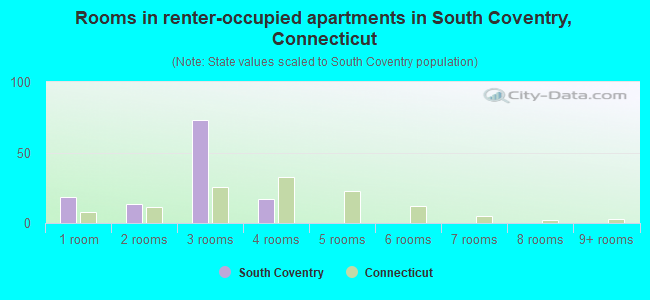
- Rooms in renter-occupied apartments in South Coventry, Connecticut
- 181 room
- 132 rooms
- 733 rooms
- 174 rooms
- 05 rooms
- 06 rooms
- 07 rooms
- 08 rooms
- 09+ rooms
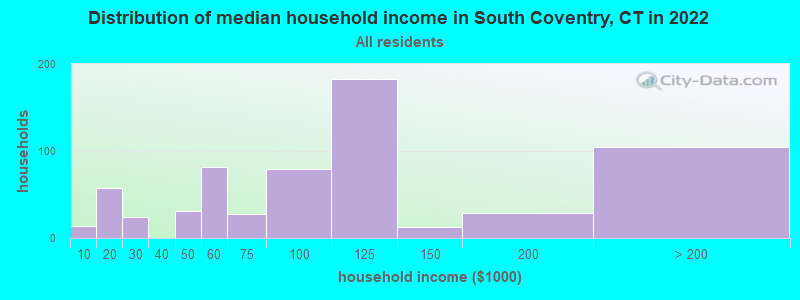
South Coventry, CT household income distribution

- 14Less than $10,000
- 58$10,000 to $19,999
- 24$20,000 to $29,999
- 31$40,000 to $49,999
- 82$50,000 to $59,999
- 28$60,000 to $74,999
- 79$75,000 to $99,999
- 183$100,000 to $124,999
- 13$125,000 to $149,999
- 29$150,000 to $199,999
- 105$200,000 or more
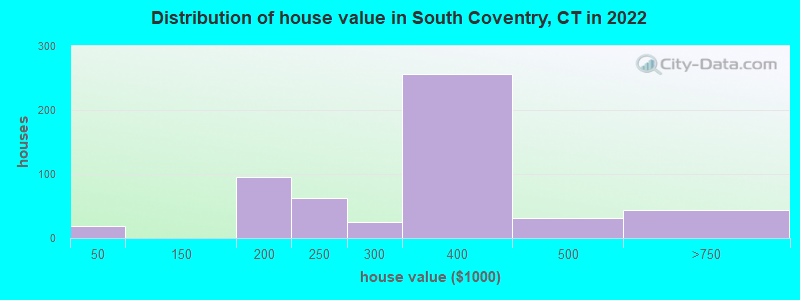
Home value of owner - occupied houses in 2022 in South Coventry, CT
-
- 19Less than $10,000
- 42$150,000 to $174,999
- 52$175,000 to $199,999
- 63$200,000 to $249,999
- 25$250,000 to $299,999
- 255$300,000 to $399,999
- 32$400,000 to $499,999
- 42$500,000 to $749,999
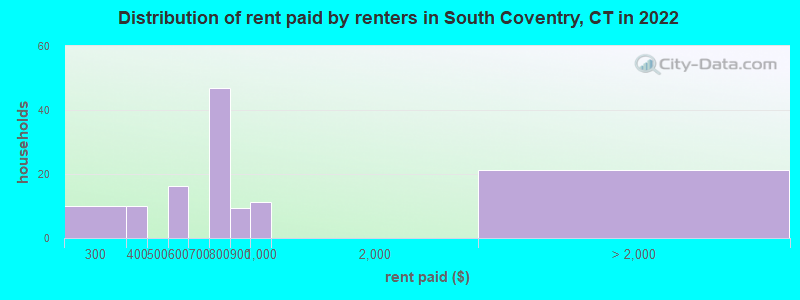
Rent paid by renters in 2022 in South Coventry, CT
-
- 9$250 to $299
- 10$350 to $399
- 16$550 to $599
- 46$750 to $799
- 9$800 to $899
- 11$900 to $999
- 21No cash rent
Percentage of workers working in this county: 85.7%
Number of people working at home: 48 (8.3% of all workers)
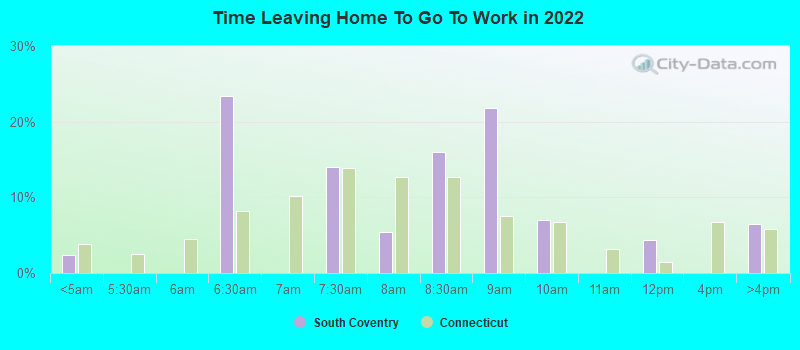
Travel time to work (commute)
- Less than 5 minutes: 1
- 5 to 9 minutes: 17
- 10 to 14 minutes: 105
- 15 to 19 minutes: 32
- 20 to 24 minutes: 12
- 25 to 29 minutes: 52
- 30 to 34 minutes: 51
- 35 to 39 minutes: 45
- 40 to 44 minutes: 64
- 45 to 59 minutes: 103
- 60 to 89 minutes: 36
- 90 or more minutes: 0
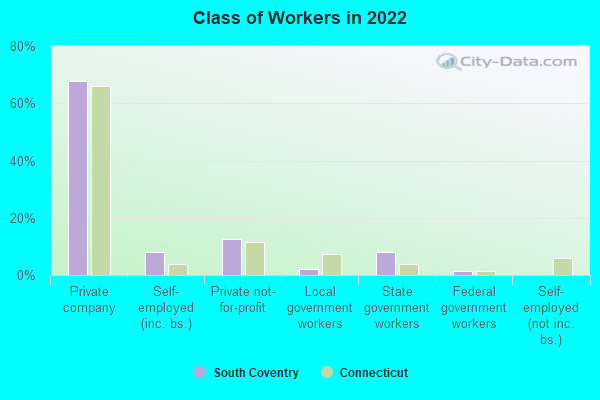
Means of transportation to work:
- Drove a car alone: 512 (84.1%)
- Carpooled: 60 (9.9%)
- Walked: 15 (2.5%)
- Worked at home: 22 (3.6%)
- Unemployment by race in 2022
- Unemployment rate for White non-Hispanic residents
- 4.0%Females
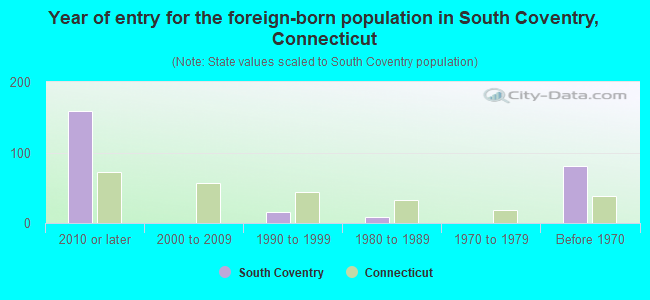
- Year of entry for the foreign-born population in South Coventry, Connecticut
- 1592010 or later
- 02000 to 2009
- 161990 to 1999
- 81980 to 1989
- 01970 to 1979
- 81Before 1970
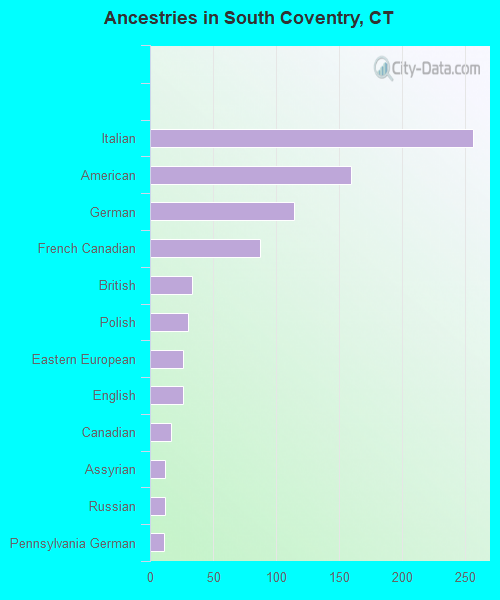
First ancestries reported:
- Italian: 256 (31.3%)
- American: 159 (19.4%)
- German: 114 (13.9%)
- French Canadian: 87 (10.6%)
- British: 33 (4.0%)
- Polish: 30 (3.7%)
- Eastern European: 26 (3.2%)
- English: 26 (3.2%)
- Canadian: 17 (2.1%)
- Assyrian: 12 (1.5%)
- Russian: 12 (1.5%)
- Pennsylvania German: 11 (1.3%)
- Portuguese: 1 (0.1%)
Most common places of birth for foreign-born residents (%):
| South Coventry: | 30.3% (54) |
| Connecticut: | 4.4% (24,001) |
| South Coventry: | 23.0% (41) |
| Connecticut: | 7.3% (39,879) |
| South Coventry: | 18.5% (33) |
| Connecticut: | 1.9% (10,545) |
| South Coventry: | 13.5% (24) |
| Connecticut: | 1.2% (6,551) |
| South Coventry: | 9.0% (16) |
| Connecticut: | 2.3% (12,380) |
Place of birth for U.S.-born residents:
- This state: 647
- Other state: 649
- Northeast: 516
- Midwest: 47
- South: 12
- West: 83
95.6% of South Coventry residents lived in the same house 1 years ago.
Out of people who lived in different houses, 39.0% lived in this county.
Out of people who lived in different counties, 0.0% lived in Connecticut.
| South Coventry: | 95.6% |
| State average: | 88.4% |
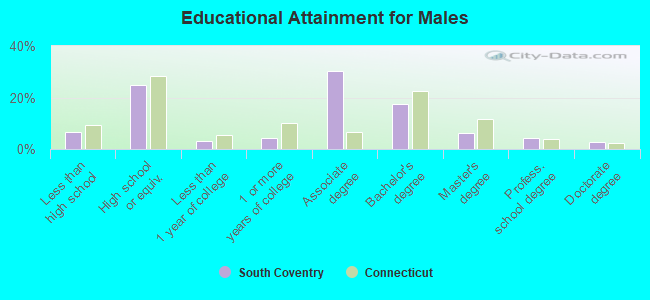
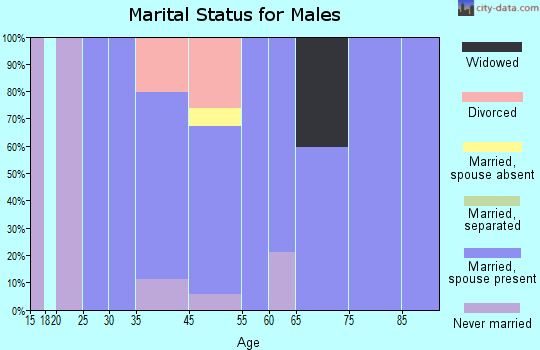
Education attainment for males 25 years and older:
- No schooling: 13
- Nursery to 4th grade: 0
- 5th and 6th grade: 0
- 7th and 8th grade: 0
- 9th grade: 3
- 10th grade: 0
- 11th grade: 0
- 12th grade, no diploma: 17
- High school graduate (or equivalency): 125
- Less than 1 year of college: 15
- Some college more than 1 year, no degree: 22
- Associate degree: 153
- Bachelor's degree: 88
- Master's degree: 32
- Professional school degree: 22
- Doctorate degree: 14
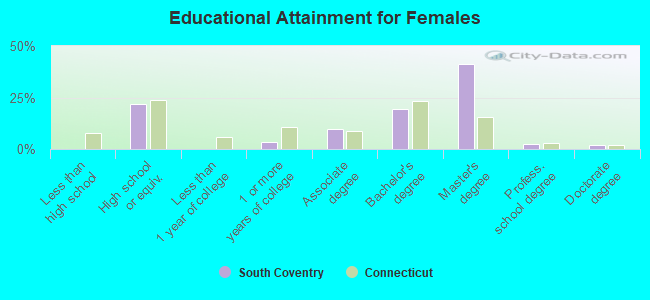
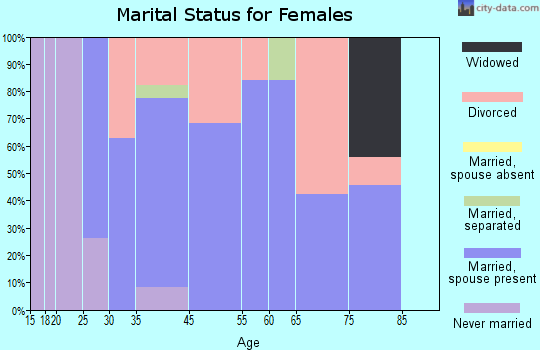
Education attainment for females 25 years and older:
- No schooling: 0
- Nursery to 4th grade: 0
- 5th and 6th grade: 0
- 7th and 8th grade: 0
- 9th grade: 0
- 10th grade: 0
- 11th grade: 0
- 12th grade, no diploma: 0
- High school graduate (or equivalency): 151
- Less than 1 year of college: 0
- Some college more than 1 year, no degree: 25
- Associate degree: 68
- Bachelor's degree: 135
- Master's degree: 287
- Professional school degree: 16
- Doctorate degree: 14
Housing units in structures:
- One, detached: 501
- One, attached: 18
- 3 or 4: 39
- 5 to 9: 61
- 10 to 19: 13
- 50 or more: 18
- Mobile homes: 17
Housing units lacking complete kitchen facilities in 2022: 2.6%
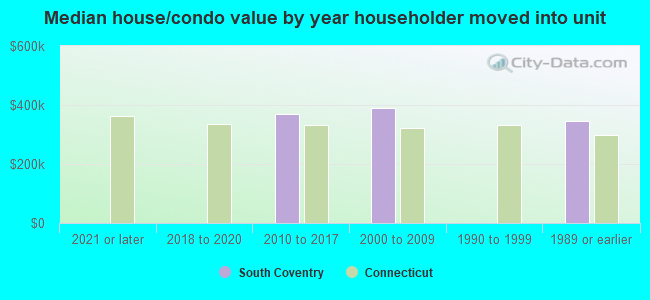
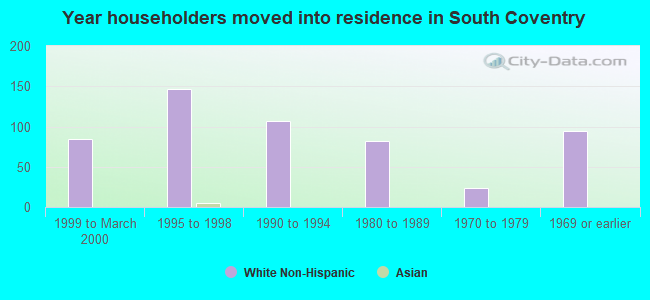
House/condo owner moved in on average 29 years ago
Renter moved in on average 6 years ago
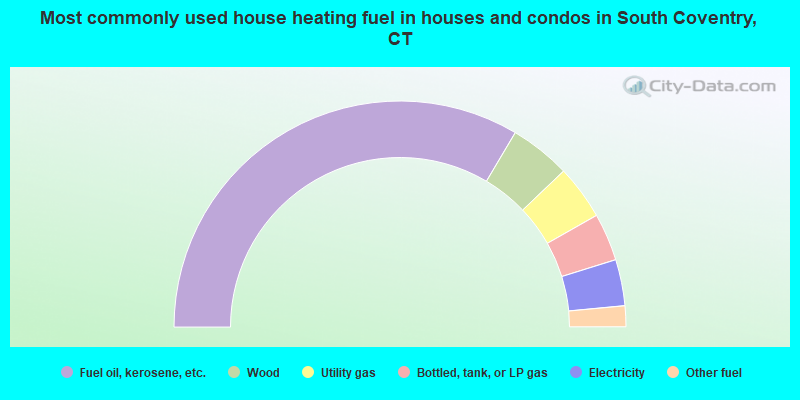
- 67.0%Fuel oil, kerosene, etc.
- 8.7%Wood
- 7.8%Utility gas
- 6.8%Bottled, tank, or LP gas
- 6.6%Electricity
- 3.0%Other fuel
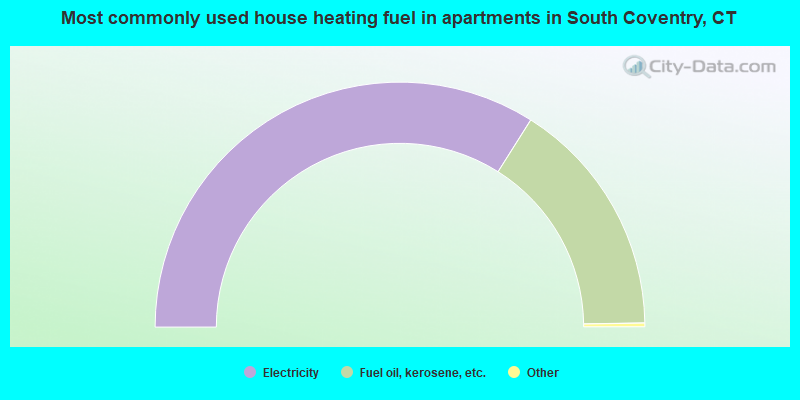
- 68.3%Electricity
- 31.7%Fuel oil, kerosene, etc.
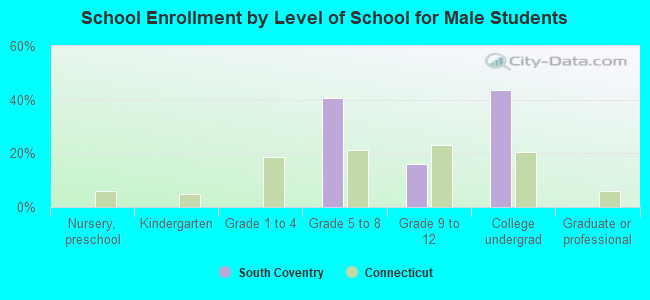
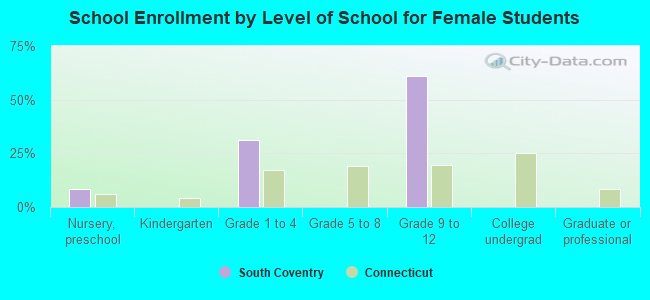
Private vs. public school enrollment:
| Here: | 0.0% |
| Connecticut: | 9.5% |
| Here: | 0.0% |
| Connecticut: | 12.9% |
| Here: | 69.4% |
| Connecticut: | 35.5% |