Housing density: 200 houses/condos per square mile
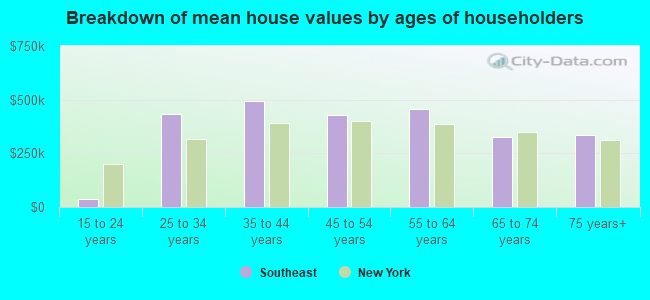
Median price asked for vacant for-sale houses and condos in 2022 in this county: $538,616.
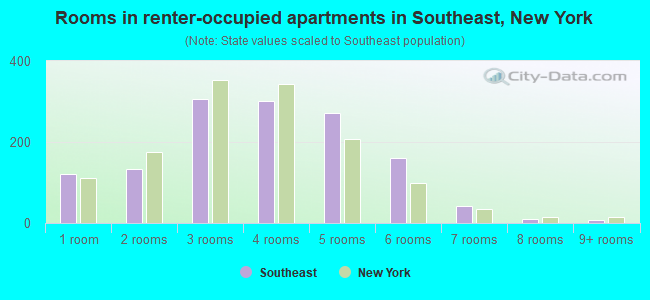
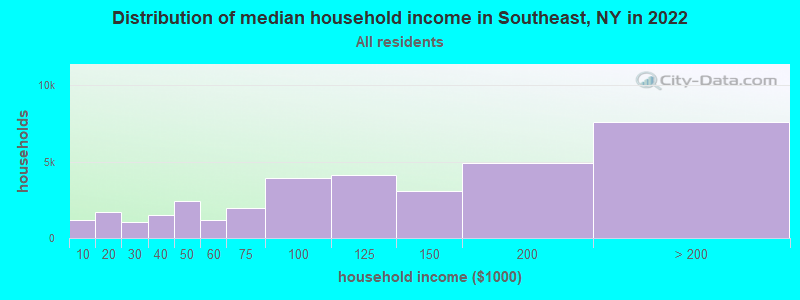
Median contract rent in 2022: $1,780 (lower quartile is $1,311, upper quartile is over $2,000)
Median rent asked for vacant for-rent units in 2022: $1,821
Median gross rent in Southeast, NY in 2022: $1,796
Housing units in Southeast with a mortgage: 3,324 (290 second mortgage, 434 home equity loan, 0 both second mortgage and home equity loan) Houses without a mortgage: 828
In family households: 86,182 (19,004 male householders, 7,256 female householders)
21,650 spouses, 31,544 children (30,091 natural, 616 adopted, 837 stepchildren), 1,205 grandchildren, 762 brothers or sisters, 1,136 parents, foster children, 975 other relatives, 1,732 non-relatives
In nonfamily households: 10,936 (4,152 male householders (3,154 living alone)), 4,629 female householders (3,961 living alone)), 2,155 nonrelatives
In group quarters: 2,592 (674 institutionalized population)
20,870 married couples with children.
2,877 single-parent households (655 men, 2,222 women).
86.8% of residents of Southeast speak English at home.
7.5% of residents speak Spanish at home (39% speak English very well, 16% speak English well, 26% speak English not well, 20% don't speak English at all).
4.9% of residents speak other Indo-European language at home (75% speak English very well, 16% speak English well, 8% speak English not well, 1% don't speak English at all).
0.4% of residents speak Asian or Pacific Island language at home (51% speak English very well, 23% speak English well, 14% speak English not well, 11% don't speak English at all).
0.4% of residents speak other language at home (86% speak English very well, 14% speak English well).
Foreign born population: 2,732 (15.4%)
(55.1% of them are naturalized citizens)
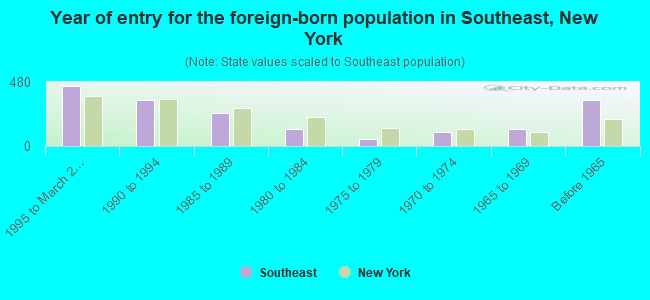
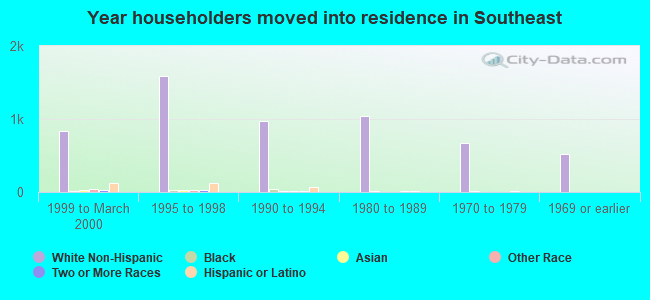
Year of entry for the foreign-born population in Southeast, New York
4531995 to March 2000
3431990 to 1994
2451985 to 1989
1241980 to 1984
511975 to 1979
1071970 to 1974
1301965 to 1969
343Before 1965
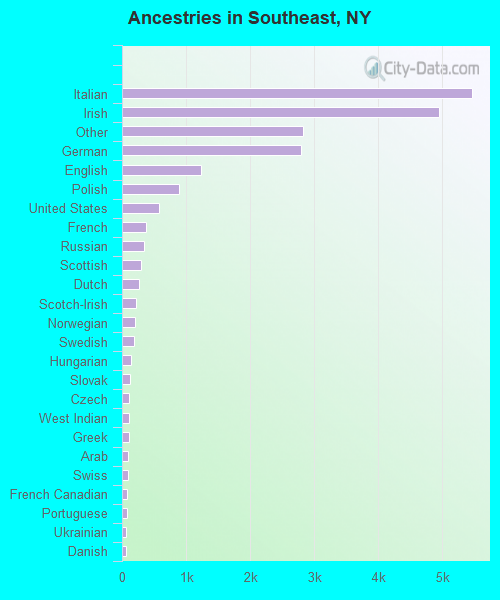
First ancestries reported:
Italian: 5,457 (25.0%)
Irish: 4,955 (22.7%)
Other: 2,832 (13.0%)
German: 2,789 (12.8%)
English: 1,239 (5.7%)
Polish: 894 (4.1%)
United States: 577 (2.6%)
French: 368 (1.7%)
Russian: 349 (1.6%)
Scottish: 294 (1.3%)
Dutch: 271 (1.2%)
Scotch-Irish: 221 (1.0%)
Norwegian: 206 (0.9%)
Swedish: 191 (0.9%)
Hungarian: 145 (0.7%)
Slovak: 122 (0.6%)
Czech: 116 (0.5%)
West Indian: 115 (0.5%)
Greek: 113 (0.5%)
Arab: 98 (0.4%)
Swiss: 93 (0.4%)
French Canadian: 83 (0.4%)
Portuguese: 77 (0.4%)
Ukrainian: 60 (0.3%)
Danish: 58 (0.3%)
Lithuanian: 51 (0.2%)
Subsaharan African: 25 (0.1%)
Welsh: 15 (0.07%)
Most common places of birth for foreign-born residents (%):
Guatemala
Southeast:
20.8% (374)
New York:
0.9% (33,208)
Italy
Southeast:
9.7% (174)
New York:
3.8% (147,729)
Ireland
Southeast:
7.1% (128)
New York:
1.1% (41,934)
Colombia
Southeast:
7.1% (127)
New York:
2.9% (111,727)
Ecuador
Southeast:
5.3% (96)
New York:
3.6% (139,226)
Germany
Southeast:
5.0% (89)
New York:
1.8% (69,327)
Canada
Southeast:
4.1% (74)
New York:
1.4% (54,876)
El Salvador
Southeast:
3.9% (70)
New York:
2.0% (76,977)
Jamaica
Southeast:
3.6% (64)
New York:
5.9% (226,470)
United Kingdom
Southeast:
3.1% (55)
New York:
1.6% (62,237)
India
Southeast:
2.3% (42)
New York:
3.0% (117,238)
Poland
Southeast:
2.3% (42)
New York:
2.4% (93,187)
Brazil
Southeast:
2.2% (40)
New York:
0.6% (22,265)
Philippines
Southeast:
2.2% (40)
New York:
1.9% (72,408)
Peru
Southeast:
1.8% (33)
New York:
1.1% (43,753)
Mexico
Southeast:
1.6% (29)
New York:
4.2% (161,189)
Place of birth for U.S.-born residents:
This state: 12,963
Other state: 2,464
Northeast: 1,548
Midwest: 331
South: 454
West: 131
60% of Southeast residents lived in the same house 5 years ago. Out of people who lived in different houses, 36% lived in this county. Out of people who lived in different counties, 78% lived in New York.
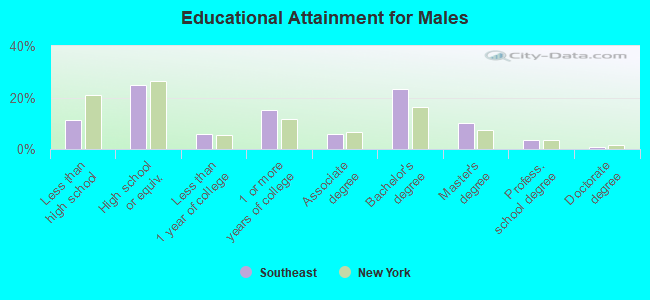
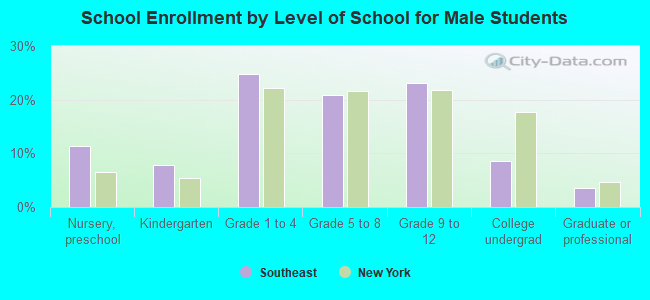
Education attainment for males 25 years and older:
No schooling: 80
Nursery to 4th grade: 52
5th and 6th grade: 90
7th and 8th grade: 79
9th grade: 61
10th grade: 73
11th grade: 54
12th grade, no diploma: 142
High school graduate (or equivalency): 1,426
Less than 1 year of college: 325
Some college more than 1 year, no degree: 855
Associate degree: 327
Bachelor's degree: 1,321
Master's degree: 573
Professional school degree: 198
Doctorate degree: 46
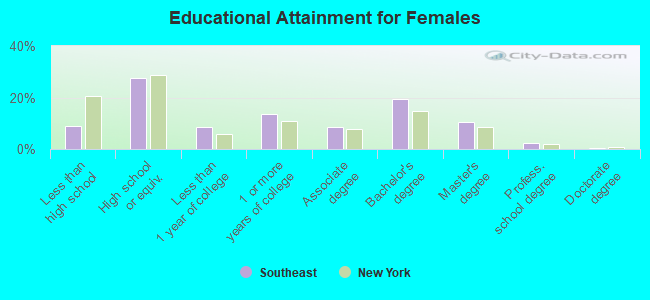
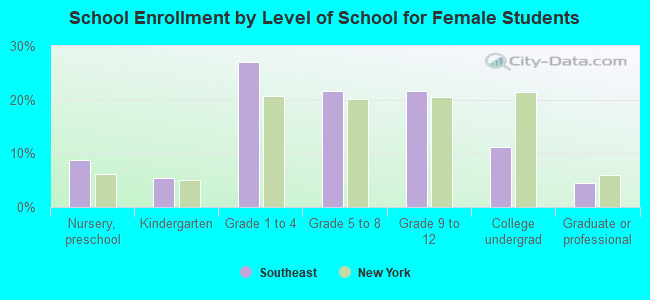
Education attainment for females 25 years and older:
No schooling: 14
Nursery to 4th grade: 13
5th and 6th grade: 79
7th and 8th grade: 110
9th grade: 21
10th grade: 90
11th grade: 85
12th grade, no diploma: 126
High school graduate (or equivalency): 1,669
Less than 1 year of college: 520
Some college more than 1 year, no degree: 835
Associate degree: 515
Bachelor's degree: 1,175
Master's degree: 642
Professional school degree: 130
Doctorate degree: 35
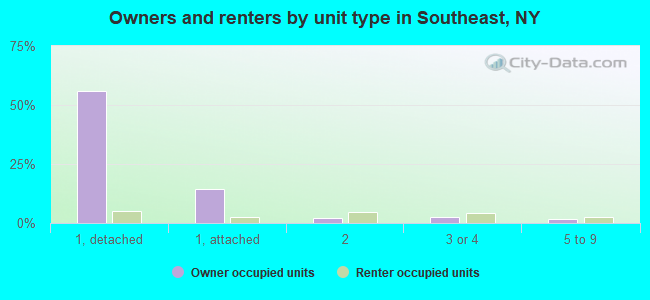
Housing units in structures:
One, detached: 3,915
One, attached: 1,087
Two: 448
3 or 4: 415
5 to 9: 274
10 to 19: 63
20 to 49: 128
50 or more: 16
Mobile homes: 60
Boats, RVs, vans, etc.: 6
Housing units lacking complete plumbing facilities: 0.3%
Housing units lacking complete kitchen facilities: 0.4%