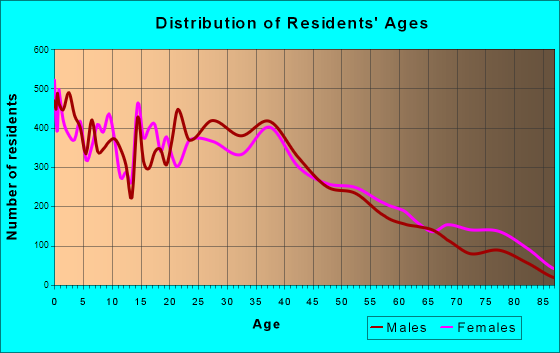
Springdale, AR (Arkansas) Houses and Residents
Estimated median house or condo value in 2022: $256,600 (it was $86,500 in 2000 )
Springdale:
$256,600Arkansas:
$179,800
Lower value quartile - upper value quartile: $176,800 - $337,400Total population: 76,565 (Urban population: 44,577, Rural population: 1,483 (89 farm, 1,394 nonfarm ))
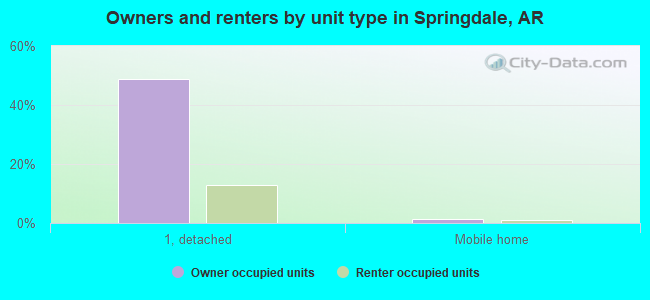
Houses: 32,760 (30,712 occupied: 15,741 owner occupied, 14,971 renter occupied )
% of renters here:
49%State:
34%
Housing density: 1,047 houses/condos per square mile
Median price asked for vacant for-sale houses and condos in 2022: $361,078.
Median contract rent in 2022: $739 (lower quartile is $579, upper quartile is $900)
Median rent asked for vacant for-rent units in 2022: $368
Median gross rent in Springdale, AR in 2022: $891
Housing units in Springdale with a mortgage: 9,915 (492 second mortgage, 0 home equity loan, 433 both second mortgage and home equity loan )Houses without a mortgage: 25
Median household income for houses/condos with a mortgage: $89,821
Median household income for apartments without a mortgage: $59,545
Median monthly housing costs: $962
Data:
Median house or condo value ($)
Median house or condo value ($ change since 2000)
Median house or condo value ($) - White
Median house or condo value ($) - Black or African American
Median house or condo value ($) - Asian
Median house or condo value ($) - Hispanic or Latino
Median house or condo value ($) - American Indian and Alaska Native
Median house or condo value ($) - Multirace
Median house or condo value ($) - Other Race
Median price asked for mobile homes ($)
Household density (households per square mile)
Mean house or condo value by units in structure - 1, detached ($)
Mean house or condo value by units in structure - 1, attached ($)
Mean house or condo value by units in structure - 2 ($)
Mean house or condo value by units in structure by units in structure - 3 or 4 ($)
Mean house or condo value by units in structure - 5 or more ($)
Mean house or condo value by units in structure - Boat, RV, van, etc. ($)
Mean house or condo value by units in structure - Mobile home ($)
Median contract rent ($)
Median contract rent - Lower quartile ($)
Median contract rent - Upper quartile ($)
Median gross rent ($)
Urban houses (%)
Rural houses (%)
Houses occupied (%)
Houses occupied (% change since 2000)
Houses owner occupied (%)
Houses owner occupied (% change since 2000)
Houses renter occupied (%)
Houses renter occupied (% change since 2000)
Vacant housing units - For rent (%)
Vacant housing units - For rent (% change since 2000)
Vacant housing units - For sale only (%)
Vacant housing units - For sale only (% change since 2000)
Vacant housing units - Rented or sold, not occupied (%)
Vacant housing units - Rented or sold, not occupied (% change since 2000)
Vacant housing units - For seasonal, recreational, or occasional use (%)
Vacant housing units - For seasonal, recreational, or occasional use (% change since 2000)
Vacant housing units - For migrant workers (%)
Vacant housing units - For migrant workers (% change since 2000)
Vacant housing units - Other vacant (%)
Vacant housing units - Other vacant (% change since 2000)
Median monthly housing costs ($)
Median household income for houses/condos with a mortgage ($)
Median household income for houses/condos without a mortgage ($)
Median household income ($)
Median household income ($) - White
Median household income ($) - Black or African American
Median household income ($) - Asian
Median household income ($) - Hispanic or Latino
Median household income ($) - American Indian and Alaska Native
Median household income ($) - Multirace
Median household income ($) - Other Race
Mortgage status - with mortgage (%)
Mortgage status - with second mortgage (%)
Mortgage status - with home equity loan (%)
Mortgage status - with both second mortgage and home equity loan (%)
Mortgage status - without a mortgage (%)
Median year house/condo built
Median year apartment built
Household type by relationship - Male householder living alone (%)
Household type by relationship - Male householder not living alone (%)
Household type by relationship - Female householder living alone (%)
Household type by relationship - Female householder not living alone (%)
Household type by relationship - Opposite-Sex spouse (%)
Household type by relationship - Same-Sex spouse (%)
Household type by relationship - Opposite-Sex unmarried partner (%)
Household type by relationship - Same-Sex unmarried partner (%)
Household type by relationship - In group quarters (%)
Size of family households - 2-person household (%)
Size of family households - 3-person household (%)
Size of family households - 4-person household (%)
Size of family households - 5-person household (%)
Size of family households - 6-person household (%)
Size of family households - 7-or-more-person household (%)
Size of nonfamily households - 1-person household (%)
Size of nonfamily households - 2-person household (%)
Size of nonfamily households - 3-person household (%)
Size of nonfamily households - 4-person household (%)
Size of nonfamily households - 5-person household (%)
Size of nonfamily households - 6-person household (%)
Size of nonfamily households - 7-or-moreperson household (%)
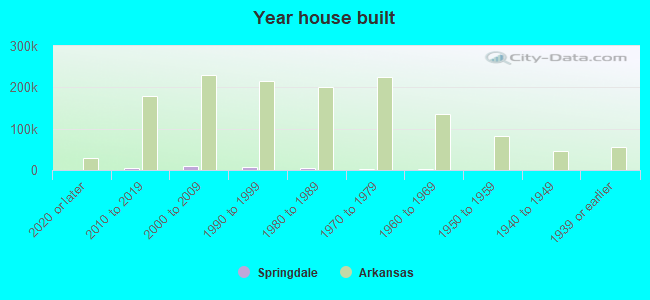
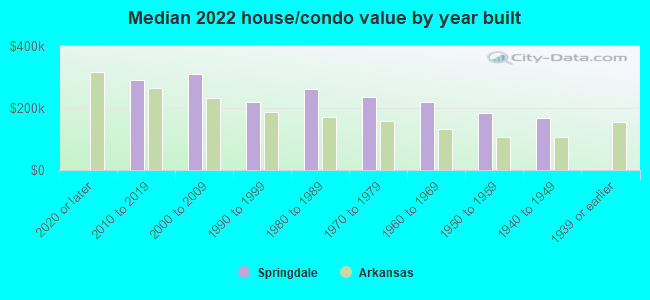
Year house built - Built 2010 or later (%)
Year house built - Built 2000 to 2009 (%)
Year house built - Built 1990 to 1999 (%)
Year house built - Built 1980 to 1989 (%)
Year house built - Built 1970 to 1979 (%)
Year house built - Built 1960 to 1969 (%)
Year house built - Built 1950 to 1959 (%)
Year house built - Built 1940 to 1949 (%)
Year house built - Built 1939 or earlier (%)
Median number of rooms in houses and condos
Median number of rooms in apartments
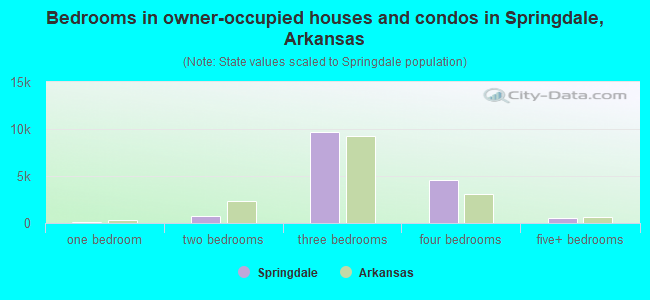
Median number of bedrooms in owner occupied houses
Mean number of bedrooms in owner occupied houses
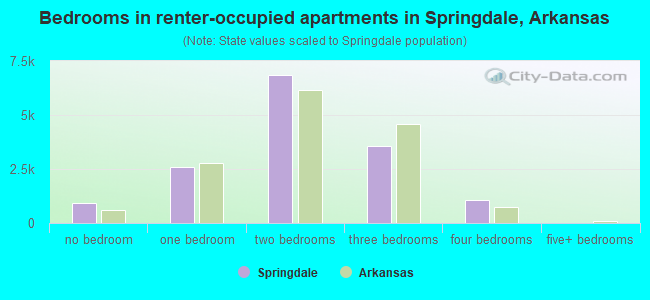
Median number of bedrooms in renter occupied houses
Mean number of bedrooms in renter occupied houses
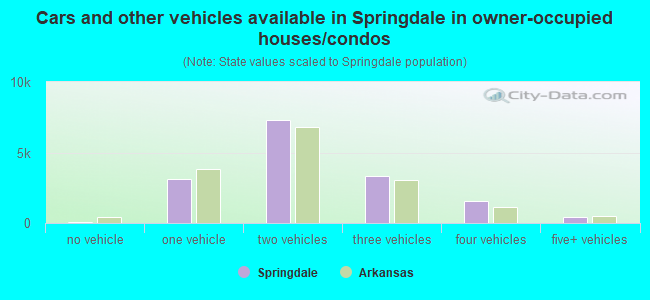
Median number of vehichles in owner occupied houses
Mean number of vehichles in owner occupied houses
Median number of vehichles in renter occupied houses
Mean number of vehichles in renter occupied houses
Rooms in owner-occupied houses - 1 room (%)
Rooms in owner-occupied houses - 2 rooms (%)
Rooms in owner-occupied houses - 3 rooms (%)
Rooms in owner-occupied houses - 4 rooms (%)
Rooms in owner-occupied houses - 5 rooms (%)
Rooms in owner-occupied houses - 6 rooms (%)
Rooms in owner-occupied houses - 7 rooms (%)
Rooms in owner-occupied houses - 8 rooms (%)
Rooms in owner-occupied houses - 9+ rooms (%)
Rooms in renter-occupied houses - 1 room (%)
Rooms in renter-occupied houses - 2 rooms (%)
Rooms in renter-occupied houses - 3 rooms (%)
Rooms in renter-occupied houses - 4 rooms (%)
Rooms in renter-occupied houses - 5 rooms (%)
Rooms in renter-occupied houses - 6 rooms (%)
Rooms in renter-occupied houses - 7 rooms (%)
Rooms in renter-occupied houses - 8 rooms (%)
Rooms in renter-occupied houses - 9+ rooms (%)
Bedrooms in owner-occupied houses - no bedrooms (%)
Bedrooms in owner-occupied houses - 1 bedroom (%)
Bedrooms in owner-occupied houses - 2 bedrooms (%)
Bedrooms in owner-occupied houses - 3 bedrooms (%)
Bedrooms in owner-occupied houses - 4 bedrooms (%)
Bedrooms in owner-occupied houses - 5+ bedrooms (%)
Bedrooms in renter-occupied houses - no bedrooms (%)
Bedrooms in renter-occupied houses - 1 bedroom (%)
Bedrooms in renter-occupied houses - 2 bedrooms (%)
Bedrooms in renter-occupied houses - 3 bedrooms (%)
Bedrooms in renter-occupied houses - 4 bedrooms (%)
Bedrooms in renter-occupied houses - 5+ bedrooms (%)
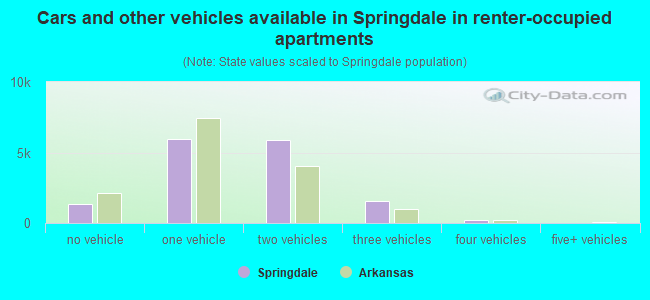
Vehicles available in owner-occupied houses - no vehicle available (%)
Vehicles available in owner-occupied houses - 1 vehicle available(%)
Vehicles available in owner-occupied houses - 2 Vehicles available (%)
Vehicles available in owner-occupied houses - 3 Vehicles available (%)
Vehicles available in owner-occupied houses - 4 Vehicles available (%)
Vehicles available in owner-occupied houses - 5+ Vehicles available (%)
Vehicles available in renter-occupied houses - no vehicle available (%)
Vehicles available in renter-occupied houses - 1 vehicle available (%)
Vehicles available in renter-occupied houses - 2 Vehicles available (%)
Vehicles available in renter-occupied houses - 3 Vehicles available (%)
Vehicles available in renter-occupied houses - 4 Vehicles available (%)
Vehicles available in renter-occupied houses - 5+ Vehicles available (%)
Housing units in structures - 1, detached (%)
Housing units in structures - 1, attached (%)
Housing units in structures - 2 (%)
Housing units in structures - 3 or 4 (%)
Housing units in structures - 5 to 9 (%)
Housing units in structures - 10 to 19 (%)
Housing units in structures - 20 to 49 (%)
Housing units in structures - 50 or more (%)
Housing units in structures - Mobile home (%)
Housing units in structures - Boat, RV, van, etc. (%)
Housing units in structures - Owners - 1, detached (%)
Housing units in structures - Owners - 1, attached (%)
Housing units in structures - Owners - 2 (%)
Housing units in structures - Owners - 3 or 4 (%)
Housing units in structures - Owners - 5 to 9 (%)
Housing units in structures - Owners - 10 to 19 (%)
Housing units in structures - Owners - 20 to 49 (%)
Housing units in structures - Owners - 50 or more (%)
Housing units in structures - Owners - Mobile home (%)
Housing units in structures - Owners - Boat, RV, van, etc. (%)
Housing units in structures - Renters - 1, detached (%)
Housing units in structures - Renters - 1, attached (%)
Housing units in structures - Renters - 2 (%)
Housing units in structures - Renters - 3 or 4 (%)
Housing units in structures - Renters - 5 to 9 (%)
Housing units in structures - Renters - 10 to 19 (%)
Housing units in structures - Renters - 20 to 49 (%)
Housing units in structures - Renters - 50 or more (%)
Housing units in structures - Renters - Mobile home (%)
Housing units in structures - Renters - Boat, RV, van, etc. (%)
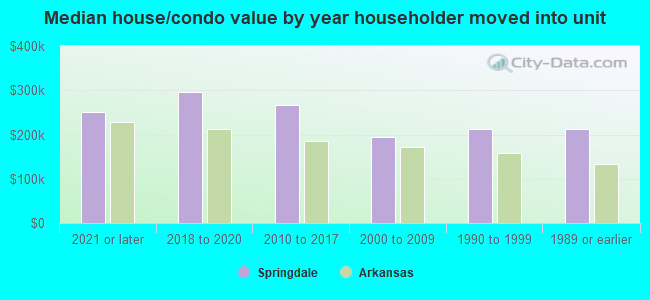
House/condo owner moved in on average (years ago)
Renter moved in on average (years ago)
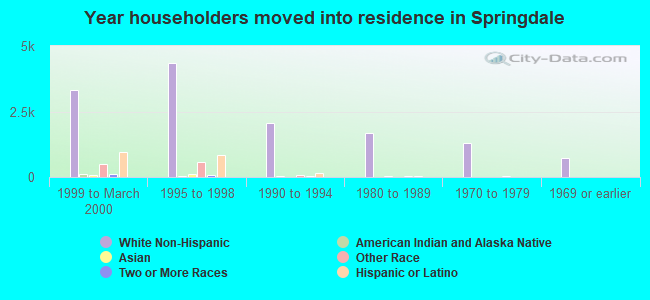
Year householder moved into unit - Moved in 1999 to March 2000 (%)
Year householder moved into unit - Moved in 1999 to March 2000 (%) - White
Year householder moved into unit - Moved in 1999 to March 2000 (%) - Black or African American
Year householder moved into unit - Moved in 1999 to March 2000 (%) - Asian
Year householder moved into unit - Moved in 1999 to March 2000 (%) - Hispanic or Latino
Year householder moved into unit - Moved in 1999 to March 2000 (%) - American Indian and Alaska Native
Year householder moved into unit - Moved in 1999 to March 2000 (%) - Multirace
Year householder moved into unit - Moved in 1999 to March 2000 (%) - Other Race
Year householder moved into unit - Moved in 1995 to 1998 (%)
Year householder moved into unit - Moved in 1995 to 1998 (%) - White
Year householder moved into unit - Moved in 1995 to 1998 (%) - Black or African American
Year householder moved into unit - Moved in 1995 to 1998 (%) - Asian
Year householder moved into unit - Moved in 1995 to 1998 (%) - Hispanic or Latino
Year householder moved into unit - Moved in 1995 to 1998 (%) - American Indian and Alaska Native
Year householder moved into unit - Moved in 1995 to 1998 (%) - Multirace
Year householder moved into unit - Moved in 1995 to 1998 (%) - Other Race
Year householder moved into unit - Moved in 1990 to 1994 (%)
Year householder moved into unit - Moved in 1990 to 1994 (%) - White
Year householder moved into unit - Moved in 1990 to 1994 (%) - Black or African American
Year householder moved into unit - Moved in 1990 to 1994 (%) - Asian
Year householder moved into unit - Moved in 1990 to 1994 (%) - Hispanic or Latino
Year householder moved into unit - Moved in 1990 to 1994 (%) - American Indian and Alaska Native
Year householder moved into unit - Moved in 1990 to 1994 (%) - Multirace
Year householder moved into unit - Moved in 1990 to 1994 (%) - Other Race
Year householder moved into unit - Moved in 1980 to 1989 (%)
Year householder moved into unit - Moved in 1980 to 1989 (%) - White
Year householder moved into unit - Moved in 1980 to 1989 (%) - Black or African American
Year householder moved into unit - Moved in 1980 to 1989 (%) - Asian
Year householder moved into unit - Moved in 1980 to 1989 (%) - Hispanic or Latino
Year householder moved into unit - Moved in 1980 to 1989 (%) - American Indian and Alaska Native
Year householder moved into unit - Moved in 1980 to 1989 (%) - Multirace
Year householder moved into unit - Moved in 1980 to 1989 (%) - Other Race
Year householder moved into unit - Moved in 1970 to 1979 (%)
Year householder moved into unit - Moved in 1970 to 1979 (%) - White
Year householder moved into unit - Moved in 1970 to 1979 (%) - Black or African American
Year householder moved into unit - Moved in 1970 to 1979 (%) - Asian
Year householder moved into unit - Moved in 1970 to 1979 (%) - Hispanic or Latino
Year householder moved into unit - Moved in 1970 to 1979 (%) - American Indian and Alaska Native
Year householder moved into unit - Moved in 1970 to 1979 (%) - Multirace
Year householder moved into unit - Moved in 1970 to 1979 (%) - Other Race
Year householder moved into unit - Moved in 1969 or earlier (%)
Year householder moved into unit - Moved in 1969 or earlier (%) - White
Year householder moved into unit - Moved in 1969 or earlier (%) - Black or African American
Year householder moved into unit - Moved in 1969 or earlier (%) - Asian
Year householder moved into unit - Moved in 1969 or earlier (%) - Hispanic or Latino
Year householder moved into unit - Moved in 1969 or earlier (%) - American Indian and Alaska Native
Year householder moved into unit - Moved in 1969 or earlier (%) - Multirace
Year householder moved into unit - Moved in 1969 or earlier (%) - Other Race
Housing units lacking complete plumbing facilities (%)
Housing units lacking complete kitchen facilities (%)
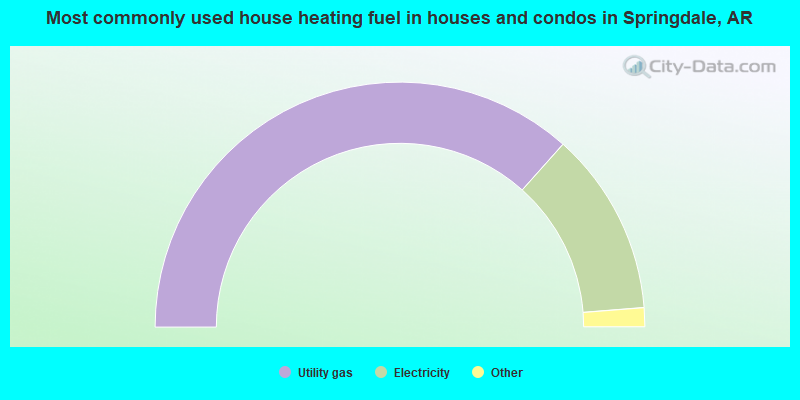
House heating fuel used in houses and condos - Utility gas (%)
House heating fuel used in houses and condos - Bottled, tank, or LP gas (%)
House heating fuel used in houses and condos - Electricity (%)
House heating fuel used in houses and condos - Fuel oil, kerosene, etc. (%)
House heating fuel used in houses and condos - Coal or coke (%)
House heating fuel used in houses and condos - Wood (%)
House heating fuel used in houses and condos - Solar energy (%)
House heating fuel used in houses and condos - Other fuel (%)
House heating fuel used in houses and condos - No fuel used (%)
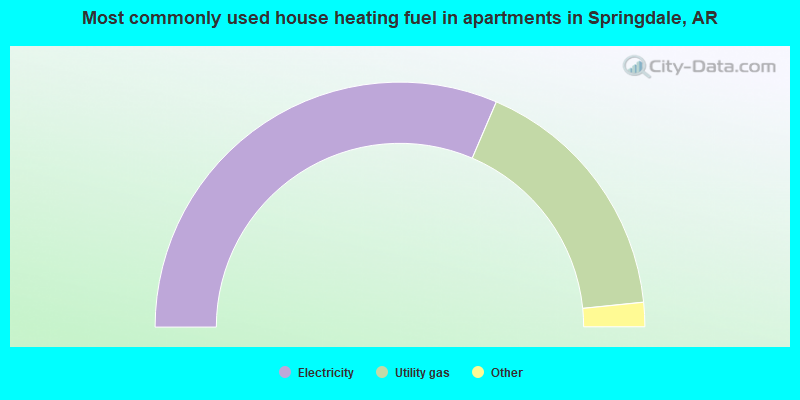
House heating fuel used in apartments - Utility gas (%)
House heating fuel used in apartments - Bottled, tank, or LP gas (%)
House heating fuel used in apartments - Electricity (%)
House heating fuel used in apartments - Fuel oil, kerosene, etc. (%)
House heating fuel used in apartments - Coal or coke (%)
House heating fuel used in apartments - Wood (%)
House heating fuel used in apartments - Solar energy (%)
House heating fuel used in apartments - Other fuel (%)
House heating fuel used in apartments - No fuel used (%)
Latest news about housing in Springdale, AR collected exclusively by city-data.com from local newspapers, TV, and radio stations
Median year house/condo built: 1997Median year apartment built: 1997Household type by relationship:
Households: 85,844
Male householders: 15,637 (4,211 living alone ), Female householders: 15,075 (4,087 living alone )15,527 spouses (15,527 opposite-sex spouses ), 2,205 unmarried partners , (2,205 opposite-sex unmarried partners ), 28,792 children (27,608 natural , 394 adopted , 790 stepchildren ), 1,779 grandchildren , 489 brothers or sisters , 1,829 parents , 154 foster children , 2,409 other relatives , 1,140 non-relatives In group quarters: 808
Size of family households: 6,674 2-persons , 4,627 3-persons , 5,514 4-persons , 3,189 5-persons , 502 6-persons , 553 7-or-more-persons .
Size of nonfamily households: 8,298 1-person , 1,297 2-persons , 58 3-persons .
17,425 married couples with children. single-parent households (1,300 men , 4,238 women ).
61.0% of residents of Springdale speak English at home. of residents speak Spanish at home (56% speak English very well , 15% speak English well , 15% speak English not well , 14% don't speak English at all ).of residents speak other Indo-European language at home (45% speak English very well , 2% speak English well , 53% speak English not well ).of residents speak Asian or Pacific Island language at home (53% speak English very well , 22% speak English well , 17% speak English not well , 8% don't speak English at all ).
Foreign born population: 23,064 (26.9%)of them are naturalized citizens )
Median number of rooms in houses and condos:
Median number of rooms in apartments
Owner-occupied Renter-occupied
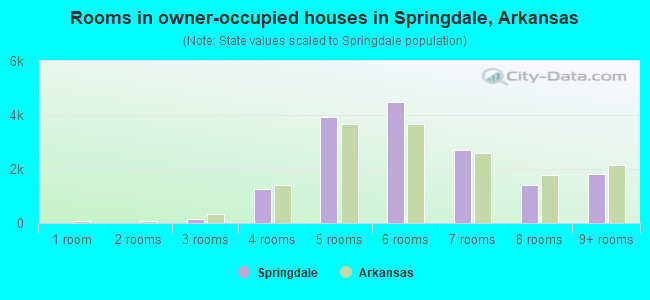
Rooms in owner-occupied houses in Springdale, Arkansas
0 1 room 0 2 rooms 159 3 rooms 1,250 4 rooms 3,927 5 rooms 4,481 6 rooms 2,696 7 rooms 1,415 8 rooms 1,813 9+ rooms
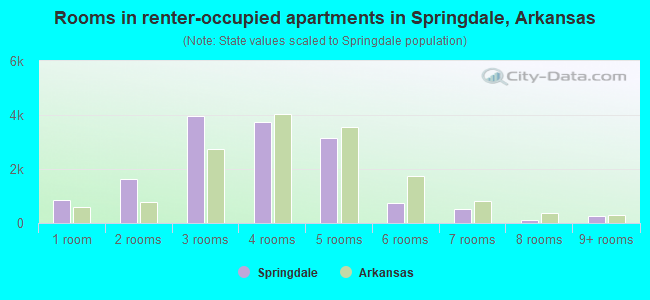
Rooms in renter-occupied apartments in Springdale, Arkansas
854 1 room 1,614 2 rooms 3,971 3 rooms 3,741 4 rooms 3,147 5 rooms 750 6 rooms 524 7 rooms 120 8 rooms 250 9+ rooms
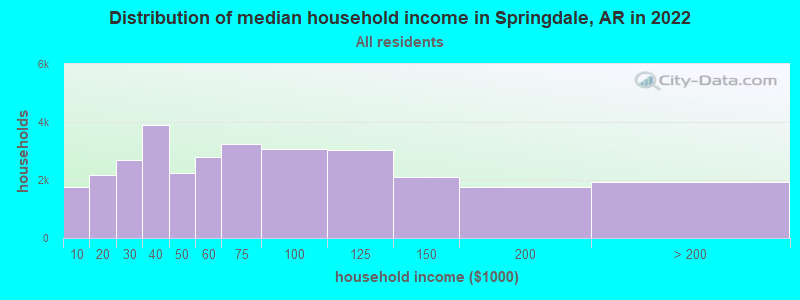
Springdale, AR household income distribution 1,763 Less than $10,0002,162 $10,000 to $19,9992,686 $20,000 to $29,9993,890 $30,000 to $39,9992,249 $40,000 to $49,9992,803 $50,000 to $59,9993,243 $60,000 to $74,9993,085 $75,000 to $99,9993,039 $100,000 to $124,9992,108 $125,000 to $149,9991,761 $150,000 to $199,9991,923 $200,000 or more
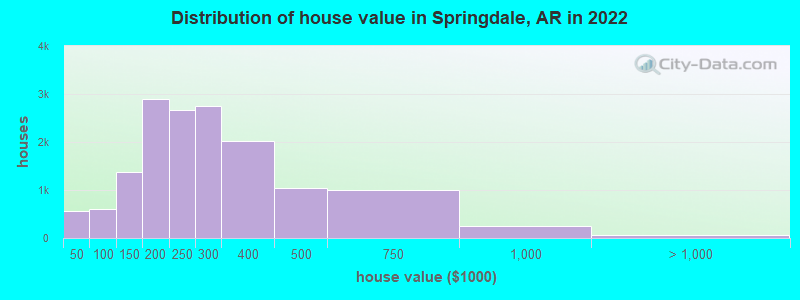
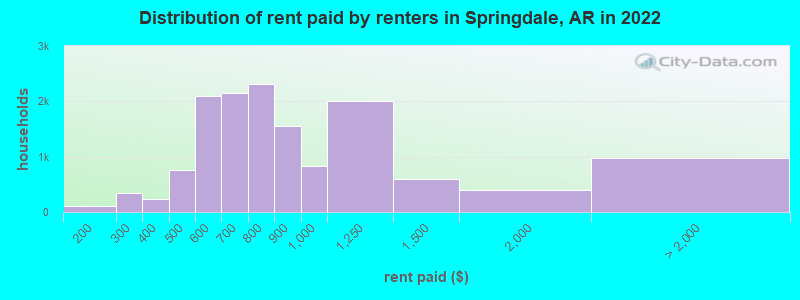
Home value of owner - occupied houses in 2022 in Springdale, AR 96 Less than $10,00034 $10,000 to $14,99955 $15,000 to $19,999111 $20,000 to $24,99942 $25,000 to $29,999222 $30,000 to $34,9998 $40,000 to $49,99981 $50,000 to $59,99932 $60,000 to $69,999204 $70,000 to $79,99974 $80,000 to $89,999194 $90,000 to $99,999743 $100,000 to $124,999636 $125,000 to $149,9991,700 $150,000 to $174,9991,187 $175,000 to $199,9992,661 $200,000 to $249,9992,746 $250,000 to $299,9992,015 $300,000 to $399,9991,040 $400,000 to $499,9991,003 $500,000 to $749,999239 $750,000 to $999,99934 $1,000,000 to $1,499,99929 $2,000,000 or moreRent paid by renters in 2022 in Springdale, AR 9 $100 to $14990 $150 to $199127 $200 to $249211 $250 to $299192 $300 to $34935 $350 to $39930 $400 to $449734 $450 to $4991,247 $500 to $549856 $550 to $5991,303 $600 to $649841 $650 to $6991,424 $700 to $749893 $750 to $7991,557 $800 to $899836 $900 to $9992,000 $1,000 to $1,249605 $1,250 to $1,499389 $1,500 to $1,99927 $2,000 to $2,49968 $2,500 to $2,99934 $3,000 to $3,499844 No cash rent
Percentage of workers working in this county: 75.5%Number of people working at home: 3,140 (7.3% of all workers )
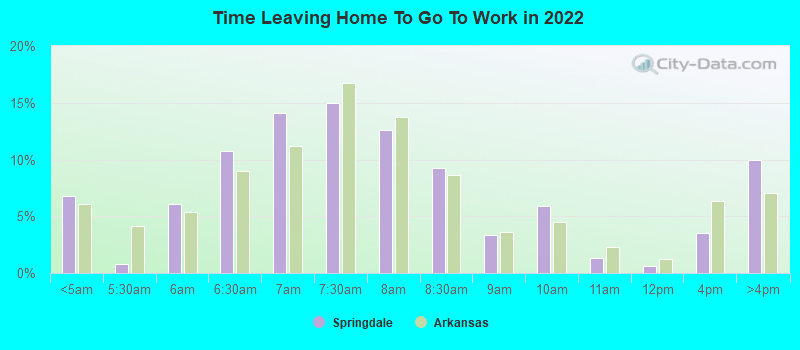
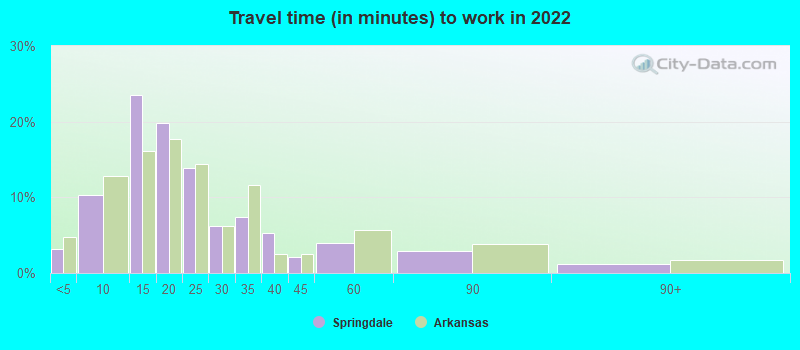
Travel time to work (commute)
Less than 5 minutes: 1,2205 to 9 minutes: 3,98210 to 14 minutes: 8,88115 to 19 minutes: 8,99720 to 24 minutes: 6,82425 to 29 minutes: 2,46830 to 34 minutes: 1,71235 to 39 minutes: 46040 to 44 minutes: 42545 to 59 minutes: 1,51160 to 89 minutes: 58390 or more minutes: 195
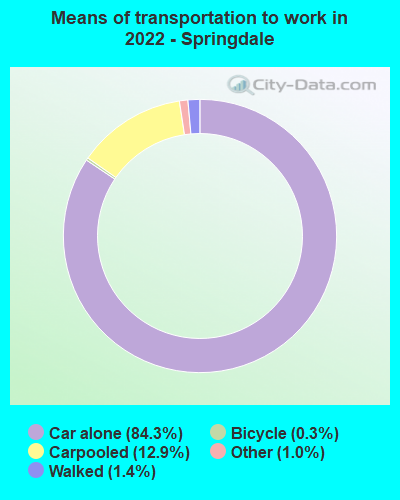
Means of transportation to work:
Drove a car alone: 36,846 (79.8%)Carpooled: 4,410 (9.6%)Bus : 32 (0.1%)Taxi: 429 (0.9%)Bicycle: 115 (0.2%)Walked: 801 (1.7%)Worked at home: 3,140 (6.8%)
Unemployment by race in 2022
Unemployment rate for White non-Hispanic residents 2.3% Males1.0% FemalesUnemployment rate for Black residents 4.5% MalesUnemployment rate for Asian residents 0.8% Males1.2% FemalesUnemployment rate for other race residents 1.1% Males14.7% FemalesUnemployment rate for two or more race residents 6.8% Males3.6% FemalesUnemployment rate for Hispanic or Latino residents 2.3% Males8.7% Females
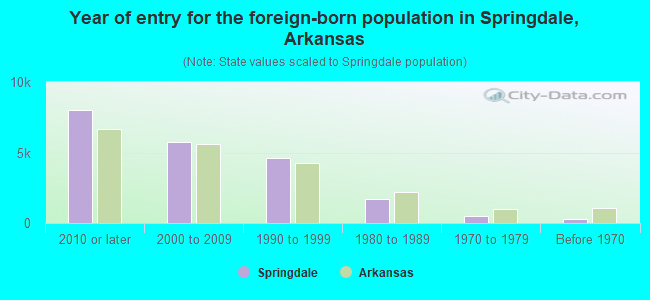
Year of entry for the foreign-born population in Springdale, Arkansas
7,998 2010 or later 5,726 2000 to 2009 4,614 1990 to 1999 1,726 1980 to 1989 469 1970 to 1979 257 Before 1970
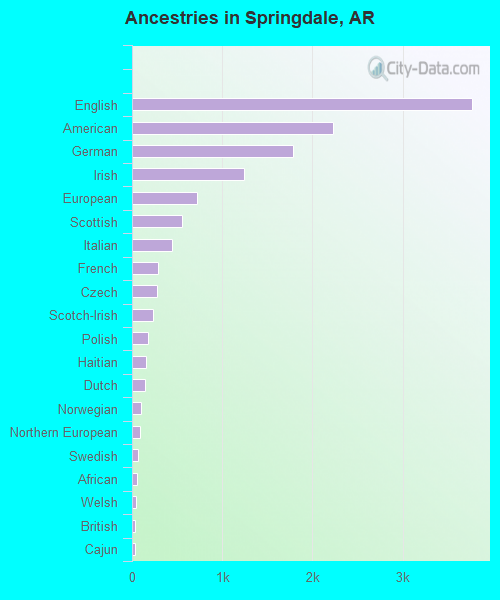
First ancestries reported:
English: 3,769 (7.5%)
American: 2,225 (4.4%)
German: 1,789 (3.5%)
Irish: 1,245 (2.5%)
European: 723 (1.4%)
Scottish: 552 (1.1%)
Italian: 446 (0.9%)
French: 290 (0.6%)
Czech: 274 (0.5%)
Scotch-Irish: 238 (0.5%)
Polish: 180 (0.4%)
Haitian: 155 (0.3%)
Dutch: 142 (0.3%)
Norwegian: 104 (0.2%)
Northern European: 90 (0.2%)
Swedish: 69 (0.1%)
African: 56 (0.1%)
Welsh: 47 (0.09%)
British: 36 (0.07%)
Cajun: 36 (0.07%)
Lebanese: 29 (0.06%)
Syrian: 24 (0.05%)
Czechoslovakian: 23 (0.05%)
Australian: 19 (0.04%)
Romanian: 18 (0.04%)
Egyptian: 15 (0.03%)
Austrian: 15 (0.03%)
Slovak: 14 (0.03%)
Lithuanian: 10 (0.02%)
Swiss: 10 (0.02%)
French Canadian: 9 (0.02%)
Slavic: 8 (0.02%)
Kenyan: 8 (0.02%)
Russian: 7 (0.01%)
Canadian: 6 (0.01%)
Belizean: 6 (0.01%) Most common places of birth for foreign-born residents (%): Mexico Springdale:
44.9% (9,583)Arkansas:
40.2% (61,075)
Marshall Islands Springdale:
22.3% (4,768)Arkansas:
4.3% (6,456)
El Salvador Springdale:
14.1% (3,011)Arkansas:
10.7% (16,210)
Guatemala Springdale:
4.2% (895)Arkansas:
3.5% (5,376)
Laos Springdale:
3.0% (650)Arkansas:
2.2% (3,381)
Place of birth for U.S.-born residents:
This state: 36,215Other state: 24,940Northeast: 2,251Midwest: 5,764South: 10,539West: 6,386 85.0% of Springdale residents lived in the same house 1 years ago.
Out of people who lived in different houses, 34.6% lived in this county.
Out of people who lived in different counties, 51.3% lived in Arkansas.
Springdale:
85.0%State average:
87.0%
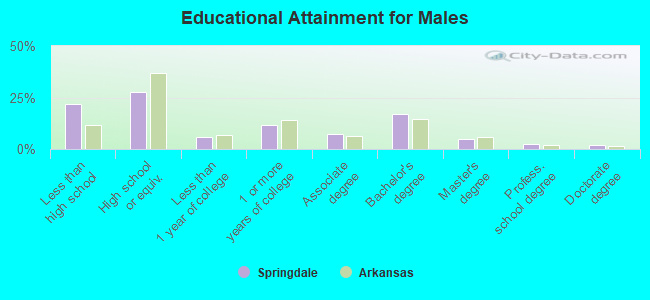
Education attainment for males 25 years and older:
No schooling: 491Nursery to 4th grade: 2615th and 6th grade: 1,0127th and 8th grade: 1,3559th grade: 1,06510th grade: 46511th grade: 22012th grade, no diploma: 1,020High school graduate (or equivalency): 7,421Less than 1 year of college: 1,537Some college more than 1 year, no degree: 3,100Associate degree: 2,010Bachelor's degree: 4,491Master's degree: 1,276Professional school degree: 603Doctorate degree: 464
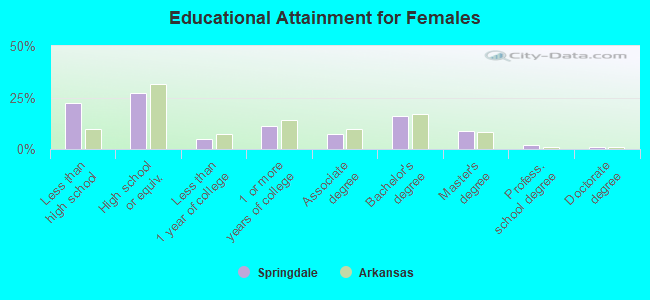
Education attainment for females 25 years and older:
No schooling: 1,187Nursery to 4th grade: 5745th and 6th grade: 1,1517th and 8th grade: 9399th grade: 84310th grade: 26711th grade: 45212th grade, no diploma: 292High school graduate (or equivalency): 6,980Less than 1 year of college: 1,220Some college more than 1 year, no degree: 2,859Associate degree: 1,915Bachelor's degree: 4,183Master's degree: 2,236Professional school degree: 456Doctorate degree: 243
Housing units in structures:
One, detached: 19,586One, attached: 1,507Two: 1,6253 or 4: 2,1085 to 9: 2,73310 to 19: 3,53920 to 49: 17450 or more: 242Mobile homes: 1,179Boats, RVs, vans, etc.: 67Median worth of mobile homes: $157,400
Housing units lacking complete plumbing facilities in 2022: 1.0%Housing units lacking complete kitchen facilities in 2022: 3.5%House/condo owner moved in on average 9 years ago
Renter moved in on average 2 years ago
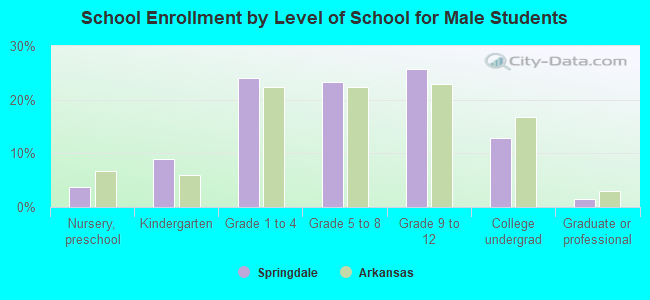
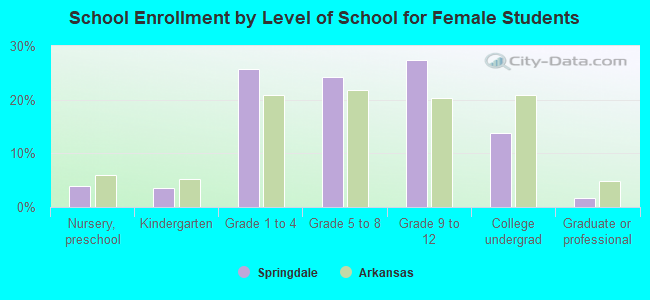
Private vs. public school enrollment:
Students in private schools in grades 1 to 8 (elementary and middle school): 976 Students in private schools in grades 9 to 12 (high school): 184 Students in private undergraduate colleges: 419