Springdale, NJ (New Jersey) Houses and Residents
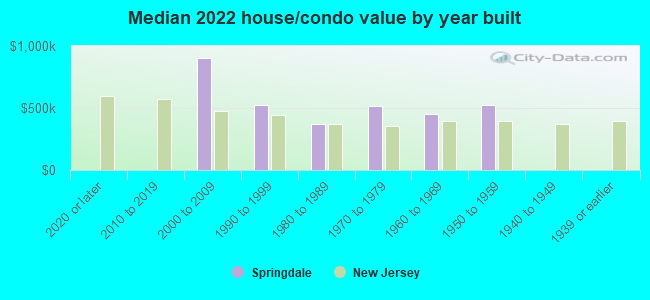
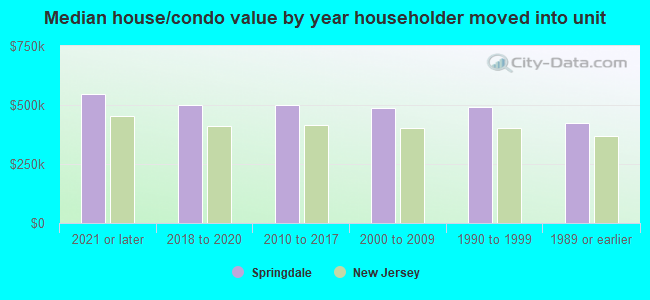
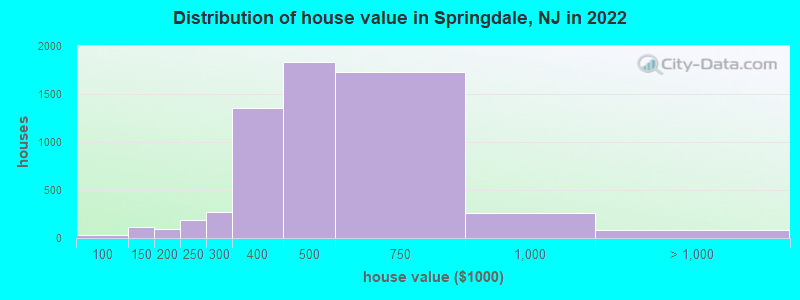
Estimated median house or condo value in 2022: $488,070 (it was $210,700 in 2000 )
Springdale:
$488,070New Jersey:
$428,900
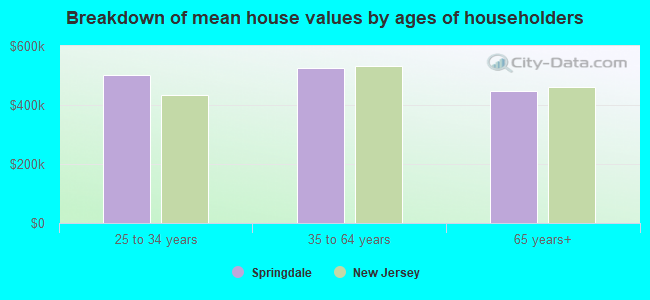
Lower value quartile - upper value quartile: $380,370 - $571,385Mean price in 2022: Detached houses: $502,328 Here:
$502,328State:
$537,591
Townhouses or other attached units: $314,940 Here:
$314,940State:
$381,113
In 5-or-more-unit structures: $200,527 Here:
$200,527State:
$368,745
Total population: 14,518 (Urban population: 14,412, Rural population: 0)
Houses: 5,751 (5,499 occupied: 4,769 owner occupied, 826 renter occupied )
% of renters here:
15%State:
35%
Housing density: 1,067 houses/condos per square mile
Median price asked for vacant for-sale houses and condos in 2022 in this county: $280,676.
Median gross rent in Springdale, NJ in 2022: $-668,776,370
Housing units in Springdale with a mortgage: 2,979 (336 second mortgage, 0 home equity loan, 339 both second mortgage and home equity loan )Houses without a mortgage: 120
Median household income for houses/condos with a mortgage: $207,711
Median household income for apartments without a mortgage: $149,455
Median monthly housing costs: $2,426
Data:
Median house or condo value ($)
Median house or condo value ($ change since 2000)
Median house or condo value ($) - White
Median house or condo value ($) - Black or African American
Median house or condo value ($) - Asian
Median house or condo value ($) - Hispanic or Latino
Median house or condo value ($) - American Indian and Alaska Native
Median house or condo value ($) - Multirace
Median house or condo value ($) - Other Race
Median price asked for mobile homes ($)
Household density (households per square mile)
Mean house or condo value by units in structure - 1, detached ($)
Mean house or condo value by units in structure - 1, attached ($)
Mean house or condo value by units in structure - 2 ($)
Mean house or condo value by units in structure by units in structure - 3 or 4 ($)
Mean house or condo value by units in structure - 5 or more ($)
Mean house or condo value by units in structure - Boat, RV, van, etc. ($)
Mean house or condo value by units in structure - Mobile home ($)
Median contract rent ($)
Median contract rent - Lower quartile ($)
Median contract rent - Upper quartile ($)
Median gross rent ($)
Urban houses (%)
Rural houses (%)
Houses occupied (%)
Houses occupied (% change since 2000)
Houses owner occupied (%)
Houses owner occupied (% change since 2000)
Houses renter occupied (%)
Houses renter occupied (% change since 2000)
Vacant housing units - For rent (%)
Vacant housing units - For rent (% change since 2000)
Vacant housing units - For sale only (%)
Vacant housing units - For sale only (% change since 2000)
Vacant housing units - Rented or sold, not occupied (%)
Vacant housing units - Rented or sold, not occupied (% change since 2000)
Vacant housing units - For seasonal, recreational, or occasional use (%)
Vacant housing units - For seasonal, recreational, or occasional use (% change since 2000)
Vacant housing units - For migrant workers (%)
Vacant housing units - For migrant workers (% change since 2000)
Vacant housing units - Other vacant (%)
Vacant housing units - Other vacant (% change since 2000)
Median monthly housing costs ($)
Median household income for houses/condos with a mortgage ($)
Median household income for houses/condos without a mortgage ($)
Median household income ($)
Median household income ($) - White
Median household income ($) - Black or African American
Median household income ($) - Asian
Median household income ($) - Hispanic or Latino
Median household income ($) - American Indian and Alaska Native
Median household income ($) - Multirace
Median household income ($) - Other Race
Mortgage status - with mortgage (%)
Mortgage status - with second mortgage (%)
Mortgage status - with home equity loan (%)
Mortgage status - with both second mortgage and home equity loan (%)
Mortgage status - without a mortgage (%)
Median year house/condo built
Median year apartment built
Household type by relationship - Male householder living alone (%)
Household type by relationship - Male householder not living alone (%)
Household type by relationship - Female householder living alone (%)
Household type by relationship - Female householder not living alone (%)
Household type by relationship - Opposite-Sex spouse (%)
Household type by relationship - Same-Sex spouse (%)
Household type by relationship - Opposite-Sex unmarried partner (%)
Household type by relationship - Same-Sex unmarried partner (%)
Household type by relationship - In group quarters (%)
Size of family households - 2-person household (%)
Size of family households - 3-person household (%)
Size of family households - 4-person household (%)
Size of family households - 5-person household (%)
Size of family households - 6-person household (%)
Size of family households - 7-or-more-person household (%)
Size of nonfamily households - 1-person household (%)
Size of nonfamily households - 2-person household (%)
Size of nonfamily households - 3-person household (%)
Size of nonfamily households - 4-person household (%)
Size of nonfamily households - 5-person household (%)
Size of nonfamily households - 6-person household (%)
Size of nonfamily households - 7-or-moreperson household (%)
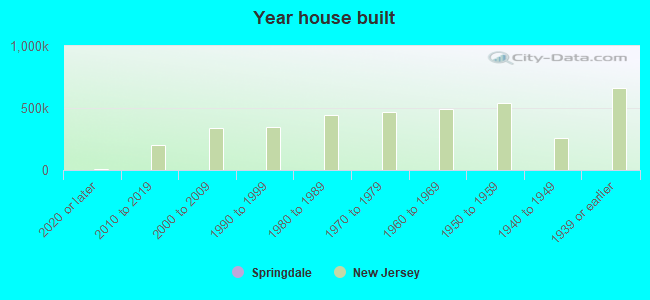
Year house built - Built 2010 or later (%)
Year house built - Built 2000 to 2009 (%)
Year house built - Built 1990 to 1999 (%)
Year house built - Built 1980 to 1989 (%)
Year house built - Built 1970 to 1979 (%)
Year house built - Built 1960 to 1969 (%)
Year house built - Built 1950 to 1959 (%)
Year house built - Built 1940 to 1949 (%)
Year house built - Built 1939 or earlier (%)
Median number of rooms in houses and condos
Median number of rooms in apartments
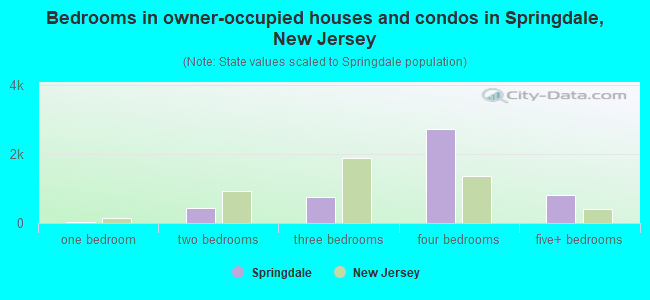
Median number of bedrooms in owner occupied houses
Mean number of bedrooms in owner occupied houses
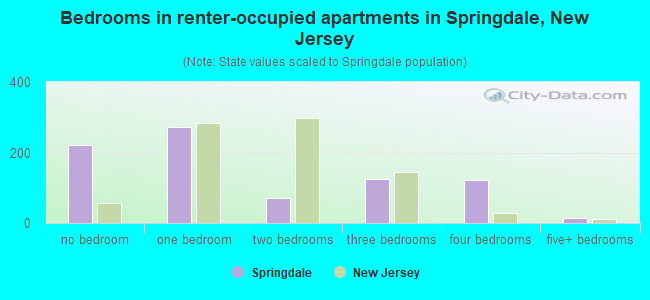
Median number of bedrooms in renter occupied houses
Mean number of bedrooms in renter occupied houses
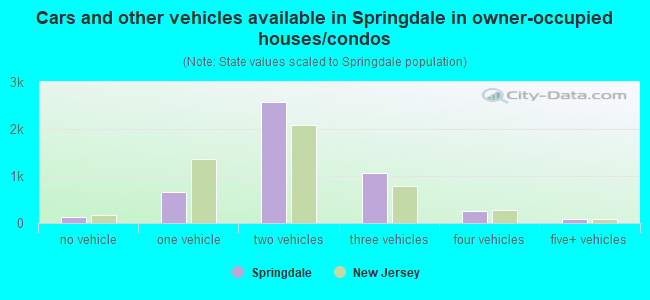
Median number of vehichles in owner occupied houses
Mean number of vehichles in owner occupied houses
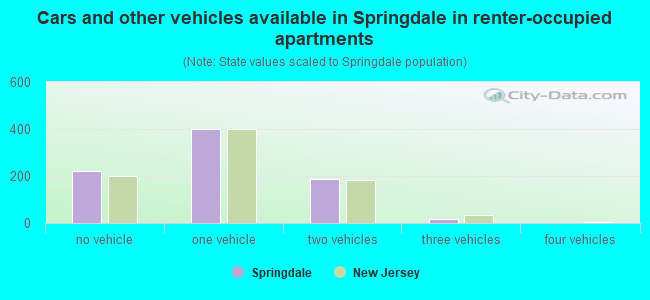
Median number of vehichles in renter occupied houses
Mean number of vehichles in renter occupied houses
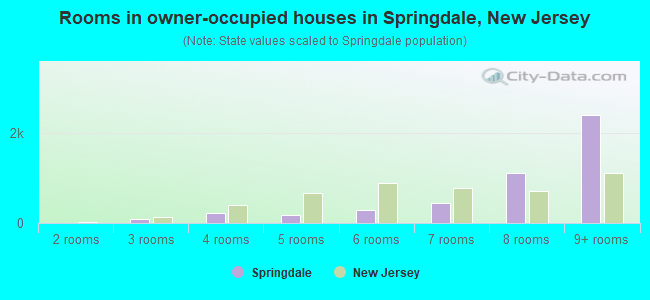
Rooms in owner-occupied houses - 1 room (%)
Rooms in owner-occupied houses - 2 rooms (%)
Rooms in owner-occupied houses - 3 rooms (%)
Rooms in owner-occupied houses - 4 rooms (%)
Rooms in owner-occupied houses - 5 rooms (%)
Rooms in owner-occupied houses - 6 rooms (%)
Rooms in owner-occupied houses - 7 rooms (%)
Rooms in owner-occupied houses - 8 rooms (%)
Rooms in owner-occupied houses - 9+ rooms (%)
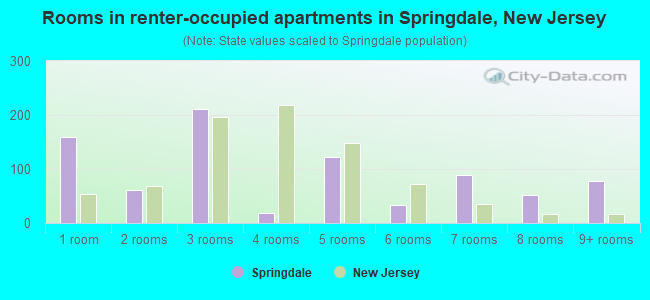
Rooms in renter-occupied houses - 1 room (%)
Rooms in renter-occupied houses - 2 rooms (%)
Rooms in renter-occupied houses - 3 rooms (%)
Rooms in renter-occupied houses - 4 rooms (%)
Rooms in renter-occupied houses - 5 rooms (%)
Rooms in renter-occupied houses - 6 rooms (%)
Rooms in renter-occupied houses - 7 rooms (%)
Rooms in renter-occupied houses - 8 rooms (%)
Rooms in renter-occupied houses - 9+ rooms (%)
Bedrooms in owner-occupied houses - no bedrooms (%)
Bedrooms in owner-occupied houses - 1 bedroom (%)
Bedrooms in owner-occupied houses - 2 bedrooms (%)
Bedrooms in owner-occupied houses - 3 bedrooms (%)
Bedrooms in owner-occupied houses - 4 bedrooms (%)
Bedrooms in owner-occupied houses - 5+ bedrooms (%)
Bedrooms in renter-occupied houses - no bedrooms (%)
Bedrooms in renter-occupied houses - 1 bedroom (%)
Bedrooms in renter-occupied houses - 2 bedrooms (%)
Bedrooms in renter-occupied houses - 3 bedrooms (%)
Bedrooms in renter-occupied houses - 4 bedrooms (%)
Bedrooms in renter-occupied houses - 5+ bedrooms (%)
Vehicles available in owner-occupied houses - no vehicle available (%)
Vehicles available in owner-occupied houses - 1 vehicle available(%)
Vehicles available in owner-occupied houses - 2 Vehicles available (%)
Vehicles available in owner-occupied houses - 3 Vehicles available (%)
Vehicles available in owner-occupied houses - 4 Vehicles available (%)
Vehicles available in owner-occupied houses - 5+ Vehicles available (%)
Vehicles available in renter-occupied houses - no vehicle available (%)
Vehicles available in renter-occupied houses - 1 vehicle available (%)
Vehicles available in renter-occupied houses - 2 Vehicles available (%)
Vehicles available in renter-occupied houses - 3 Vehicles available (%)
Vehicles available in renter-occupied houses - 4 Vehicles available (%)
Vehicles available in renter-occupied houses - 5+ Vehicles available (%)
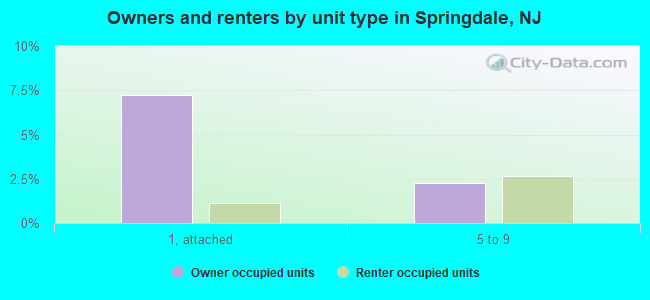
Housing units in structures - 1, detached (%)
Housing units in structures - 1, attached (%)
Housing units in structures - 2 (%)
Housing units in structures - 3 or 4 (%)
Housing units in structures - 5 to 9 (%)
Housing units in structures - 10 to 19 (%)
Housing units in structures - 20 to 49 (%)
Housing units in structures - 50 or more (%)
Housing units in structures - Mobile home (%)
Housing units in structures - Boat, RV, van, etc. (%)
Housing units in structures - Owners - 1, detached (%)
Housing units in structures - Owners - 1, attached (%)
Housing units in structures - Owners - 2 (%)
Housing units in structures - Owners - 3 or 4 (%)
Housing units in structures - Owners - 5 to 9 (%)
Housing units in structures - Owners - 10 to 19 (%)
Housing units in structures - Owners - 20 to 49 (%)
Housing units in structures - Owners - 50 or more (%)
Housing units in structures - Owners - Mobile home (%)
Housing units in structures - Owners - Boat, RV, van, etc. (%)
Housing units in structures - Renters - 1, detached (%)
Housing units in structures - Renters - 1, attached (%)
Housing units in structures - Renters - 2 (%)
Housing units in structures - Renters - 3 or 4 (%)
Housing units in structures - Renters - 5 to 9 (%)
Housing units in structures - Renters - 10 to 19 (%)
Housing units in structures - Renters - 20 to 49 (%)
Housing units in structures - Renters - 50 or more (%)
Housing units in structures - Renters - Mobile home (%)
Housing units in structures - Renters - Boat, RV, van, etc. (%)
House/condo owner moved in on average (years ago)
Renter moved in on average (years ago)
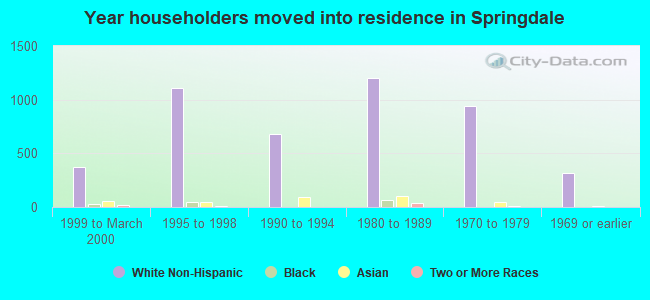
Year householder moved into unit - Moved in 1999 to March 2000 (%)
Year householder moved into unit - Moved in 1999 to March 2000 (%) - White
Year householder moved into unit - Moved in 1999 to March 2000 (%) - Black or African American
Year householder moved into unit - Moved in 1999 to March 2000 (%) - Asian
Year householder moved into unit - Moved in 1999 to March 2000 (%) - Hispanic or Latino
Year householder moved into unit - Moved in 1999 to March 2000 (%) - American Indian and Alaska Native
Year householder moved into unit - Moved in 1999 to March 2000 (%) - Multirace
Year householder moved into unit - Moved in 1999 to March 2000 (%) - Other Race
Year householder moved into unit - Moved in 1995 to 1998 (%)
Year householder moved into unit - Moved in 1995 to 1998 (%) - White
Year householder moved into unit - Moved in 1995 to 1998 (%) - Black or African American
Year householder moved into unit - Moved in 1995 to 1998 (%) - Asian
Year householder moved into unit - Moved in 1995 to 1998 (%) - Hispanic or Latino
Year householder moved into unit - Moved in 1995 to 1998 (%) - American Indian and Alaska Native
Year householder moved into unit - Moved in 1995 to 1998 (%) - Multirace
Year householder moved into unit - Moved in 1995 to 1998 (%) - Other Race
Year householder moved into unit - Moved in 1990 to 1994 (%)
Year householder moved into unit - Moved in 1990 to 1994 (%) - White
Year householder moved into unit - Moved in 1990 to 1994 (%) - Black or African American
Year householder moved into unit - Moved in 1990 to 1994 (%) - Asian
Year householder moved into unit - Moved in 1990 to 1994 (%) - Hispanic or Latino
Year householder moved into unit - Moved in 1990 to 1994 (%) - American Indian and Alaska Native
Year householder moved into unit - Moved in 1990 to 1994 (%) - Multirace
Year householder moved into unit - Moved in 1990 to 1994 (%) - Other Race
Year householder moved into unit - Moved in 1980 to 1989 (%)
Year householder moved into unit - Moved in 1980 to 1989 (%) - White
Year householder moved into unit - Moved in 1980 to 1989 (%) - Black or African American
Year householder moved into unit - Moved in 1980 to 1989 (%) - Asian
Year householder moved into unit - Moved in 1980 to 1989 (%) - Hispanic or Latino
Year householder moved into unit - Moved in 1980 to 1989 (%) - American Indian and Alaska Native
Year householder moved into unit - Moved in 1980 to 1989 (%) - Multirace
Year householder moved into unit - Moved in 1980 to 1989 (%) - Other Race
Year householder moved into unit - Moved in 1970 to 1979 (%)
Year householder moved into unit - Moved in 1970 to 1979 (%) - White
Year householder moved into unit - Moved in 1970 to 1979 (%) - Black or African American
Year householder moved into unit - Moved in 1970 to 1979 (%) - Asian
Year householder moved into unit - Moved in 1970 to 1979 (%) - Hispanic or Latino
Year householder moved into unit - Moved in 1970 to 1979 (%) - American Indian and Alaska Native
Year householder moved into unit - Moved in 1970 to 1979 (%) - Multirace
Year householder moved into unit - Moved in 1970 to 1979 (%) - Other Race
Year householder moved into unit - Moved in 1969 or earlier (%)
Year householder moved into unit - Moved in 1969 or earlier (%) - White
Year householder moved into unit - Moved in 1969 or earlier (%) - Black or African American
Year householder moved into unit - Moved in 1969 or earlier (%) - Asian
Year householder moved into unit - Moved in 1969 or earlier (%) - Hispanic or Latino
Year householder moved into unit - Moved in 1969 or earlier (%) - American Indian and Alaska Native
Year householder moved into unit - Moved in 1969 or earlier (%) - Multirace
Year householder moved into unit - Moved in 1969 or earlier (%) - Other Race
Housing units lacking complete plumbing facilities (%)
Housing units lacking complete kitchen facilities (%)
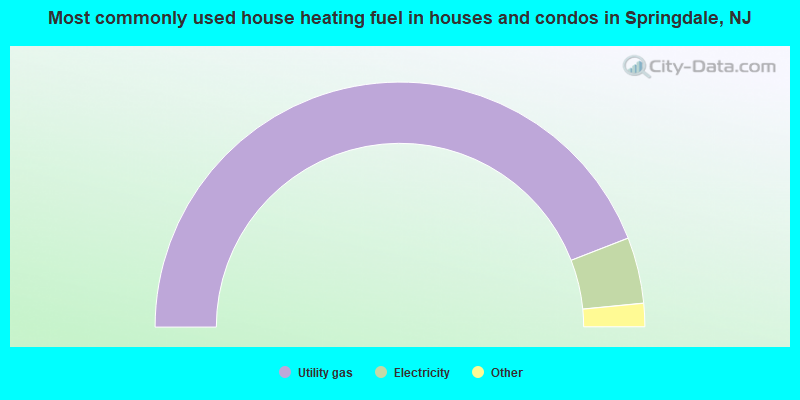
House heating fuel used in houses and condos - Utility gas (%)
House heating fuel used in houses and condos - Bottled, tank, or LP gas (%)
House heating fuel used in houses and condos - Electricity (%)
House heating fuel used in houses and condos - Fuel oil, kerosene, etc. (%)
House heating fuel used in houses and condos - Coal or coke (%)
House heating fuel used in houses and condos - Wood (%)
House heating fuel used in houses and condos - Solar energy (%)
House heating fuel used in houses and condos - Other fuel (%)
House heating fuel used in houses and condos - No fuel used (%)
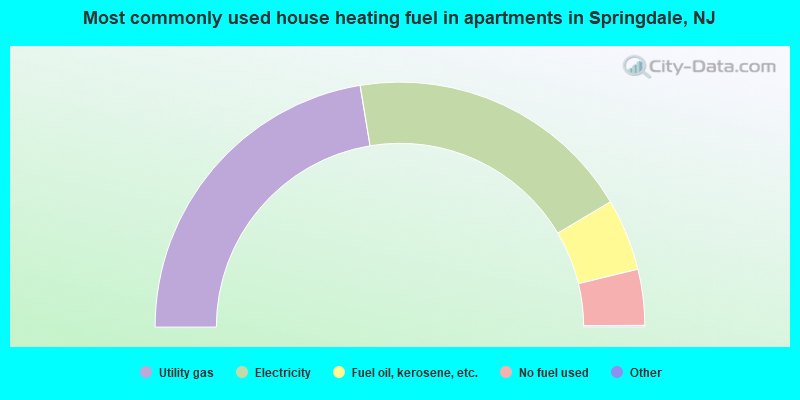
House heating fuel used in apartments - Utility gas (%)
House heating fuel used in apartments - Bottled, tank, or LP gas (%)
House heating fuel used in apartments - Electricity (%)
House heating fuel used in apartments - Fuel oil, kerosene, etc. (%)
House heating fuel used in apartments - Coal or coke (%)
House heating fuel used in apartments - Wood (%)
House heating fuel used in apartments - Solar energy (%)
House heating fuel used in apartments - Other fuel (%)
House heating fuel used in apartments - No fuel used (%)
Latest news about housing in Springdale, NJ collected exclusively by city-data.com from local newspapers, TV, and radio stations
Median year house/condo built: 1976Median year apartment built: 1984Household type by relationship:
Households: 15,314
Male householders: 3,139 (320 living alone ), Female householders: 2,349 (495 living alone )3,853 spouses (3,818 opposite-sex spouses ), 227 unmarried partners , (204 opposite-sex unmarried partners ), 4,849 children (4,734 natural , 91 adopted , 23 stepchildren ), 211 grandchildren , 43 brothers or sisters , 198 parents , 0 foster children , 85 other relatives , 117 non-relatives In group quarters: 239
Size of family households: 1,896 2-persons , 1,268 3-persons , 1,216 4-persons , 207 5-persons , 107 6-persons , 7 7-or-more-persons .
Size of nonfamily households: 825 1-person , 89 2-persons , 12 3-persons .
2,865 married couples with children. single-parent households (99 men , 140 women ).
75.6% of residents of Springdale speak English at home. of residents speak Spanish at home (50% speak English very well , 35% speak English well , 15% speak English not well ).of residents speak other Indo-European language at home (64% speak English very well , 29% speak English well , 7% speak English not well ).of residents speak Asian or Pacific Island language at home (44% speak English very well , 34% speak English well , 16% speak English not well , 6% don't speak English at all ).of residents speak other language at home (57% speak English very well , 24% speak English well , 8% speak English not well , 11% don't speak English at all ).
Foreign born population: 2,935 (19.2%)of them are naturalized citizens )
Median number of rooms in houses and condos:
Median number of rooms in apartments
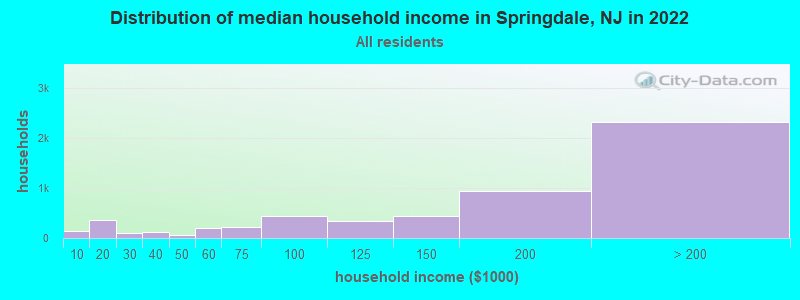
Springdale, NJ household income distribution 140 Less than $10,000362 $10,000 to $19,99991 $20,000 to $29,999129 $30,000 to $39,99961 $40,000 to $49,999191 $50,000 to $59,999210 $60,000 to $74,999433 $75,000 to $99,999341 $100,000 to $124,999442 $125,000 to $149,999936 $150,000 to $199,9992,314 $200,000 or more
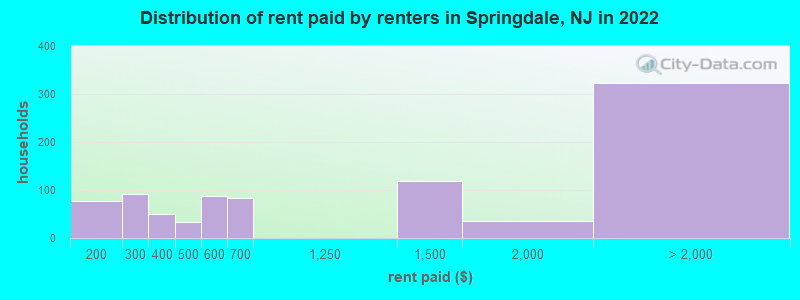
Home value of owner - occupied houses in 2022 in Springdale, NJ 6 $40,000 to $49,99923 $80,000 to $89,99949 $100,000 to $124,99965 $125,000 to $149,9999 $150,000 to $174,99981 $175,000 to $199,999191 $200,000 to $249,999266 $250,000 to $299,9991,351 $300,000 to $399,9991,831 $400,000 to $499,9991,725 $500,000 to $749,999262 $750,000 to $999,99958 $1,000,000 to $1,499,99923 $2,000,000 or moreRent paid by renters in 2022 in Springdale, NJ 66 $100 to $14911 $150 to $19920 $200 to $24971 $250 to $29927 $300 to $34923 $350 to $39933 $450 to $49941 $500 to $54945 $550 to $59983 $650 to $699119 $1,250 to $1,49935 $1,500 to $1,9995 $2,000 to $2,499217 $2,500 to $2,99978 $3,000 to $3,49922 No cash rent
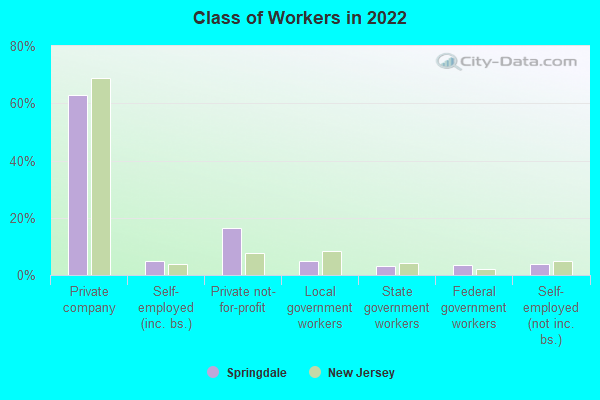
Percentage of workers working in this county: 61.0%Number of people working at home: 2,188 (29.5% of all workers )
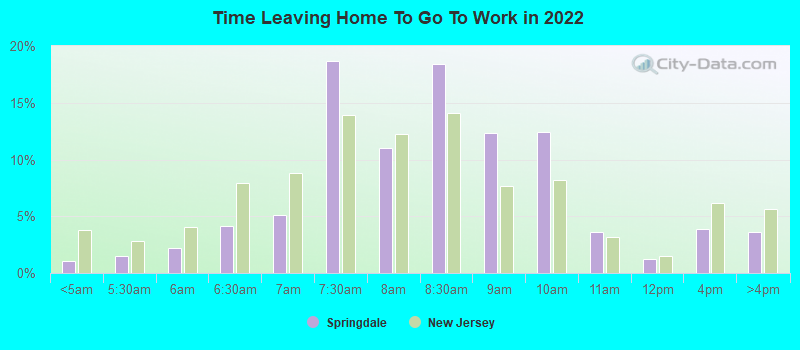
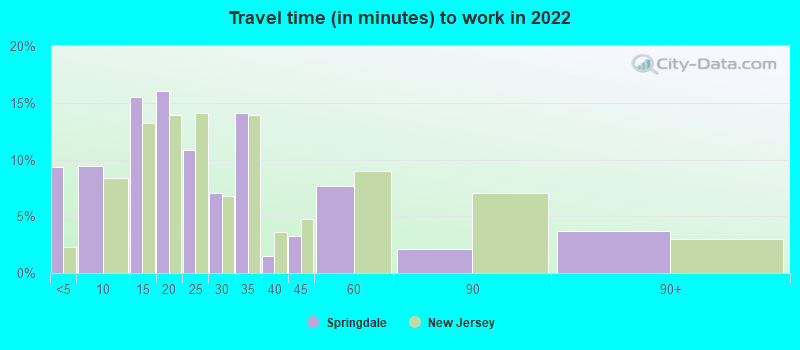
Travel time to work (commute)
Less than 5 minutes: 2725 to 9 minutes: 37810 to 14 minutes: 79015 to 19 minutes: 71420 to 24 minutes: 63325 to 29 minutes: 37230 to 34 minutes: 49035 to 39 minutes: 11440 to 44 minutes: 21945 to 59 minutes: 64560 to 89 minutes: 59490 or more minutes: 208
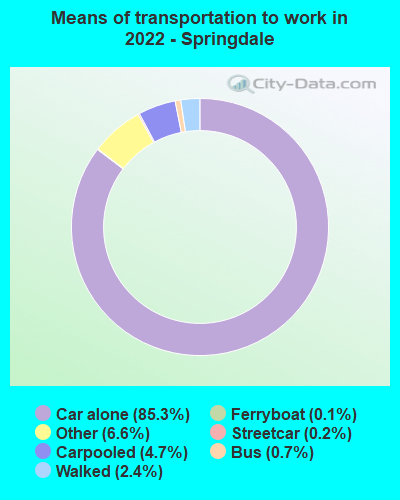
Means of transportation to work:
Drove a car alone: 2,420 (49.7%)Carpooled: 176 (3.6%)Bus : 24 (0.5%)Subway or elevated rail : 4 (0.1%)Ferryboat: 4 (0.1%)Taxi: 282 (5.8%)Walked: 96 (2.0%)Worked at home: 2,188 (44.9%)
Unemployment by race in 2022
Unemployment rate for White non-Hispanic residents 3.8% Males4.8% FemalesUnemployment rate for Asian residents 6.6% Males14.2% FemalesUnemployment rate for other race residents 79.2% FemalesUnemployment rate for two or more race residents 5.0% Males2.0% FemalesUnemployment rate for Hispanic or Latino residents 3.9% Males23.1% Females
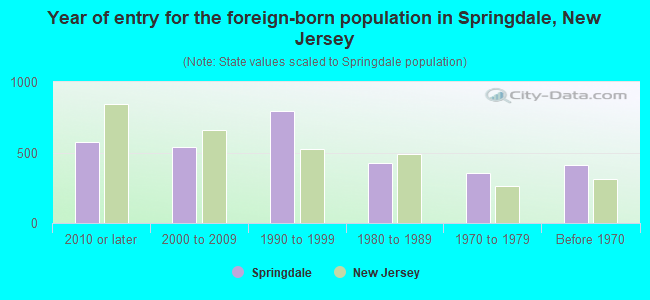
Year of entry for the foreign-born population in Springdale, New Jersey
574 2010 or later 538 2000 to 2009 793 1990 to 1999 423 1980 to 1989 352 1970 to 1979 409 Before 1970
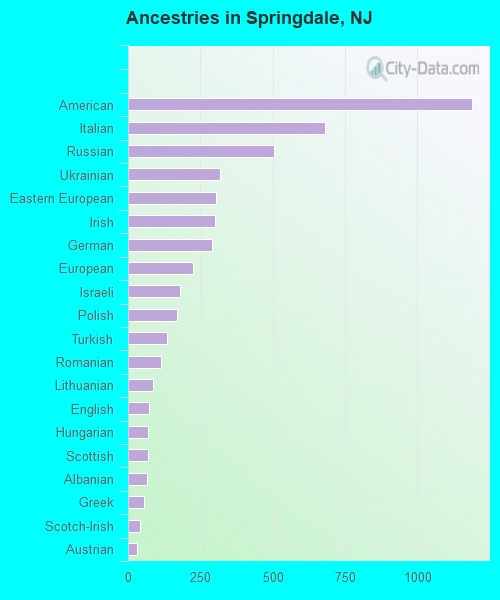
First ancestries reported:
American: 1,188 (15.0%)
Italian: 680 (8.6%)
Russian: 506 (6.4%)
Ukrainian: 318 (4.0%)
Eastern European: 304 (3.8%)
Irish: 302 (3.8%)
German: 291 (3.7%)
European: 223 (2.8%)
Israeli: 179 (2.3%)
Polish: 171 (2.2%)
Turkish: 134 (1.7%)
Romanian: 115 (1.5%)
Lithuanian: 85 (1.1%)
English: 71 (0.9%)
Hungarian: 69 (0.9%)
Scottish: 69 (0.9%)
Albanian: 65 (0.8%)
Greek: 56 (0.7%)
Scotch-Irish: 41 (0.5%)
Austrian: 30 (0.4%)
Iranian: 10 (0.1%)
British West Indian: 10 (0.1%)
Slovak: 9 (0.1%)
Egyptian: 8 (0.1%)
French: 7 (0.09%)
Croatian: 6 (0.08%)
Norwegian: 6 (0.08%)
Dutch: 5 (0.06%) Most common places of birth for foreign-born residents (%): India Springdale:
14.7% (422)New Jersey:
12.8% (274,609)
Korea Springdale:
13.0% (373)New Jersey:
3.3% (70,512)
Ukraine Springdale:
11.2% (321)New Jersey:
1.1% (22,760)
China, excluding Hong Kong and Taiwan Springdale:
10.2% (294)New Jersey:
3.7% (78,969)
Canada Springdale:
7.6% (218)New Jersey:
0.9% (18,317)
Israel Springdale:
6.8% (195)New Jersey:
0.5% (10,975)
Japan Springdale:
3.7% (106)New Jersey:
0.5% (10,042)
Russia Springdale:
3.4% (99)New Jersey:
0.9% (20,371)
Turkey Springdale:
3.2% (92)New Jersey:
0.8% (16,778)
Philippines Springdale:
2.8% (81)New Jersey:
4.0% (85,934)
Italy Springdale:
1.8% (53)New Jersey:
1.5% (33,198)
Vietnam Springdale:
1.7% (50)New Jersey:
0.7% (15,644)
Place of birth for U.S.-born residents:
This state: 4,789Other state: 7,382Northeast: 6,136Midwest: 337South: 606West: 320 90.7% of Springdale residents lived in the same house 1 years ago.
Out of people who lived in different houses, 29.7% lived in this county.
Out of people who lived in different counties, 34.5% lived in New Jersey.
Springdale:
90.7%State average:
90.4%
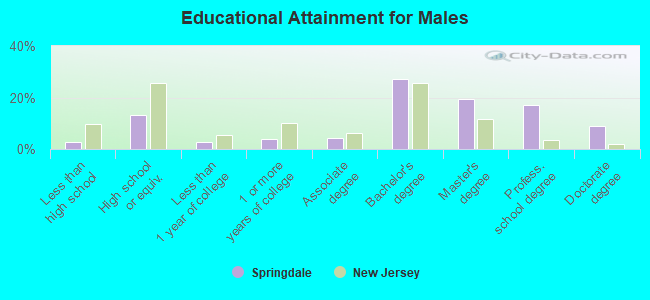
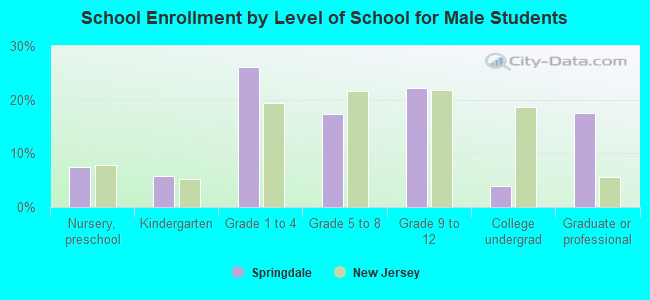
Education attainment for males 25 years and older:
No schooling: 62Nursery to 4th grade: 05th and 6th grade: 237th and 8th grade: 219th grade: 010th grade: 111th grade: 1812th grade, no diploma: 19High school graduate (or equivalency): 729Less than 1 year of college: 153Some college more than 1 year, no degree: 222Associate degree: 240Bachelor's degree: 1,491Master's degree: 1,068Professional school degree: 944Doctorate degree: 491
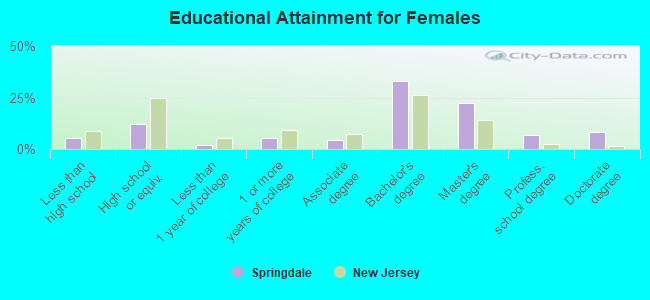
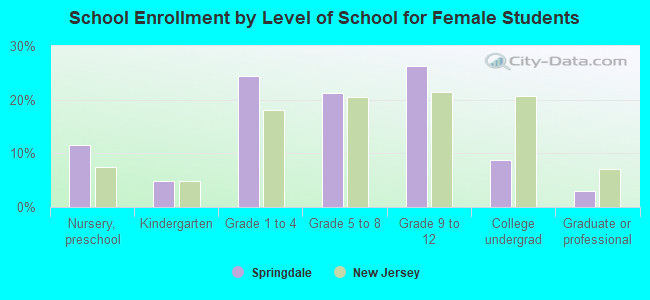
Education attainment for females 25 years and older:
No schooling: 66Nursery to 4th grade: 05th and 6th grade: 1347th and 8th grade: 09th grade: 010th grade: 2511th grade: 3712th grade, no diploma: 60High school graduate (or equivalency): 738Less than 1 year of college: 113Some college more than 1 year, no degree: 320Associate degree: 251Bachelor's degree: 1,974Master's degree: 1,353Professional school degree: 416Doctorate degree: 509
Housing units in structures:
One, detached: 4,237One, attached: 521Two: 493 or 4: 215 to 9: 28220 to 49: 5550 or more: 584Housing units lacking complete kitchen facilities in 2022: 3.2%House/condo owner moved in on average 16 years ago
Renter moved in on average 1 years ago
Private vs. public school enrollment:
Students in private schools in grades 1 to 8 (elementary and middle school): 177 Here:
10.8%New Jersey:
12.3%
Students in private schools in grades 9 to 12 (high school): 112 Here:
12.7%New Jersey:
13.1%
Students in private undergraduate colleges: 72 Here:
30.4%New Jersey:
33.2%