Springfield, MA (Massachusetts) Houses and Residents
Estimated median house or condo value in 2022: $226,700 (it was $86,500 in 2000 )
Springfield:
$226,700Massachusetts:
$534,700
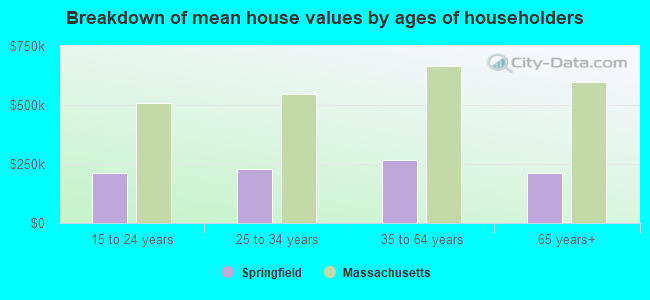
Lower value quartile - upper value quartile: $179,600 - $279,100Mean price in 2022: Detached houses: $262,257 Here:
$262,257State:
$651,570
Townhouses or other attached units: $175,492 Here:
$175,492State:
$617,749
In 2-unit structures: $191,333 Here:
$191,333State:
$594,808
In 3-to-4-unit structures: $146,694 Here:
$146,694State:
$601,912
In 5-or-more-unit structures: $161,557 Here:
$161,557State:
$555,768
Mobile homes: $98,268 Here:
$98,268State:
$170,209
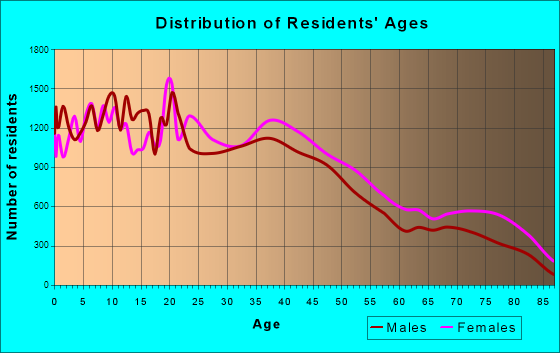
Total population: 153,991 (Urban population: 152,082, Rural population: 0)
Houses: 64,878 (60,172 occupied: 28,076 owner occupied, 32,096 renter occupied )
% of renters here:
53%State:
38%
Housing density: 2,021 houses/condos per square mile
Median price asked for vacant for-sale houses and condos in 2022: $583,101.
Median contract rent in 2022: $849 (lower quartile is $482, upper quartile is $1,143)
Median rent asked for vacant for-rent units in 2022: $619
Median gross rent in Springfield, MA in 2022: $1,019
Housing units in Springfield with a mortgage: 18,869 (1,743 second mortgage, 52 home equity loan, 1,566 both second mortgage and home equity loan )Houses without a mortgage: 471
Median household income for houses/condos with a mortgage: $80,530
Median household income for apartments without a mortgage: $59,701
Median monthly housing costs: $1,156
Data:
Median house or condo value ($)
Median house or condo value ($ change since 2000)
Median house or condo value ($) - White
Median house or condo value ($) - Black or African American
Median house or condo value ($) - Asian
Median house or condo value ($) - Hispanic or Latino
Median house or condo value ($) - American Indian and Alaska Native
Median house or condo value ($) - Multirace
Median house or condo value ($) - Other Race
Median price asked for mobile homes ($)
Household density (households per square mile)
Mean house or condo value by units in structure - 1, detached ($)
Mean house or condo value by units in structure - 1, attached ($)
Mean house or condo value by units in structure - 2 ($)
Mean house or condo value by units in structure by units in structure - 3 or 4 ($)
Mean house or condo value by units in structure - 5 or more ($)
Mean house or condo value by units in structure - Boat, RV, van, etc. ($)
Mean house or condo value by units in structure - Mobile home ($)
Median contract rent ($)
Median contract rent - Lower quartile ($)
Median contract rent - Upper quartile ($)
Median gross rent ($)
Urban houses (%)
Rural houses (%)
Houses occupied (%)
Houses occupied (% change since 2000)
Houses owner occupied (%)
Houses owner occupied (% change since 2000)
Houses renter occupied (%)
Houses renter occupied (% change since 2000)
Vacant housing units - For rent (%)
Vacant housing units - For rent (% change since 2000)
Vacant housing units - For sale only (%)
Vacant housing units - For sale only (% change since 2000)
Vacant housing units - Rented or sold, not occupied (%)
Vacant housing units - Rented or sold, not occupied (% change since 2000)
Vacant housing units - For seasonal, recreational, or occasional use (%)
Vacant housing units - For seasonal, recreational, or occasional use (% change since 2000)
Vacant housing units - For migrant workers (%)
Vacant housing units - For migrant workers (% change since 2000)
Vacant housing units - Other vacant (%)
Vacant housing units - Other vacant (% change since 2000)
Median monthly housing costs ($)
Median household income for houses/condos with a mortgage ($)
Median household income for houses/condos without a mortgage ($)
Median household income ($)
Median household income ($) - White
Median household income ($) - Black or African American
Median household income ($) - Asian
Median household income ($) - Hispanic or Latino
Median household income ($) - American Indian and Alaska Native
Median household income ($) - Multirace
Median household income ($) - Other Race
Mortgage status - with mortgage (%)
Mortgage status - with second mortgage (%)
Mortgage status - with home equity loan (%)
Mortgage status - with both second mortgage and home equity loan (%)
Mortgage status - without a mortgage (%)
Median year house/condo built
Median year apartment built
Household type by relationship - Male householder living alone (%)
Household type by relationship - Male householder not living alone (%)
Household type by relationship - Female householder living alone (%)
Household type by relationship - Female householder not living alone (%)
Household type by relationship - Opposite-Sex spouse (%)
Household type by relationship - Same-Sex spouse (%)
Household type by relationship - Opposite-Sex unmarried partner (%)
Household type by relationship - Same-Sex unmarried partner (%)
Household type by relationship - In group quarters (%)
Size of family households - 2-person household (%)
Size of family households - 3-person household (%)
Size of family households - 4-person household (%)
Size of family households - 5-person household (%)
Size of family households - 6-person household (%)
Size of family households - 7-or-more-person household (%)
Size of nonfamily households - 1-person household (%)
Size of nonfamily households - 2-person household (%)
Size of nonfamily households - 3-person household (%)
Size of nonfamily households - 4-person household (%)
Size of nonfamily households - 5-person household (%)
Size of nonfamily households - 6-person household (%)
Size of nonfamily households - 7-or-moreperson household (%)
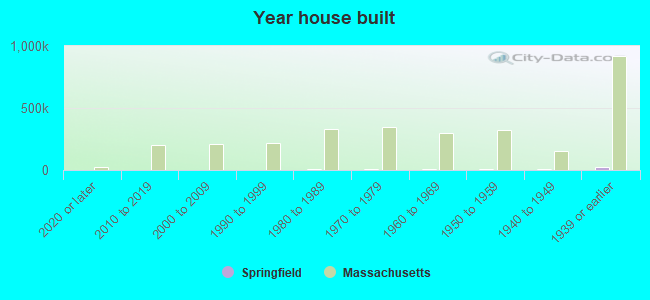
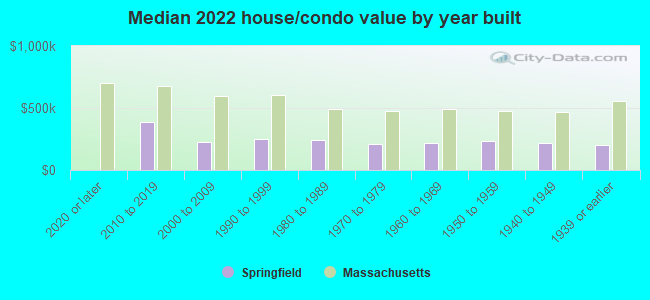
Year house built - Built 2010 or later (%)
Year house built - Built 2000 to 2009 (%)
Year house built - Built 1990 to 1999 (%)
Year house built - Built 1980 to 1989 (%)
Year house built - Built 1970 to 1979 (%)
Year house built - Built 1960 to 1969 (%)
Year house built - Built 1950 to 1959 (%)
Year house built - Built 1940 to 1949 (%)
Year house built - Built 1939 or earlier (%)
Median number of rooms in houses and condos
Median number of rooms in apartments
Median number of bedrooms in owner occupied houses
Mean number of bedrooms in owner occupied houses
Median number of bedrooms in renter occupied houses
Mean number of bedrooms in renter occupied houses
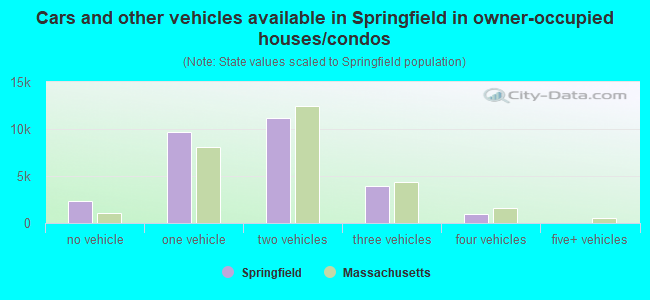
Median number of vehichles in owner occupied houses
Mean number of vehichles in owner occupied houses
Median number of vehichles in renter occupied houses
Mean number of vehichles in renter occupied houses
Rooms in owner-occupied houses - 1 room (%)
Rooms in owner-occupied houses - 2 rooms (%)
Rooms in owner-occupied houses - 3 rooms (%)
Rooms in owner-occupied houses - 4 rooms (%)
Rooms in owner-occupied houses - 5 rooms (%)
Rooms in owner-occupied houses - 6 rooms (%)
Rooms in owner-occupied houses - 7 rooms (%)
Rooms in owner-occupied houses - 8 rooms (%)
Rooms in owner-occupied houses - 9+ rooms (%)
Rooms in renter-occupied houses - 1 room (%)
Rooms in renter-occupied houses - 2 rooms (%)
Rooms in renter-occupied houses - 3 rooms (%)
Rooms in renter-occupied houses - 4 rooms (%)
Rooms in renter-occupied houses - 5 rooms (%)
Rooms in renter-occupied houses - 6 rooms (%)
Rooms in renter-occupied houses - 7 rooms (%)
Rooms in renter-occupied houses - 8 rooms (%)
Rooms in renter-occupied houses - 9+ rooms (%)
Bedrooms in owner-occupied houses - no bedrooms (%)
Bedrooms in owner-occupied houses - 1 bedroom (%)
Bedrooms in owner-occupied houses - 2 bedrooms (%)
Bedrooms in owner-occupied houses - 3 bedrooms (%)
Bedrooms in owner-occupied houses - 4 bedrooms (%)
Bedrooms in owner-occupied houses - 5+ bedrooms (%)
Bedrooms in renter-occupied houses - no bedrooms (%)
Bedrooms in renter-occupied houses - 1 bedroom (%)
Bedrooms in renter-occupied houses - 2 bedrooms (%)
Bedrooms in renter-occupied houses - 3 bedrooms (%)
Bedrooms in renter-occupied houses - 4 bedrooms (%)
Bedrooms in renter-occupied houses - 5+ bedrooms (%)
Vehicles available in owner-occupied houses - no vehicle available (%)
Vehicles available in owner-occupied houses - 1 vehicle available(%)
Vehicles available in owner-occupied houses - 2 Vehicles available (%)
Vehicles available in owner-occupied houses - 3 Vehicles available (%)
Vehicles available in owner-occupied houses - 4 Vehicles available (%)
Vehicles available in owner-occupied houses - 5+ Vehicles available (%)
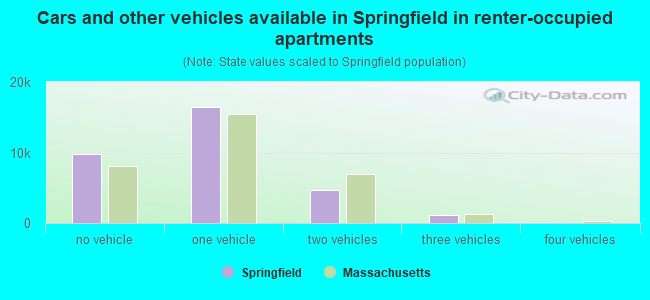
Vehicles available in renter-occupied houses - no vehicle available (%)
Vehicles available in renter-occupied houses - 1 vehicle available (%)
Vehicles available in renter-occupied houses - 2 Vehicles available (%)
Vehicles available in renter-occupied houses - 3 Vehicles available (%)
Vehicles available in renter-occupied houses - 4 Vehicles available (%)
Vehicles available in renter-occupied houses - 5+ Vehicles available (%)
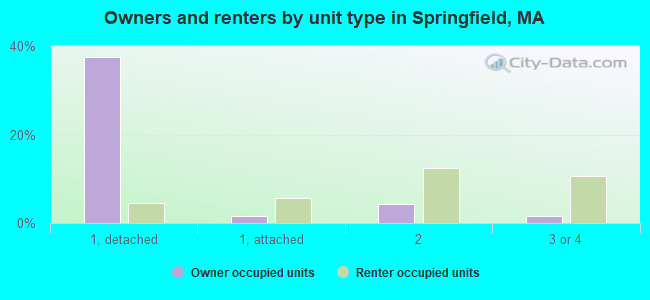
Housing units in structures - 1, detached (%)
Housing units in structures - 1, attached (%)
Housing units in structures - 2 (%)
Housing units in structures - 3 or 4 (%)
Housing units in structures - 5 to 9 (%)
Housing units in structures - 10 to 19 (%)
Housing units in structures - 20 to 49 (%)
Housing units in structures - 50 or more (%)
Housing units in structures - Mobile home (%)
Housing units in structures - Boat, RV, van, etc. (%)
Housing units in structures - Owners - 1, detached (%)
Housing units in structures - Owners - 1, attached (%)
Housing units in structures - Owners - 2 (%)
Housing units in structures - Owners - 3 or 4 (%)
Housing units in structures - Owners - 5 to 9 (%)
Housing units in structures - Owners - 10 to 19 (%)
Housing units in structures - Owners - 20 to 49 (%)
Housing units in structures - Owners - 50 or more (%)
Housing units in structures - Owners - Mobile home (%)
Housing units in structures - Owners - Boat, RV, van, etc. (%)
Housing units in structures - Renters - 1, detached (%)
Housing units in structures - Renters - 1, attached (%)
Housing units in structures - Renters - 2 (%)
Housing units in structures - Renters - 3 or 4 (%)
Housing units in structures - Renters - 5 to 9 (%)
Housing units in structures - Renters - 10 to 19 (%)
Housing units in structures - Renters - 20 to 49 (%)
Housing units in structures - Renters - 50 or more (%)
Housing units in structures - Renters - Mobile home (%)
Housing units in structures - Renters - Boat, RV, van, etc. (%)
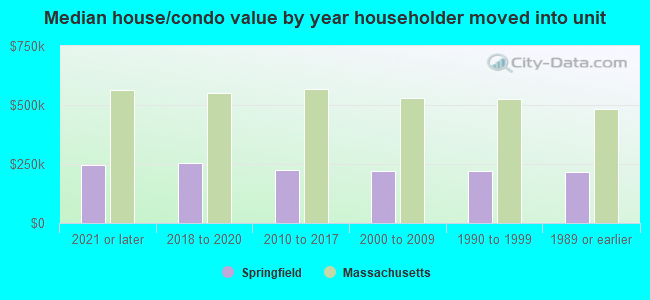
House/condo owner moved in on average (years ago)
Renter moved in on average (years ago)
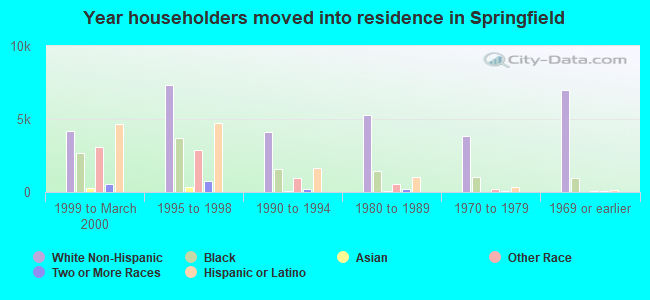
Year householder moved into unit - Moved in 1999 to March 2000 (%)
Year householder moved into unit - Moved in 1999 to March 2000 (%) - White
Year householder moved into unit - Moved in 1999 to March 2000 (%) - Black or African American
Year householder moved into unit - Moved in 1999 to March 2000 (%) - Asian
Year householder moved into unit - Moved in 1999 to March 2000 (%) - Hispanic or Latino
Year householder moved into unit - Moved in 1999 to March 2000 (%) - American Indian and Alaska Native
Year householder moved into unit - Moved in 1999 to March 2000 (%) - Multirace
Year householder moved into unit - Moved in 1999 to March 2000 (%) - Other Race
Year householder moved into unit - Moved in 1995 to 1998 (%)
Year householder moved into unit - Moved in 1995 to 1998 (%) - White
Year householder moved into unit - Moved in 1995 to 1998 (%) - Black or African American
Year householder moved into unit - Moved in 1995 to 1998 (%) - Asian
Year householder moved into unit - Moved in 1995 to 1998 (%) - Hispanic or Latino
Year householder moved into unit - Moved in 1995 to 1998 (%) - American Indian and Alaska Native
Year householder moved into unit - Moved in 1995 to 1998 (%) - Multirace
Year householder moved into unit - Moved in 1995 to 1998 (%) - Other Race
Year householder moved into unit - Moved in 1990 to 1994 (%)
Year householder moved into unit - Moved in 1990 to 1994 (%) - White
Year householder moved into unit - Moved in 1990 to 1994 (%) - Black or African American
Year householder moved into unit - Moved in 1990 to 1994 (%) - Asian
Year householder moved into unit - Moved in 1990 to 1994 (%) - Hispanic or Latino
Year householder moved into unit - Moved in 1990 to 1994 (%) - American Indian and Alaska Native
Year householder moved into unit - Moved in 1990 to 1994 (%) - Multirace
Year householder moved into unit - Moved in 1990 to 1994 (%) - Other Race
Year householder moved into unit - Moved in 1980 to 1989 (%)
Year householder moved into unit - Moved in 1980 to 1989 (%) - White
Year householder moved into unit - Moved in 1980 to 1989 (%) - Black or African American
Year householder moved into unit - Moved in 1980 to 1989 (%) - Asian
Year householder moved into unit - Moved in 1980 to 1989 (%) - Hispanic or Latino
Year householder moved into unit - Moved in 1980 to 1989 (%) - American Indian and Alaska Native
Year householder moved into unit - Moved in 1980 to 1989 (%) - Multirace
Year householder moved into unit - Moved in 1980 to 1989 (%) - Other Race
Year householder moved into unit - Moved in 1970 to 1979 (%)
Year householder moved into unit - Moved in 1970 to 1979 (%) - White
Year householder moved into unit - Moved in 1970 to 1979 (%) - Black or African American
Year householder moved into unit - Moved in 1970 to 1979 (%) - Asian
Year householder moved into unit - Moved in 1970 to 1979 (%) - Hispanic or Latino
Year householder moved into unit - Moved in 1970 to 1979 (%) - American Indian and Alaska Native
Year householder moved into unit - Moved in 1970 to 1979 (%) - Multirace
Year householder moved into unit - Moved in 1970 to 1979 (%) - Other Race
Year householder moved into unit - Moved in 1969 or earlier (%)
Year householder moved into unit - Moved in 1969 or earlier (%) - White
Year householder moved into unit - Moved in 1969 or earlier (%) - Black or African American
Year householder moved into unit - Moved in 1969 or earlier (%) - Asian
Year householder moved into unit - Moved in 1969 or earlier (%) - Hispanic or Latino
Year householder moved into unit - Moved in 1969 or earlier (%) - American Indian and Alaska Native
Year householder moved into unit - Moved in 1969 or earlier (%) - Multirace
Year householder moved into unit - Moved in 1969 or earlier (%) - Other Race
Housing units lacking complete plumbing facilities (%)
Housing units lacking complete kitchen facilities (%)
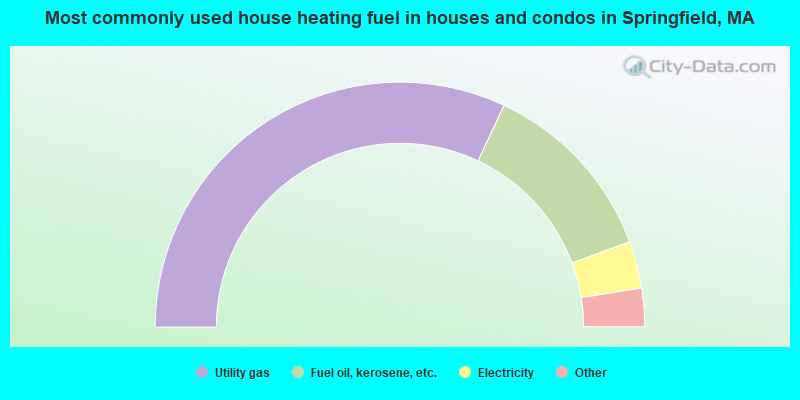
House heating fuel used in houses and condos - Utility gas (%)
House heating fuel used in houses and condos - Bottled, tank, or LP gas (%)
House heating fuel used in houses and condos - Electricity (%)
House heating fuel used in houses and condos - Fuel oil, kerosene, etc. (%)
House heating fuel used in houses and condos - Coal or coke (%)
House heating fuel used in houses and condos - Wood (%)
House heating fuel used in houses and condos - Solar energy (%)
House heating fuel used in houses and condos - Other fuel (%)
House heating fuel used in houses and condos - No fuel used (%)
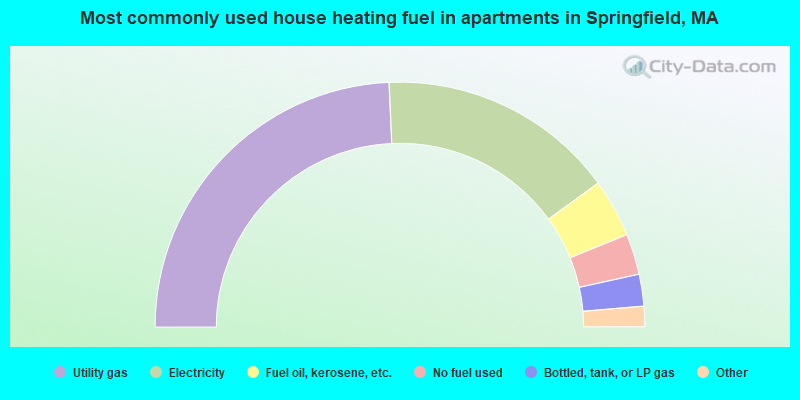
House heating fuel used in apartments - Utility gas (%)
House heating fuel used in apartments - Bottled, tank, or LP gas (%)
House heating fuel used in apartments - Electricity (%)
House heating fuel used in apartments - Fuel oil, kerosene, etc. (%)
House heating fuel used in apartments - Coal or coke (%)
House heating fuel used in apartments - Wood (%)
House heating fuel used in apartments - Solar energy (%)
House heating fuel used in apartments - Other fuel (%)
House heating fuel used in apartments - No fuel used (%)
Latest news about housing in Springfield, MA collected exclusively by city-data.com from local newspapers, TV, and radio stations
Median year house/condo built: 1952Median year apartment built: 1958Household type by relationship:
Households: 154,058
Male householders: 25,949 (9,483 living alone ), Female householders: 34,223 (11,002 living alone )18,572 spouses (18,530 opposite-sex spouses ), 6,206 unmarried partners , (5,752 opposite-sex unmarried partners ), 48,087 children (46,631 natural , 575 adopted , 881 stepchildren ), 3,626 grandchildren , 2,699 brothers or sisters , 2,399 parents , 0 foster children , 2,327 other relatives , 4,165 non-relatives In group quarters: 5,805
Size of family households: 14,720 2-persons , 9,079 3-persons , 5,618 4-persons , 3,577 5-persons , 1,216 6-persons , 747 7-or-more-persons .
Size of nonfamily households: 20,485 1-person , 4,420 2-persons , 121 3-persons , 132 4-persons , 57 5-persons .
12,396 married couples with children. single-parent households (3,058 men , 14,169 women ).
58.9% of residents of Springfield speak English at home. of residents speak Spanish at home (59% speak English very well , 15% speak English well , 17% speak English not well , 9% don't speak English at all ).of residents speak other Indo-European language at home (54% speak English very well , 21% speak English well , 21% speak English not well , 5% don't speak English at all ).of residents speak Asian or Pacific Island language at home (42% speak English very well , 38% speak English well , 16% speak English not well , 4% don't speak English at all ).of residents speak other language at home (58% speak English very well , 18% speak English well , 18% speak English not well , 6% don't speak English at all ).
Foreign born population: 18,288 (11.9%)of them are naturalized citizens )
Median number of rooms in houses and condos:
Median number of rooms in apartments
Owner-occupied Renter-occupied
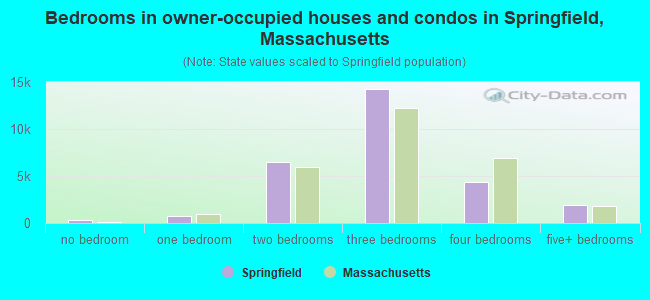
Bedrooms in owner-occupied houses and condos in Springfield, Massachusetts
363 no bedroom 729 1 bedroom 6,513 2 bedrooms 14,271 3 bedrooms 4,309 4 bedrooms 1,891 5+ bedrooms
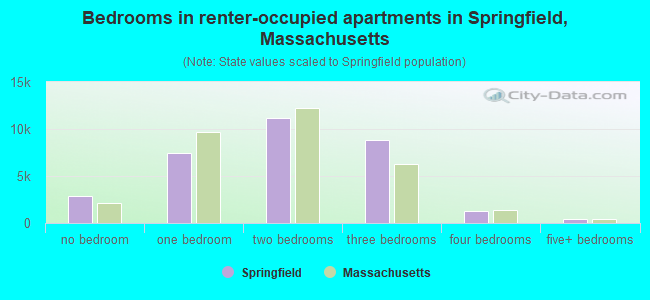
Bedrooms in renter-occupied apartments in Springfield, Massachusetts
2,827 no bedroom 7,473 1 bedroom 11,188 2 bedrooms 8,850 3 bedrooms 1,309 4 bedrooms 449 5+ bedrooms
Owner-occupied Renter-occupied
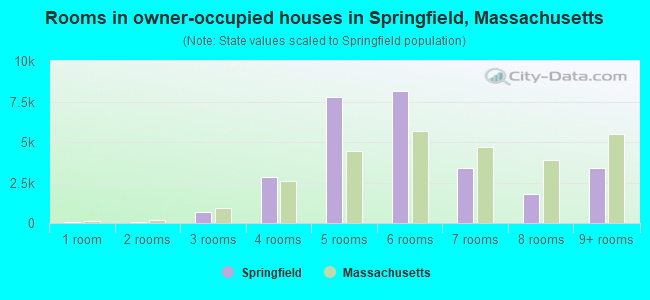
Rooms in owner-occupied houses in Springfield, Massachusetts
53 1 room 62 2 rooms 658 3 rooms 2,820 4 rooms 7,780 5 rooms 8,128 6 rooms 3,377 7 rooms 1,780 8 rooms 3,418 9+ rooms
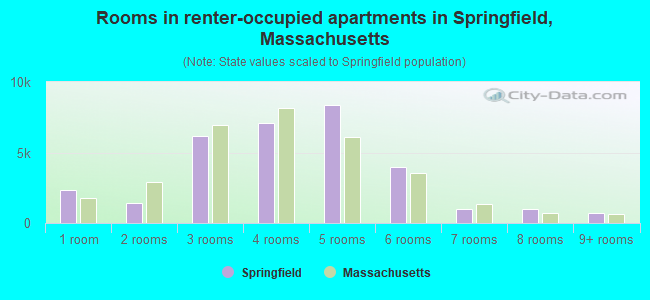
Rooms in renter-occupied apartments in Springfield, Massachusetts
2,362 1 room 1,444 2 rooms 6,173 3 rooms 7,062 4 rooms 8,390 5 rooms 3,943 6 rooms 1,022 7 rooms 1,017 8 rooms 683 9+ rooms
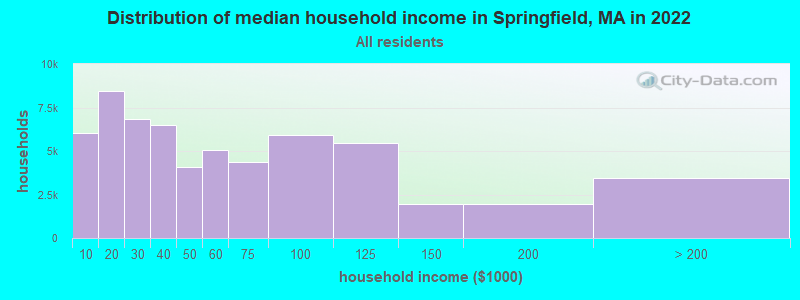
Springfield, MA household income distribution 6,059 Less than $10,0008,472 $10,000 to $19,9996,861 $20,000 to $29,9996,469 $30,000 to $39,9994,095 $40,000 to $49,9995,066 $50,000 to $59,9994,385 $60,000 to $74,9995,903 $75,000 to $99,9995,476 $100,000 to $124,9991,981 $125,000 to $149,9991,940 $150,000 to $199,9993,465 $200,000 or more
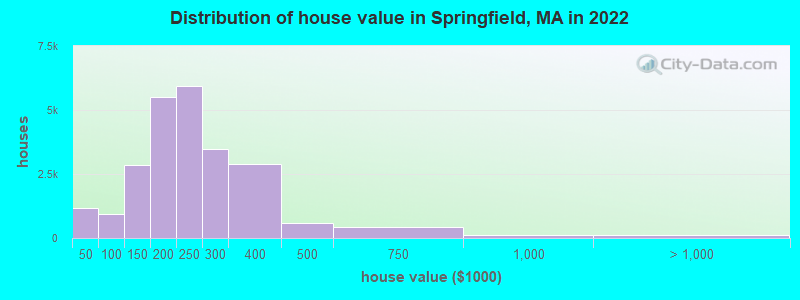
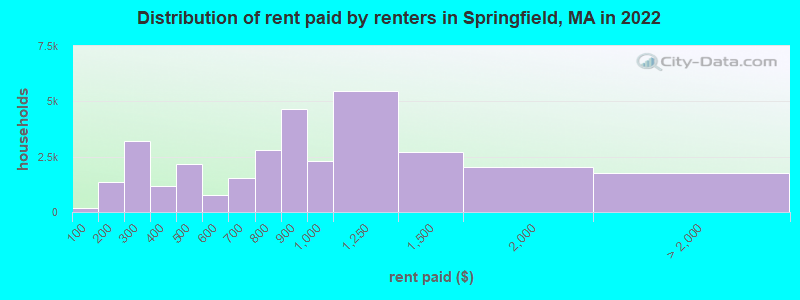
Home value of owner - occupied houses in 2022 in Springfield, MA 358 Less than $10,000166 $10,000 to $14,999253 $15,000 to $19,999223 $20,000 to $24,99987 $25,000 to $29,99911 $30,000 to $34,99941 $35,000 to $39,99928 $40,000 to $49,999151 $50,000 to $59,99934 $60,000 to $69,999300 $70,000 to $79,999153 $80,000 to $89,999263 $90,000 to $99,9991,577 $100,000 to $124,9991,268 $125,000 to $149,9992,205 $150,000 to $174,9993,308 $175,000 to $199,9995,949 $200,000 to $249,9993,491 $250,000 to $299,9992,897 $300,000 to $399,999601 $400,000 to $499,999445 $500,000 to $749,999112 $750,000 to $999,99940 $1,000,000 to $1,499,99994 $2,000,000 or moreRent paid by renters in 2022 in Springfield, MA 193 Less than $100748 $100 to $149604 $150 to $1991,368 $200 to $2491,829 $250 to $299532 $300 to $349626 $350 to $3991,229 $400 to $449953 $450 to $499555 $500 to $549199 $550 to $599859 $600 to $649688 $650 to $6991,479 $700 to $7491,332 $750 to $7994,634 $800 to $8992,294 $900 to $9995,450 $1,000 to $1,2492,698 $1,250 to $1,4992,043 $1,500 to $1,999473 $2,000 to $2,49969 $2,500 to $2,999119 $3,500 or more1,122 No cash rent
Percentage of workers working in this county: 89.8%Number of people working at home: 5,804 (8.8% of all workers )
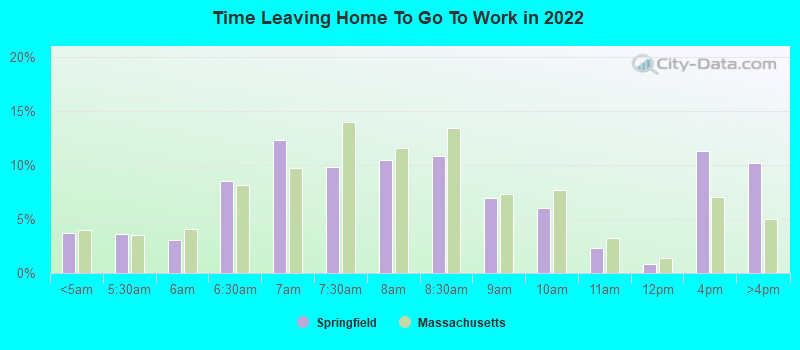
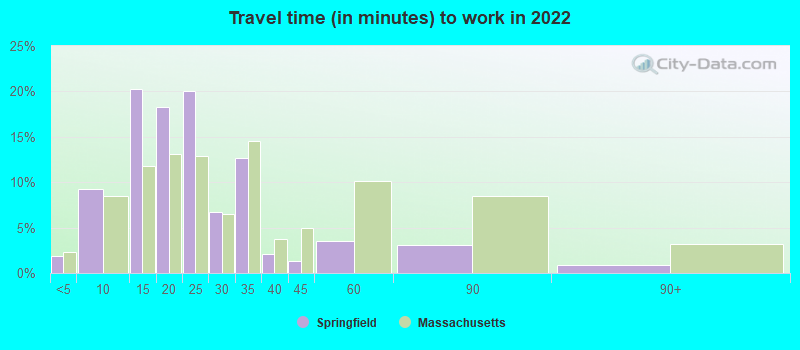
Travel time to work (commute)
Less than 5 minutes: 1,2665 to 9 minutes: 6,15610 to 14 minutes: 15,10615 to 19 minutes: 11,89720 to 24 minutes: 8,90225 to 29 minutes: 3,32530 to 34 minutes: 7,45635 to 39 minutes: 82640 to 44 minutes: 85845 to 59 minutes: 2,65260 to 89 minutes: 91390 or more minutes: 521
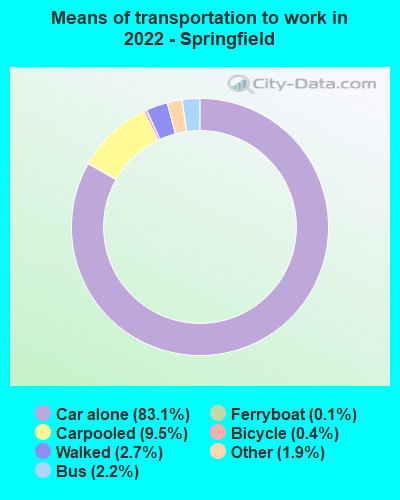
Means of transportation to work:
Drove a car alone: 59,757 (76.9%)Carpooled: 6,848 (8.8%)Bus : 1,580 (2.0%)Ferryboat: 85 (0.1%)Taxi: 1,361 (1.8%)Bicycle: 318 (0.4%)Walked: 1,935 (2.5%)Worked at home: 5,804 (7.5%)
Unemployment by race in 2022
Unemployment rate for White non-Hispanic residents 3.1% Males2.7% FemalesUnemployment rate for Black residents 5.0% Males2.8% FemalesUnemployment rate for American Indian and Alaska Native residents 13.0% Males6.4% FemalesUnemployment rate for Asian residents 2.0% Males1.2% FemalesUnemployment rate for other race residents 4.1% Males9.2% FemalesUnemployment rate for two or more race residents 9.1% Males14.9% FemalesUnemployment rate for Hispanic or Latino residents 3.4% Males11.4% Females
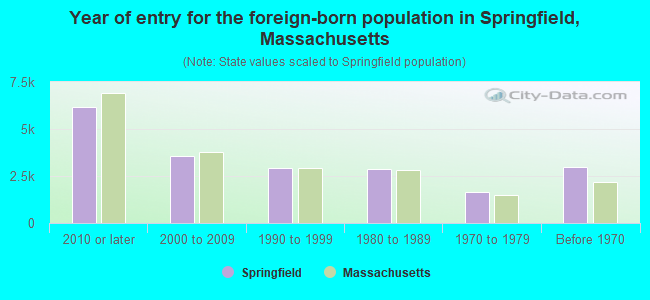
Year of entry for the foreign-born population in Springfield, Massachusetts
6,193 2010 or later 3,569 2000 to 2009 2,901 1990 to 1999 2,868 1980 to 1989 1,634 1970 to 1979 2,996 Before 1970
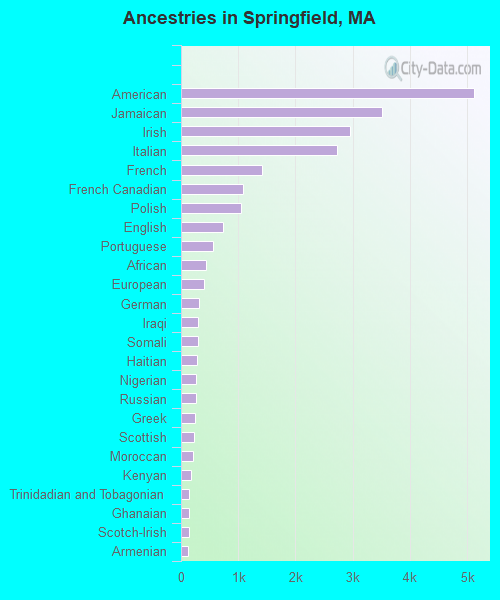
First ancestries reported:
American: 5,128 (5.2%)
Jamaican: 3,507 (3.6%)
Irish: 2,950 (3.0%)
Italian: 2,732 (2.8%)
French: 1,408 (1.4%)
French Canadian: 1,077 (1.1%)
Polish: 1,054 (1.1%)
English: 727 (0.7%)
Portuguese: 564 (0.6%)
African: 429 (0.4%)
European: 395 (0.4%)
German: 314 (0.3%)
Iraqi: 290 (0.3%)
Somali: 290 (0.3%)
Haitian: 273 (0.3%)
Nigerian: 261 (0.3%)
Russian: 255 (0.3%)
Greek: 248 (0.3%)
Scottish: 235 (0.2%)
Moroccan: 202 (0.2%)
Kenyan: 183 (0.2%)
Trinidadian and Tobagonian: 142 (0.1%)
Ghanaian: 140 (0.1%)
Scotch-Irish: 136 (0.1%)
Armenian: 115 (0.1%)
Guyanese: 101 (0.1%)
Canadian: 96 (0.10%)
Lebanese: 93 (0.10%)
Ukrainian: 90 (0.09%)
British West Indian: 84 (0.09%)
Cape Verdean: 79 (0.08%)
Eastern European: 69 (0.07%)
U.S. Virgin Islander: 54 (0.06%)
Brazilian: 44 (0.05%)
Swedish: 44 (0.05%)
Barbadian: 44 (0.05%)
Basque: 37 (0.04%)
Dutch: 36 (0.04%)
Egyptian: 35 (0.04%)
Northern European: 32 (0.03%)
Jordanian: 29 (0.03%)
Lithuanian: 29 (0.03%)
Iranian: 28 (0.03%)
Sudanese: 28 (0.03%)
Finnish: 27 (0.03%)
Arab: 26 (0.03%)
Belizean: 25 (0.03%)
Ethiopian: 25 (0.03%)
West Indian: 25 (0.03%)
Sierra Leonean: 20 (0.02%)
Turkish: 20 (0.02%)
British: 19 (0.02%)
Danish: 13 (0.01%)
Bulgarian: 11 (0.01%)
Belgian: 10 (0.01%)
Romanian: 9 (0.01%)
Welsh: 9 (0.01%)
Czechoslovakian: 7 (0.01%)
Celtic: 6 (0.01%)
Liberian: 6 (0.01%)
Australian: 5 (0.01%)
Pennsylvania German: 5 (0.01%)
Most common places of birth for foreign-born residents (%): Jamaica Springfield:
18.4% (3,002)Massachusetts:
1.7% (21,468)
Dominican Republic Springfield:
15.2% (2,492)Massachusetts:
8.3% (101,767)
Guatemala Springfield:
6.6% (1,080)Massachusetts:
2.7% (32,733)
Vietnam Springfield:
5.8% (952)Massachusetts:
3.0% (37,197)
Mexico Springfield:
3.8% (618)Massachusetts:
1.1% (13,065)
Other Eastern Africa Springfield:
3.3% (533)Massachusetts:
0.1% (1,829)
Colombia Springfield:
2.9% (478)Massachusetts:
2.3% (27,810)
Nepal Springfield:
2.7% (449)Massachusetts:
0.6% (6,789)
El Salvador Springfield:
2.3% (384)Massachusetts:
3.7% (45,667)
Peru Springfield:
1.8% (300)Massachusetts:
0.6% (7,349)
China, excluding Hong Kong and Taiwan Springfield:
1.8% (295)Massachusetts:
8.4% (103,233)
Laos Springfield:
1.8% (289)Massachusetts:
0.2% (2,448)
Ghana Springfield:
1.6% (260)Massachusetts:
1.0% (12,327)
Place of birth for U.S.-born residents:
This state: 78,987Other state: 30,012Northeast: 23,192Midwest: 1,358South: 4,839West: 623 90.6% of Springfield residents lived in the same house 1 years ago.
Out of people who lived in different houses, 41.5% lived in this county.
Out of people who lived in different counties, 70.8% lived in Massachusetts.
Springfield:
90.6%State average:
87.7%
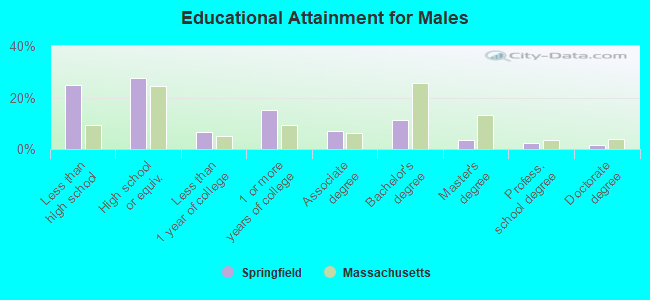
Education attainment for males 25 years and older:
No schooling: 1,851Nursery to 4th grade: 7755th and 6th grade: 9237th and 8th grade: 1,3349th grade: 1,54310th grade: 1,68511th grade: 2,01012th grade, no diploma: 1,603High school graduate (or equivalency): 12,912Less than 1 year of college: 3,127Some college more than 1 year, no degree: 7,144Associate degree: 3,233Bachelor's degree: 5,202Master's degree: 1,664Professional school degree: 1,086Doctorate degree: 775
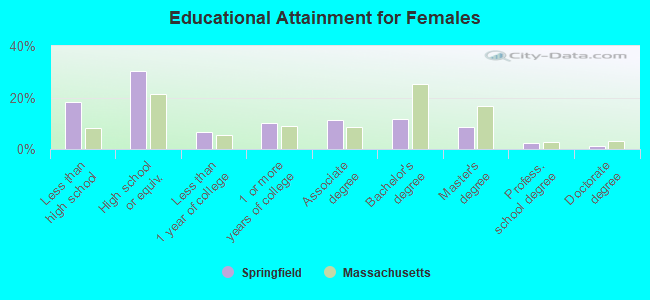
Education attainment for females 25 years and older:
No schooling: 1,818Nursery to 4th grade: 4925th and 6th grade: 7697th and 8th grade: 1,0119th grade: 1,51010th grade: 63211th grade: 2,24612th grade, no diploma: 1,461High school graduate (or equivalency): 16,487Less than 1 year of college: 3,598Some college more than 1 year, no degree: 5,379Associate degree: 6,101Bachelor's degree: 6,326Master's degree: 4,581Professional school degree: 1,184Doctorate degree: 666
Housing units in structures:
One, detached: 26,475One, attached: 4,393Two: 11,2533 or 4: 7,9945 to 9: 3,80710 to 19: 2,51520 to 49: 2,24050 or more: 5,247Mobile homes: 954Median worth of mobile homes: $80,605
Housing units lacking complete plumbing facilities in 2022: 2.2%Housing units lacking complete kitchen facilities in 2022: 2.8%House/condo owner moved in on average 13 years ago
Renter moved in on average 4 years ago
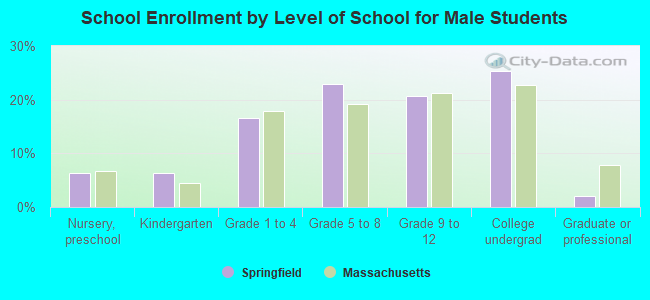
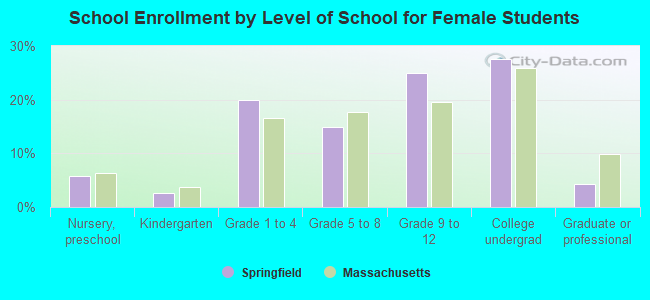
Private vs. public school enrollment:
Students in private schools in grades 1 to 8 (elementary and middle school): 1,090 Here:
7.5%Massachusetts:
10.3%
Students in private schools in grades 9 to 12 (high school): 1,205 Here:
13.6%Massachusetts:
12.3%
Students in private undergraduate colleges: 4,381 Here:
42.5%Massachusetts:
51.2%