St. Augustine South, FL (Florida) Houses and Residents
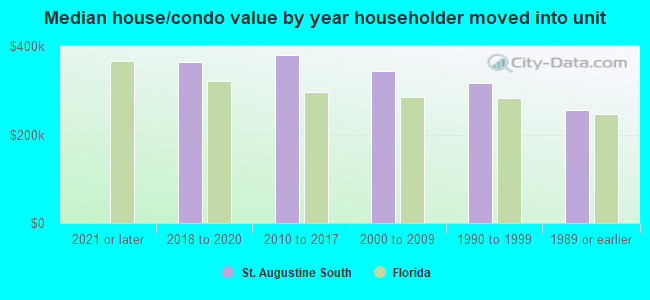
| St. Augustine South: | $342,276 |
| Florida: | $354,100 |
Total population: 4,998 (All urban)
Houses: 2,624 (2,376 occupied: 2,210 owner occupied, 310 renter occupied)
| % of renters here: | 12% |
| State: | 33% |
Housing density: 1,526 houses/condos per square mile
Median price asked for vacant for-sale houses and condos in 2022 in this county: $371,809.
Median contract rent in 2022: $1,004
Median gross rent in St. Augustine South, FL in 2022: $1,468
Housing units in St. Augustine South with a mortgage: 1,203 (164 second mortgage, 0 home equity loan, 161 both second mortgage and home equity loan)
Houses without a mortgage: 16
Median household income for houses/condos with a mortgage: $76,626
Median household income for apartments without a mortgage: $61,582
Median monthly housing costs: $1,052
Compare current foreclosures near St. Augustine South, FL:
| Photo | Address | Area | Beds / Baths | Price | Details |
|---|---|---|---|---|---|

|
#1
Forbes Rd
Saint Augustine, FL 32092
|
1,152 sq. feet
|
2 baths 3 beds |
$275,000
|
show details |

|
#2
Pine St
Saint Augustine, FL 32084
|
2,102 sq. feet
|
2 baths 3 beds |
show details | |

|
#3
Oak Arbor Cir
Saint Augustine, FL 32084
|
1,660 sq. feet
|
2 baths 3 beds |
show details | |

|
#4
Island Green Dr
Saint Augustine, FL 32092
|
1,794 sq. feet
|
2 baths 3 beds |
show details | |

|
#5
Roberta St
Hastings, FL 32145
|
1,512 sq. feet
|
2 baths 3 beds |
show details | |

|
#6
Barrington Cir
Saint Augustine, FL 32092
|
2,205 sq. feet
|
3 baths 4 beds |
show details | |

|
#7
Hibiscus St
Saint Augustine, FL 32084
|
888 sq. feet
|
1 baths 2 beds |
show details | |

|
#8
Wynfield Cir
Saint Augustine, FL 32092
|
1,126 sq. feet
|
1 baths 3 beds |
show details | |

|
#9
Barrington Cir
Saint Augustine, FL 32092
|
2,270 sq. feet
|
2 baths 3 beds |
show details | |

|
#10
Maclaren St
Saint Augustine, FL 32092
|
1,694 sq. feet
|
2 baths 3 beds |
show details |
| Photo | Address | Area | Beds / Baths | Price | Details |
|---|---|---|---|---|---|

|
#11
Earl St
Hastings, FL 32145
|
1,216 sq. feet
|
2 baths 2 beds |
show details | |

|
#12
N Volusia St
Saint Augustine, FL 32084
|
1,165 sq. feet
|
1 baths 3 beds |
show details | |

|
#13
N Alatamaha St
Saint Augustine, FL 32092
|
2,814 sq. feet
|
3 baths 4 beds |
show details | |

|
#14
Paradise Pond Rd
Saint Augustine, FL 32092
|
1,853 sq. feet
|
2 baths 3 beds |
show details | |

|
#15
W King St
Saint Augustine, FL 32084
|
1,094 sq. feet
|
1 baths 2 beds |
show details | |

|
#16
Harold St
Hastings, FL 32145
|
1,620 sq. feet
|
2 baths 3 beds |
show details | |

|
#17
Laramie Dr
Palm Coast, FL 32137
|
1,790 sq. feet
|
2 baths - beds |
show details | |

|
#18
Sweetbay Dr
Palm Coast, FL 32137
|
1,950 sq. feet
|
2 baths - beds |
show details | |

|
#19
Tuscan Way Ste 202
Saint Augustine, FL 32092
|
- sq. feet
|
- baths - beds |
show details | |

|
#20
Tuscan Way, Ste 202 Pmb 105
Saint Augustine, FL 32092
|
- sq. feet
|
- baths - beds |
show details |
| Photo | Address | Area | Beds / Baths | Price | Details |
|---|---|---|---|---|---|

|
#21
Legendary Dr Unit 103
Saint Augustine, FL 32092
|
- sq. feet
|
- baths - beds |
show details | |

|
#22
Porto Cristo Ave
Saint Augustine, FL 32092
|
2,792 sq. feet
|
- baths - beds |
show details | |

|
#23
Prince Rd
Saint Augustine, FL 32086
|
2,036 sq. feet
|
- baths - beds |
show details | |

|
#24
Garibaldi Way
Saint Augustine, FL 32092
|
- sq. feet
|
- baths - beds |
show details | |

|
#25
Porta Rosa Cir
Saint Augustine, FL 32092
|
- sq. feet
|
- baths - beds |
show details | |

|
#26
Casa Sevilla Ave
Saint Augustine, FL 32092
|
2,075 sq. feet
|
- baths - beds |
show details | |

|
#27
Converse Ct
Saint Augustine, FL 32092
|
2,481 sq. feet
|
- baths - beds |
show details | |

|
#28
Colorado Springs Way
Saint Augustine, FL 32092
|
- sq. feet
|
- baths - beds |
show details | |

|
#29
Cloverbank Rd
Saint Augustine, FL 32092
|
- sq. feet
|
- baths - beds |
show details | |

|
#30
Stokes Landing Rd
Saint Augustine, FL 32095
|
- sq. feet
|
- baths - beds |
show details |
| Photo | Address | Area | Beds / Baths | Price | Details |
|---|---|---|---|---|---|

|
#31
Pony Ln
Saint Augustine, FL 32095
|
1,152 sq. feet
|
- baths - beds |
show details | |

|
#32
Saint Marks Pond Blvd
Saint Augustine, FL 32095
|
- sq. feet
|
- baths - beds |
show details | |

|
#33
Venetian Blvd
Saint Augustine, FL 32095
|
1,686 sq. feet
|
- baths - beds |
show details | |

|
#34
Kohler Rd
Saint Augustine, FL 32092
|
- sq. feet
|
- baths - beds |
show details | |

|
#35
Onate Cir
Saint Augustine, FL 32095
|
- sq. feet
|
- baths - beds |
show details | |

|
#36
Bermudez Way
Saint Augustine, FL 32095
|
- sq. feet
|
- baths - beds |
show details | |

|
#37
Island View Cir
Saint Augustine, FL 32095
|
1,395 sq. feet
|
- baths - beds |
show details | |

|
#38
Prairie Ridge Dr
Saint Augustine, FL 32092
|
- sq. feet
|
- baths - beds |
show details | |

|
#39
Paradise Pond Rd
Saint Augustine, FL 32092
|
- sq. feet
|
- baths - beds |
show details | |

|
#40
Egrets Landing Ln
Saint Augustine, FL 32095
|
- sq. feet
|
- baths - beds |
show details |
| Photo | Address | Area | Beds / Baths | Price | Details |
|---|---|---|---|---|---|

|
#41
Silver Glen Ave
Saint Augustine, FL 32092
|
- sq. feet
|
- baths - beds |
show details | |

|
#42
Newland Ct
Saint Augustine, FL 32092
|
- sq. feet
|
- baths - beds |
show details | |

|
#43
Rosehill Ct
Saint Augustine, FL 32092
|
- sq. feet
|
- baths - beds |
show details | |

|
#44
Meadow Ridge Dr
Saint Augustine, FL 32092
|
- sq. feet
|
- baths - beds |
show details | |

|
#45
Anthem Ridge Dr
Ponte Vedra, FL 32081
|
- sq. feet
|
- baths - beds |
show details | |

|
#46
Guzman Ave
Hastings, FL 32145
|
1,720 sq. feet
|
- baths - beds |
show details | |

|
#47
Bonita Dr
Palatka, FL 32177
|
- sq. feet
|
- baths - beds |
show details | |

|
#48
Vista Lake Cir
Ponte Vedra, FL 32081
|
- sq. feet
|
- baths - beds |
show details | |

|
#49
Silver Glen Ave
Saint Augustine, FL 32092
|
2,213 sq. feet
|
- baths - beds |
show details | |

|
Check over 1 million property listings on Foreclosure.com!
|
browse all offers | |||


Median year apartment built: 1985
Household type by relationship:
Households: 5,600- Male householders: 1,148 (318 living alone), Female householders: 1,221 (330 living alone)
1,079 spouses (1,079 opposite-sex spouses), 263 unmarried partners, (263 opposite-sex unmarried partners), 1,333 children (1,333 natural, 0 adopted, 0 stepchildren), 158 grandchildren, 0 brothers or sisters, 112 parents, 0 foster children, 110 other relatives, 135 non-relatives
- In group quarters: 37
Size of family households: 846 2-persons, 566 3-persons, 147 4-persons, 103 5-persons, 26 6-persons.
Size of nonfamily households: 660 1-person, 181 2-persons.
328 married couples with children.
211 single-parent households (82 men, 129 women).
93.9% of residents of St. Augustine South speak English at home.
2.4% of residents speak Spanish at home (65% speak English very well, 24% speak English well, 11% don't speak English at all).
1.3% of residents speak other Indo-European language at home (70% speak English very well, 30% speak English well).
1.8% of residents speak Asian or Pacific Island language at home (94% speak English very well, 6% speak English well).
Foreign born population: 157 (2.8%)
(101.9% of them are naturalized citizens)
| Here: | 5.8 |
| State: | 5.9 |
| Here: | 6.7 |
| State: | 4.2 |
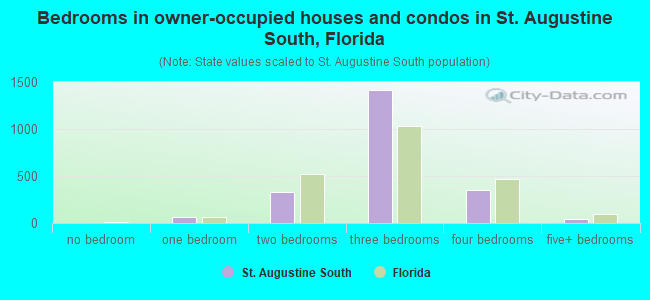
- Bedrooms in owner-occupied houses and condos in St. Augustine South, Florida
- 0no bedroom
- 601 bedroom
- 3352 bedrooms
- 1,4183 bedrooms
- 3524 bedrooms
- 465+ bedrooms
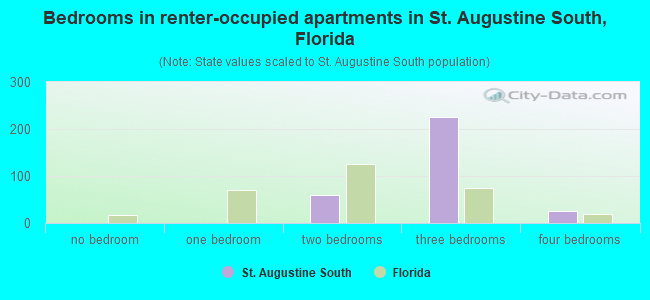
- Bedrooms in renter-occupied apartments in St. Augustine South, Florida
- 0no bedroom
- 01 bedroom
- 602 bedrooms
- 2263 bedrooms
- 254 bedrooms
- 05+ bedrooms
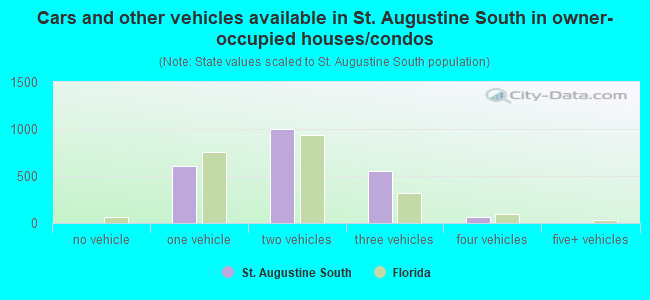
- Cars and other vehicles available in St. Augustine South in owner-occupied houses/condos
- 0no vehicle
- 6021 vehicle
- 9982 vehicles
- 5493 vehicles
- 624 vehicles
- 05+ vehicles
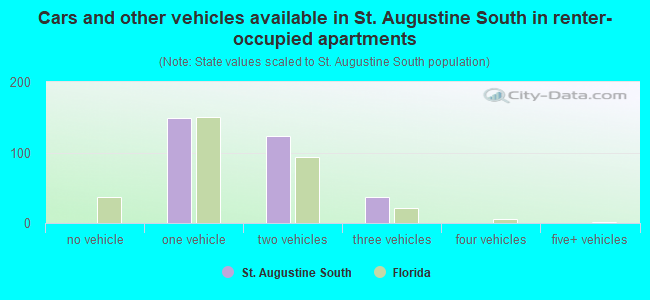
- Cars and other vehicles available in St. Augustine South in renter-occupied apartments
- 0no vehicle
- 1491 vehicle
- 1242 vehicles
- 373 vehicles
- 04 vehicles
- 05+ vehicles
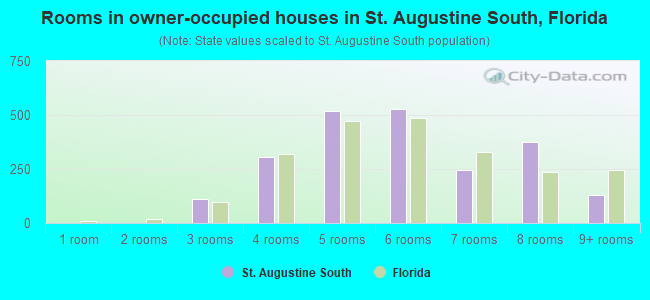
- Rooms in owner-occupied houses in St. Augustine South, Florida
- 01 room
- 02 rooms
- 1103 rooms
- 3064 rooms
- 5185 rooms
- 5266 rooms
- 2467 rooms
- 3778 rooms
- 1299+ rooms
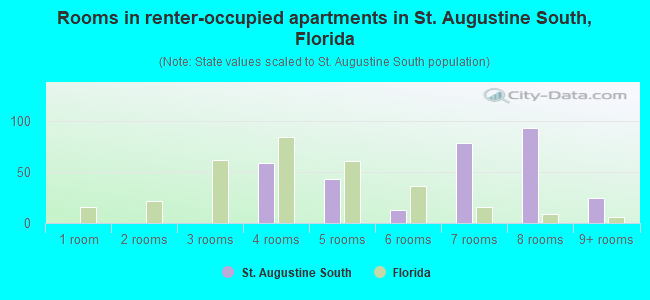
- Rooms in renter-occupied apartments in St. Augustine South, Florida
- 01 room
- 02 rooms
- 03 rooms
- 594 rooms
- 435 rooms
- 136 rooms
- 787 rooms
- 938 rooms
- 259+ rooms
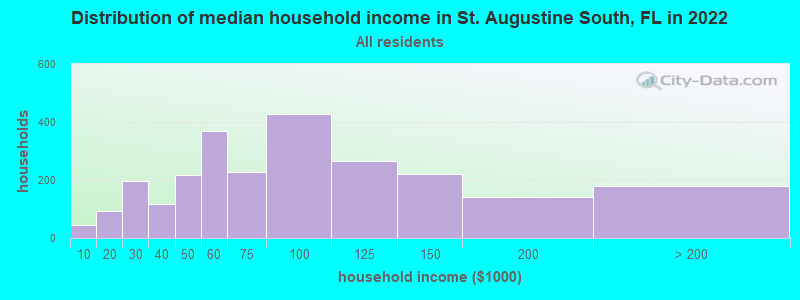
St. Augustine South, FL household income distribution

- 45Less than $10,000
- 93$10,000 to $19,999
- 196$20,000 to $29,999
- 116$30,000 to $39,999
- 218$40,000 to $49,999
- 370$50,000 to $59,999
- 226$60,000 to $74,999
- 427$75,000 to $99,999
- 267$100,000 to $124,999
- 222$125,000 to $149,999
- 142$150,000 to $199,999
- 179$200,000 or more
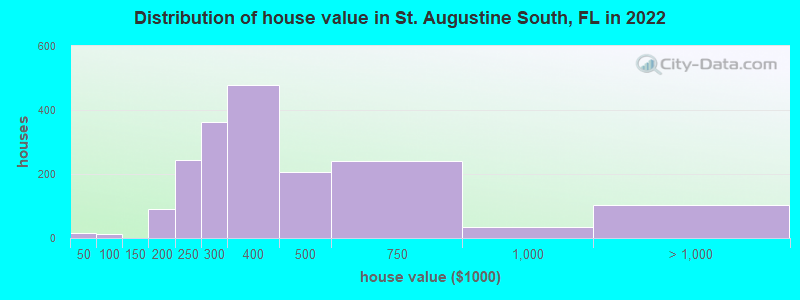
Home value of owner - occupied houses in 2022 in St. Augustine South, FL
-
- 17$30,000 to $34,999
- 12$60,000 to $69,999
- 21$150,000 to $174,999
- 69$175,000 to $199,999
- 243$200,000 to $249,999
- 362$250,000 to $299,999
- 476$300,000 to $399,999
- 205$400,000 to $499,999
- 239$500,000 to $749,999
- 33$750,000 to $999,999
- 101$1,000,000 to $1,499,999
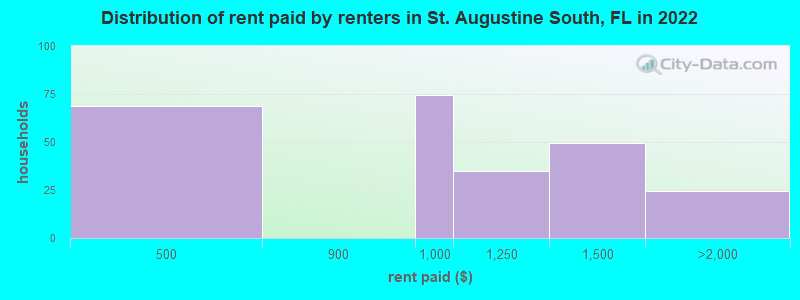
Rent paid by renters in 2022 in St. Augustine South, FL
-
- 60$400 to $449
- 8$450 to $499
- 74$900 to $999
- 35$1,000 to $1,249
- 49$1,250 to $1,499
- 24$1,500 to $1,999
Percentage of workers working in this county: 95.3%
Number of people working at home: 282 (10.0% of all workers)
Travel time to work (commute)
- Less than 5 minutes: 0
- 5 to 9 minutes: 612
- 10 to 14 minutes: 352
- 15 to 19 minutes: 548
- 20 to 24 minutes: 288
- 25 to 29 minutes: 124
- 30 to 34 minutes: 192
- 35 to 39 minutes: 83
- 40 to 44 minutes: 21
- 45 to 59 minutes: 123
- 60 to 89 minutes: 68
- 90 or more minutes: 41
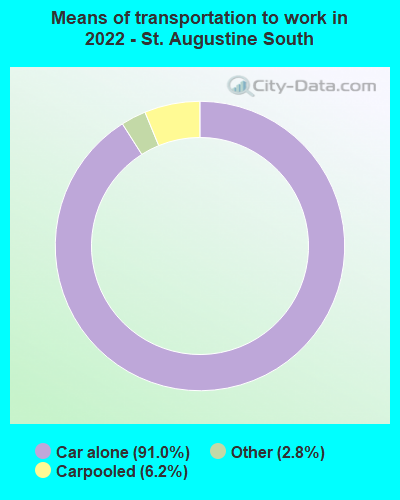
Means of transportation to work:
- Drove a car alone: 767 (79.0%)
- Carpooled: 54 (5.6%)
- Taxi: 28 (2.9%)
- Worked at home: 139 (14.3%)
- Unemployment by race in 2022
- Unemployment rate for White non-Hispanic residents
- 2.8%Females
- Unemployment rate for two or more race residents
- 25.1%Males
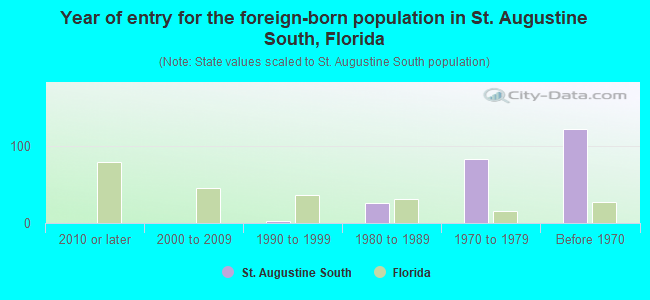
- Year of entry for the foreign-born population in St. Augustine South, Florida
- 02010 or later
- 02000 to 2009
- 31990 to 1999
- 261980 to 1989
- 831970 to 1979
- 122Before 1970
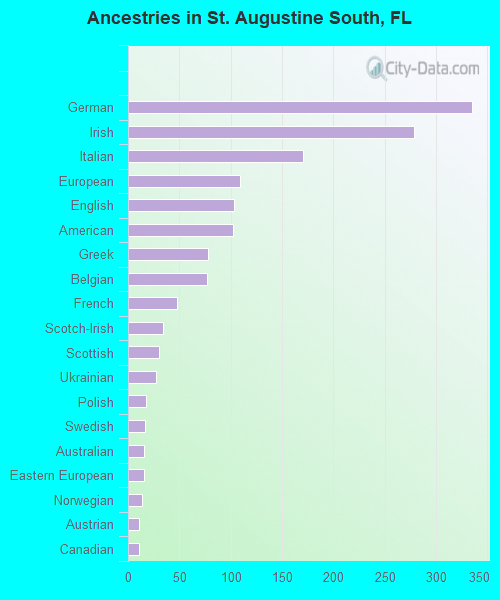
First ancestries reported:
- German: 335 (18.5%)
- Irish: 279 (15.4%)
- Italian: 171 (9.4%)
- European: 109 (6.0%)
- English: 103 (5.7%)
- American: 102 (5.6%)
- Greek: 78 (4.3%)
- Belgian: 77 (4.2%)
- French: 48 (2.6%)
- Scotch-Irish: 34 (1.9%)
- Scottish: 30 (1.7%)
- Ukrainian: 27 (1.5%)
- Polish: 18 (1.0%)
- Swedish: 17 (0.9%)
- Australian: 16 (0.9%)
- Eastern European: 16 (0.9%)
- Norwegian: 14 (0.8%)
- Austrian: 11 (0.6%)
- Canadian: 11 (0.6%)
Most common places of birth for foreign-born residents (%):
| St. Augustine South: | 30.1% (43) |
| Florida: | 0.1% (4,197) |
| St. Augustine South: | 15.4% (22) |
| Florida: | 2.4% (109,132) |
| St. Augustine South: | 13.3% (19) |
| Florida: | 0.2% (8,352) |
| St. Augustine South: | 13.3% (19) |
| Florida: | 0.2% (8,038) |
| St. Augustine South: | 10.5% (15) |
| Florida: | 0.4% (19,445) |
| St. Augustine South: | 8.4% (12) |
| Florida: | 0.1% (5,190) |
| St. Augustine South: | 2.8% (4) |
| Florida: | 0.2% (10,425) |
| St. Augustine South: | 2.1% (3) |
| Florida: | 6.5% (298,669) |
Place of birth for U.S.-born residents:
- This state: 2,313
- Other state: 2,762
- Northeast: 1,406
- Midwest: 569
- South: 752
- West: 59
91.3% of St. Augustine South residents lived in the same house 1 years ago.
Out of people who lived in different houses, 33.5% lived in this county.
Out of people who lived in different counties, 0.0% lived in Florida.
| St. Augustine South: | 91.3% |
| State average: | 86.3% |
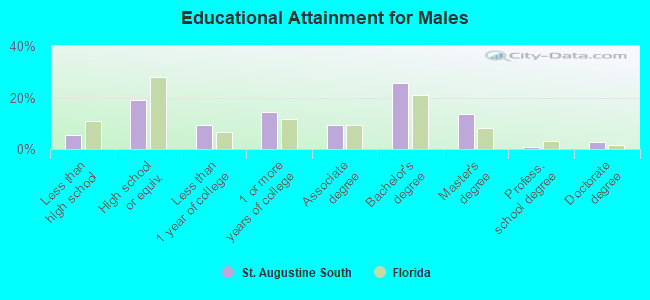
Education attainment for males 25 years and older:
- No schooling: 28
- Nursery to 4th grade: 0
- 5th and 6th grade: 31
- 7th and 8th grade: 0
- 9th grade: 0
- 10th grade: 28
- 11th grade: 22
- 12th grade, no diploma: 0
- High school graduate (or equivalency): 376
- Less than 1 year of college: 183
- Some college more than 1 year, no degree: 284
- Associate degree: 187
- Bachelor's degree: 504
- Master's degree: 269
- Professional school degree: 14
- Doctorate degree: 55
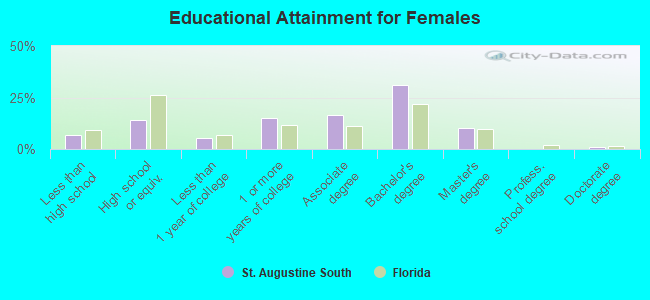
Education attainment for females 25 years and older:
- No schooling: 52
- Nursery to 4th grade: 44
- 5th and 6th grade: 0
- 7th and 8th grade: 0
- 9th grade: 15
- 10th grade: 0
- 11th grade: 0
- 12th grade, no diploma: 47
- High school graduate (or equivalency): 321
- Less than 1 year of college: 123
- Some college more than 1 year, no degree: 343
- Associate degree: 369
- Bachelor's degree: 698
- Master's degree: 226
- Professional school degree: 0
- Doctorate degree: 21


Housing units in structures:
- One, detached: 2,568
- 3 or 4: 40
- 50 or more: 15
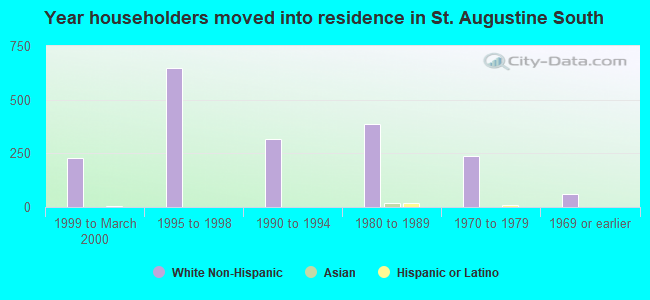
House/condo owner moved in on average 16 years ago
Renter moved in on average 7 years ago
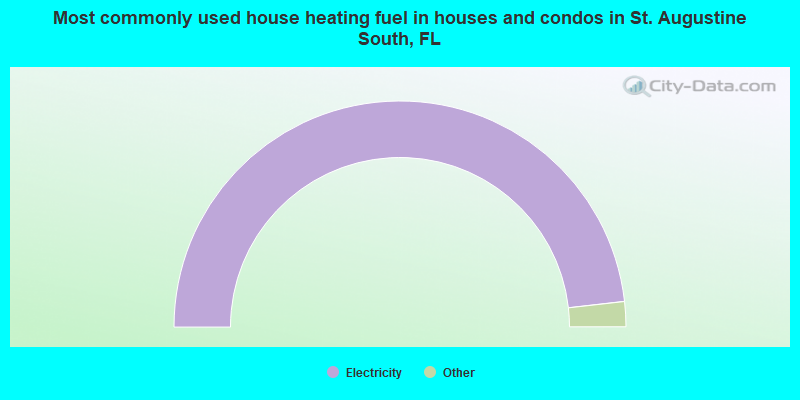
- 96.5%Electricity
- 2.9%Solar energy
- 0.6%Bottled, tank, or LP gas
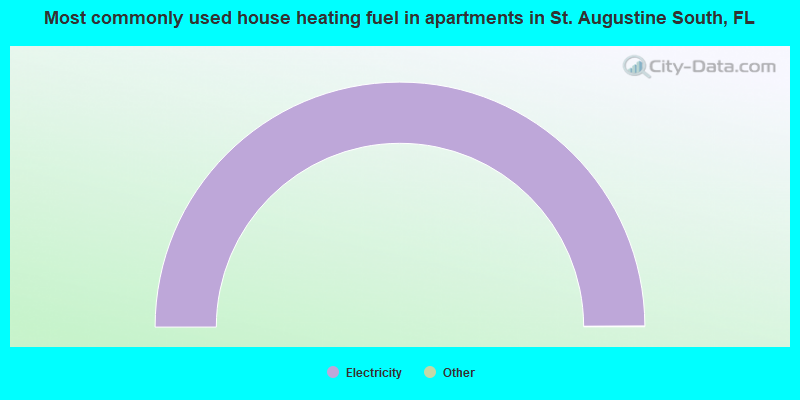
- 100.0%Electricity
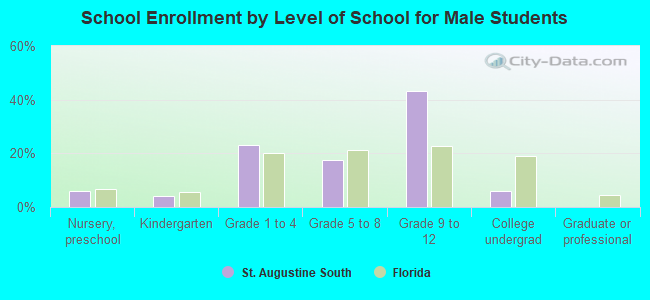
Private vs. public school enrollment:
| Here: | 9.0% |
| Florida: | 15.8% |
| Here: | 0.0% |
| Florida: | 12.9% |
| Here: | 58.7% |
| Florida: | 23.6% |