Housing density: 1,543 houses/condos per square mile
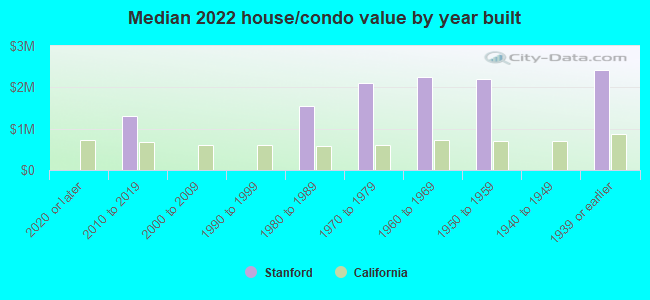
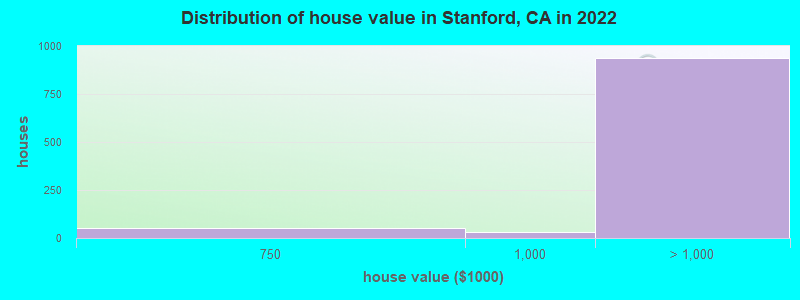
Median price asked for vacant for-sale houses and condos in 2022 in this county: $2,273,258.
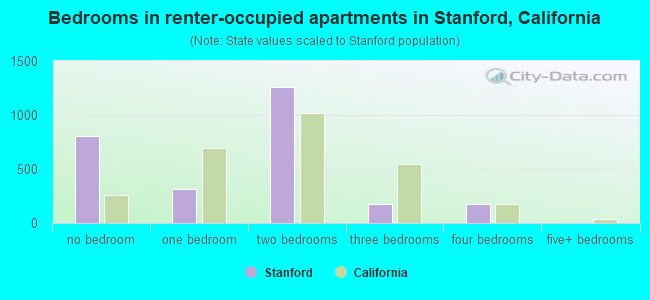
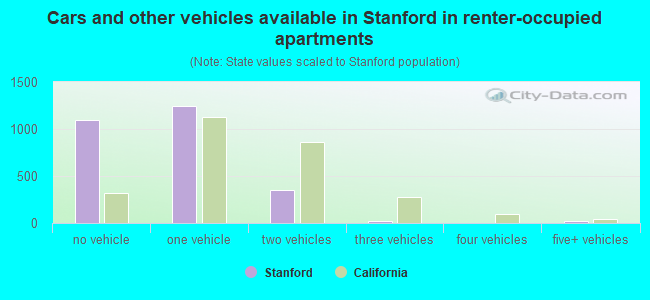
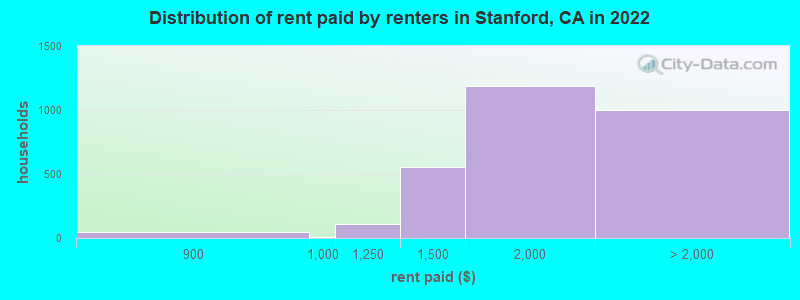
Median contract rent in 2022: $1,753 (lower quartile is $1,415, upper quartile is over $2,000)
Median rent asked for vacant for-rent units in 2022: $2,321
Median gross rent in Stanford, CA in 2022: $1,749
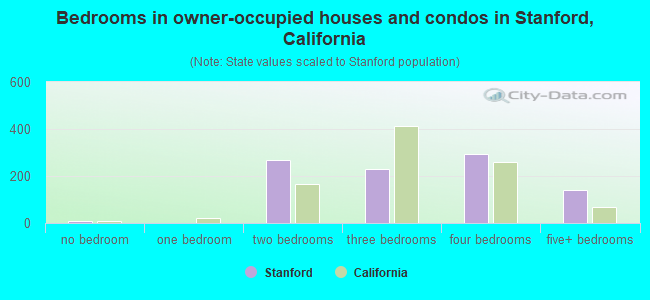
Housing units in Stanford with a mortgage: 413 (99 second mortgage, 4 home equity loan, 27 both second mortgage and home equity loan) Houses without a mortgage: 0
Median household income for houses/condos with a mortgage: $253,538
Median household income for apartments without a mortgage: $263,438
695 married couples with children.
152 single-parent households (92 men, 60 women).
58.8% of residents of Stanford speak English at home.
10.9% of residents speak Spanish at home (87% speak English very well, 12% speak English well, 2% speak English not well).
9.0% of residents speak other Indo-European language at home (87% speak English very well, 12% speak English well, 1% speak English not well).
18.3% of residents speak Asian or Pacific Island language at home (78% speak English very well, 16% speak English well, 3% speak English not well, 3% don't speak English at all).
1.6% of residents speak other language at home (89% speak English very well, 11% don't speak English at all).
Foreign born population: 4,927 (29.3%)
(26.6% of them are naturalized citizens)
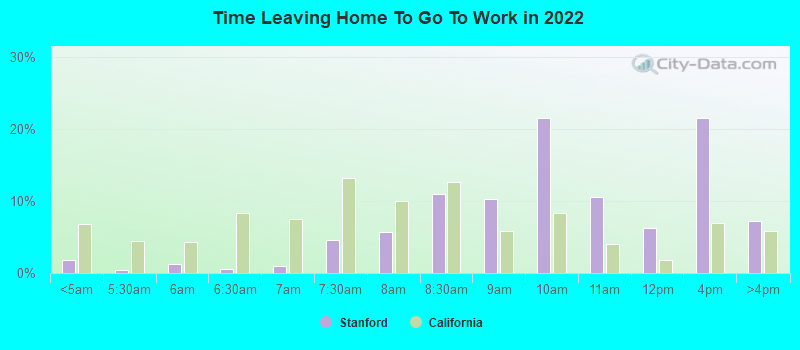
Percentage of workers working in this county: 94.9% Number of people working at home: 1,985 (27.0% of all workers)
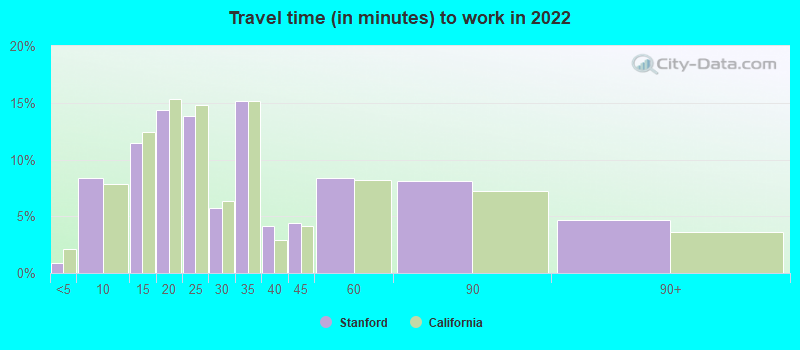
Travel time to work (commute)
Less than 5 minutes: 173
5 to 9 minutes: 1,583
10 to 14 minutes: 1,539
15 to 19 minutes: 1,262
20 to 24 minutes: 479
25 to 29 minutes: 196
30 to 34 minutes: 246
35 to 39 minutes: 176
40 to 44 minutes: 20
45 to 59 minutes: 57
60 to 89 minutes: 119
90 or more minutes: 11
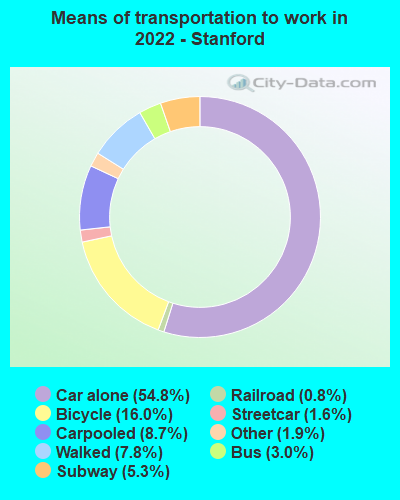
Means of transportation to work:
Drove a car alone: 12,203 (48.5%)
Carpooled: 1,989 (7.9%)
Bus: 477 (1.9%)
Subway or elevated rail: 217 (0.9%)
Long-distance train or commuter rail: 938 (3.7%)
Light rail, streetcar or trolley: 135 (0.5%)
Taxi: 466 (1.9%)
Bicycle: 4,003 (15.9%)
Walked: 1,766 (7.0%)
Worked at home: 1,985 (7.9%)
Unemployment by race in 2022
Unemployment rate for White non-Hispanic residents
1.7%Males
6.2%Females
Unemployment rate for Black residents
12.6%Males
2.1%Females
Unemployment rate for Asian residents
5.4%Males
6.0%Females
Unemployment rate for other race residents
2.9%Males
1.3%Females
Unemployment rate for two or more race residents
18.3%Males
2.9%Females
Unemployment rate for Hispanic or Latino residents
13.4%Males
2.1%Females
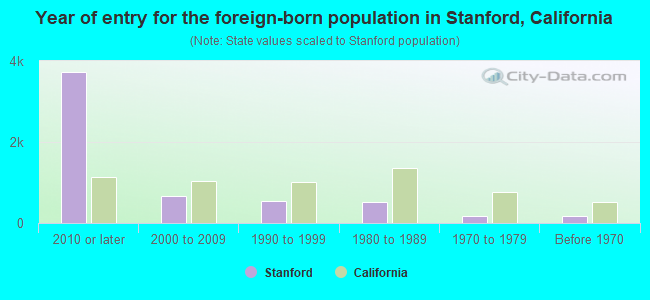
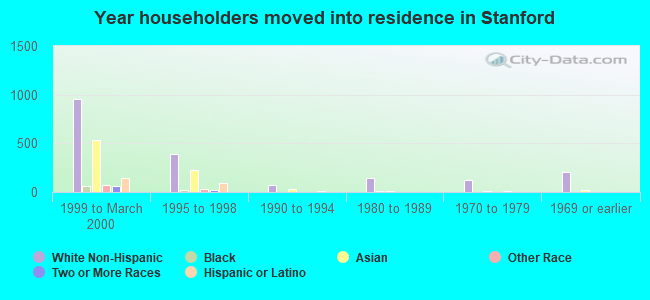
Year of entry for the foreign-born population in Stanford, California
3,7312010 or later
6602000 to 2009
5491990 to 1999
5291980 to 1989
1721970 to 1979
177Before 1970
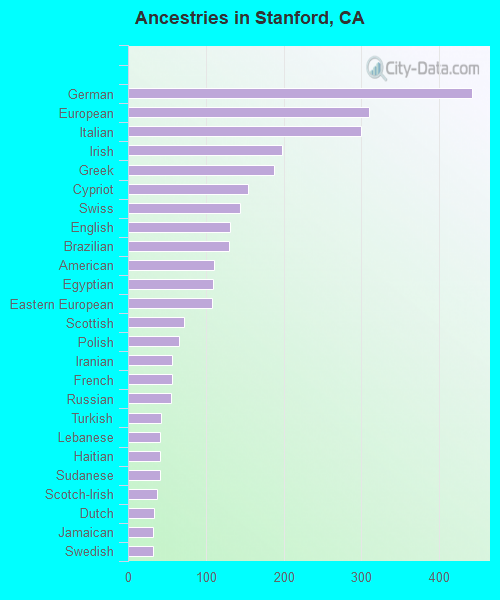
First ancestries reported:
German: 442 (4.7%)
European: 310 (3.3%)
Italian: 300 (3.2%)
Irish: 198 (2.1%)
Greek: 188 (2.0%)
Cypriot: 154 (1.6%)
Swiss: 144 (1.5%)
English: 131 (1.4%)
Brazilian: 130 (1.4%)
American: 110 (1.2%)
Egyptian: 109 (1.2%)
Eastern European: 108 (1.1%)
Scottish: 72 (0.8%)
Polish: 65 (0.7%)
Iranian: 57 (0.6%)
French: 56 (0.6%)
Russian: 55 (0.6%)
Turkish: 42 (0.4%)
Lebanese: 41 (0.4%)
Haitian: 41 (0.4%)
Sudanese: 41 (0.4%)
Scotch-Irish: 37 (0.4%)
Dutch: 34 (0.4%)
Jamaican: 32 (0.3%)
Swedish: 32 (0.3%)
Portuguese: 29 (0.3%)
Armenian: 28 (0.3%)
French Canadian: 22 (0.2%)
Albanian: 22 (0.2%)
Norwegian: 21 (0.2%)
African: 21 (0.2%)
Palestinian: 21 (0.2%)
Austrian: 15 (0.2%)
Bahamian: 15 (0.2%)
Guyanese: 14 (0.1%)
Croatian: 14 (0.1%)
Danish: 10 (0.1%)
Moroccan: 9 (0.10%)
Trinidadian and Tobagonian: 9 (0.10%)
Romanian: 8 (0.08%)
South African: 8 (0.08%)
Belgian: 8 (0.08%)
Ethiopian: 6 (0.06%)
Israeli: 5 (0.05%)
Czech: 5 (0.05%)
British: 5 (0.05%)
Barbadian: 5 (0.05%)
Finnish: 4 (0.04%)
Nigerian: 4 (0.04%)
Ukrainian: 4 (0.04%)
Yugoslavian: 3 (0.03%)
Estonian: 2 (0.02%)
Ugandan: 1 (0.01%)
Most common places of birth for foreign-born residents (%):
China, excluding Hong Kong and Taiwan
Stanford:
17.8% (879)
California:
6.6% (684,672)
Korea
Stanford:
9.4% (461)
California:
3.0% (315,248)
India
Stanford:
7.6% (373)
California:
5.2% (539,184)
Germany
Stanford:
6.5% (321)
California:
0.7% (73,304)
Philippines
Stanford:
5.7% (281)
California:
7.8% (818,297)
Canada
Stanford:
5.2% (255)
California:
1.2% (127,477)
France
Stanford:
3.2% (157)
California:
0.4% (40,224)
Taiwan
Stanford:
2.9% (142)
California:
1.7% (176,274)
Cambodia
Stanford:
2.7% (132)
California:
0.5% (51,974)
Hong Kong
Stanford:
2.7% (131)
California:
1.0% (105,215)
Mexico
Stanford:
2.6% (128)
California:
37.2% (3,881,193)
England
Stanford:
2.6% (127)
California:
0.6% (57,953)
Italy
Stanford:
2.4% (116)
California:
0.3% (31,439)
Lebanon
Stanford:
2.2% (109)
California:
0.3% (31,757)
Turkey
Stanford:
1.9% (94)
California:
0.2% (20,474)
Switzerland
Stanford:
1.9% (92)
California:
0.1% (9,159)
Spain
Stanford:
1.8% (88)
California:
0.2% (16,586)
Place of birth for U.S.-born residents:
This state: 6,208
Other state: 5,057
Northeast: 1,772
Midwest: 1,240
South: 1,076
West: 998
52.9% of Stanford residents lived in the same house 1 years ago. Out of people who lived in different houses, 23.7% lived in this county. Out of people who lived in different counties, 54.7% lived in California.
Stanford:
52.9%
State average:
88.9%
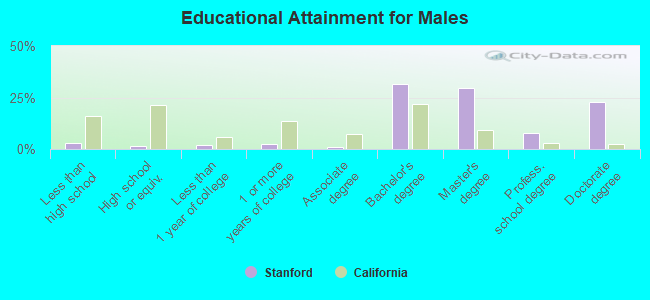
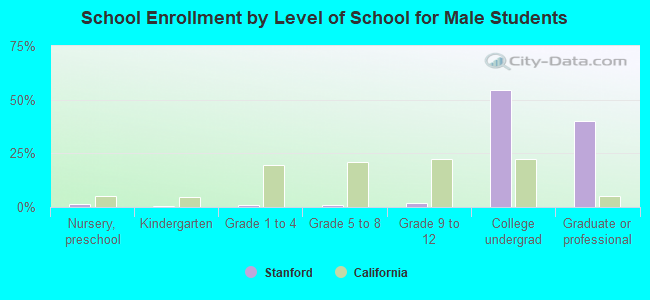
Education attainment for males 25 years and older:
No schooling: 49
Nursery to 4th grade: 0
5th and 6th grade: 0
7th and 8th grade: 0
9th grade: 0
10th grade: 46
11th grade: 0
12th grade, no diploma: 0
High school graduate (or equivalency): 44
Less than 1 year of college: 62
Some college more than 1 year, no degree: 78
Associate degree: 26
Bachelor's degree: 1,104
Master's degree: 1,042
Professional school degree: 267
Doctorate degree: 794
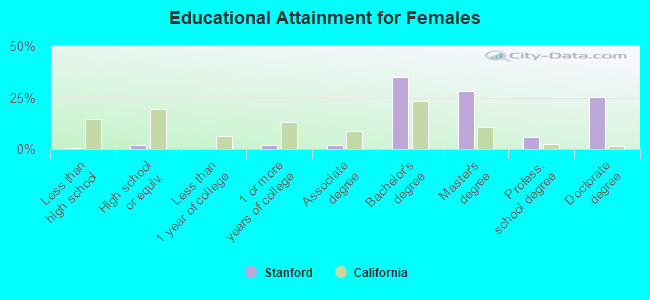
Education attainment for females 25 years and older: