Sugar Land, TX (Texas) Houses and Residents
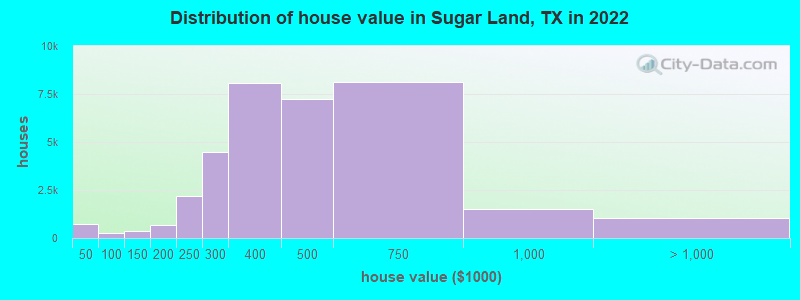
Estimated median house or condo value in 2022: $397,700 (it was $158,300 in 2000 )
Sugar Land:
$397,700Texas:
$275,400
Lower value quartile - upper value quartile: $292,600 - $532,900Mean price in 2022: Detached houses: $488,934 Here:
$488,934State:
$369,058
Townhouses or other attached units: $405,366 Here:
$405,366State:
$327,631
In 3-to-4-unit structures: $232,004 Here:
$232,004State:
$209,652
In 5-or-more-unit structures: $137,419 Here:
$137,419State:
$413,944
Mobile homes: $188,055 Here:
$188,055State:
$124,413
Total population: 86,777 (Urban population: 63,507, Rural population: 0)
Houses: 40,610 (39,319 occupied: 32,557 owner occupied, 6,762 renter occupied )
% of renters here:
17%State:
38%
Housing density: 1,686 houses/condos per square mile
Median price asked for vacant for-sale houses and condos in 2022: $300,699.
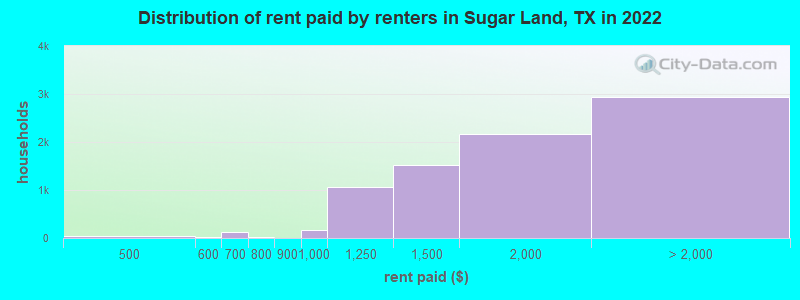
Median contract rent in 2022: $1,664 (lower quartile is $1,329, upper quartile is $1,935)
Median rent asked for vacant for-rent units in 2022: $2,738
Median gross rent in Sugar Land, TX in 2022: $1,788
Housing units in Sugar Land with a mortgage: 18,718 (1,268 second mortgage, 0 home equity loan, 801 both second mortgage and home equity loan )Houses without a mortgage: 169
Median household income for houses/condos with a mortgage: $157,651
Median household income for apartments without a mortgage: $127,998
Median monthly housing costs: $1,803
Data:
Median house or condo value ($)
Median house or condo value ($ change since 2000)
Median house or condo value ($) - White
Median house or condo value ($) - Black or African American
Median house or condo value ($) - Asian
Median house or condo value ($) - Hispanic or Latino
Median house or condo value ($) - American Indian and Alaska Native
Median house or condo value ($) - Multirace
Median house or condo value ($) - Other Race
Median price asked for mobile homes ($)
Household density (households per square mile)
Mean house or condo value by units in structure - 1, detached ($)
Mean house or condo value by units in structure - 1, attached ($)
Mean house or condo value by units in structure - 2 ($)
Mean house or condo value by units in structure by units in structure - 3 or 4 ($)
Mean house or condo value by units in structure - 5 or more ($)
Mean house or condo value by units in structure - Boat, RV, van, etc. ($)
Mean house or condo value by units in structure - Mobile home ($)
Median contract rent ($)
Median contract rent - Lower quartile ($)
Median contract rent - Upper quartile ($)
Median gross rent ($)
Urban houses (%)
Rural houses (%)
Houses occupied (%)
Houses occupied (% change since 2000)
Houses owner occupied (%)
Houses owner occupied (% change since 2000)
Houses renter occupied (%)
Houses renter occupied (% change since 2000)
Vacant housing units - For rent (%)
Vacant housing units - For rent (% change since 2000)
Vacant housing units - For sale only (%)
Vacant housing units - For sale only (% change since 2000)
Vacant housing units - Rented or sold, not occupied (%)
Vacant housing units - Rented or sold, not occupied (% change since 2000)
Vacant housing units - For seasonal, recreational, or occasional use (%)
Vacant housing units - For seasonal, recreational, or occasional use (% change since 2000)
Vacant housing units - For migrant workers (%)
Vacant housing units - For migrant workers (% change since 2000)
Vacant housing units - Other vacant (%)
Vacant housing units - Other vacant (% change since 2000)
Median monthly housing costs ($)
Median household income for houses/condos with a mortgage ($)
Median household income for houses/condos without a mortgage ($)
Median household income ($)
Median household income ($) - White
Median household income ($) - Black or African American
Median household income ($) - Asian
Median household income ($) - Hispanic or Latino
Median household income ($) - American Indian and Alaska Native
Median household income ($) - Multirace
Median household income ($) - Other Race
Mortgage status - with mortgage (%)
Mortgage status - with second mortgage (%)
Mortgage status - with home equity loan (%)
Mortgage status - with both second mortgage and home equity loan (%)
Mortgage status - without a mortgage (%)
Median year house/condo built
Median year apartment built
Household type by relationship - Male householder living alone (%)
Household type by relationship - Male householder not living alone (%)
Household type by relationship - Female householder living alone (%)
Household type by relationship - Female householder not living alone (%)
Household type by relationship - Opposite-Sex spouse (%)
Household type by relationship - Same-Sex spouse (%)
Household type by relationship - Opposite-Sex unmarried partner (%)
Household type by relationship - Same-Sex unmarried partner (%)
Household type by relationship - In group quarters (%)
Size of family households - 2-person household (%)
Size of family households - 3-person household (%)
Size of family households - 4-person household (%)
Size of family households - 5-person household (%)
Size of family households - 6-person household (%)
Size of family households - 7-or-more-person household (%)
Size of nonfamily households - 1-person household (%)
Size of nonfamily households - 2-person household (%)
Size of nonfamily households - 3-person household (%)
Size of nonfamily households - 4-person household (%)
Size of nonfamily households - 5-person household (%)
Size of nonfamily households - 6-person household (%)
Size of nonfamily households - 7-or-moreperson household (%)
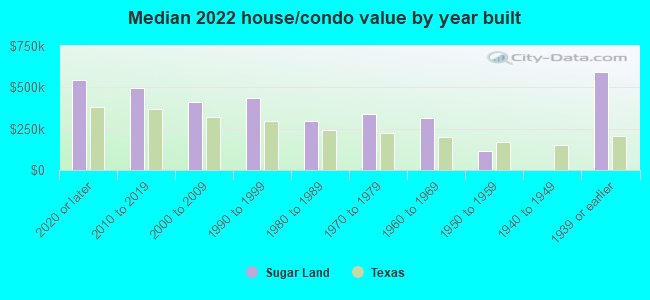
Year house built - Built 2010 or later (%)
Year house built - Built 2000 to 2009 (%)
Year house built - Built 1990 to 1999 (%)
Year house built - Built 1980 to 1989 (%)
Year house built - Built 1970 to 1979 (%)
Year house built - Built 1960 to 1969 (%)
Year house built - Built 1950 to 1959 (%)
Year house built - Built 1940 to 1949 (%)
Year house built - Built 1939 or earlier (%)
Median number of rooms in houses and condos
Median number of rooms in apartments
Median number of bedrooms in owner occupied houses
Mean number of bedrooms in owner occupied houses
Median number of bedrooms in renter occupied houses
Mean number of bedrooms in renter occupied houses
Median number of vehichles in owner occupied houses
Mean number of vehichles in owner occupied houses
Median number of vehichles in renter occupied houses
Mean number of vehichles in renter occupied houses
Rooms in owner-occupied houses - 1 room (%)
Rooms in owner-occupied houses - 2 rooms (%)
Rooms in owner-occupied houses - 3 rooms (%)
Rooms in owner-occupied houses - 4 rooms (%)
Rooms in owner-occupied houses - 5 rooms (%)
Rooms in owner-occupied houses - 6 rooms (%)
Rooms in owner-occupied houses - 7 rooms (%)
Rooms in owner-occupied houses - 8 rooms (%)
Rooms in owner-occupied houses - 9+ rooms (%)
Rooms in renter-occupied houses - 1 room (%)
Rooms in renter-occupied houses - 2 rooms (%)
Rooms in renter-occupied houses - 3 rooms (%)
Rooms in renter-occupied houses - 4 rooms (%)
Rooms in renter-occupied houses - 5 rooms (%)
Rooms in renter-occupied houses - 6 rooms (%)
Rooms in renter-occupied houses - 7 rooms (%)
Rooms in renter-occupied houses - 8 rooms (%)
Rooms in renter-occupied houses - 9+ rooms (%)
Bedrooms in owner-occupied houses - no bedrooms (%)
Bedrooms in owner-occupied houses - 1 bedroom (%)
Bedrooms in owner-occupied houses - 2 bedrooms (%)
Bedrooms in owner-occupied houses - 3 bedrooms (%)
Bedrooms in owner-occupied houses - 4 bedrooms (%)
Bedrooms in owner-occupied houses - 5+ bedrooms (%)
Bedrooms in renter-occupied houses - no bedrooms (%)
Bedrooms in renter-occupied houses - 1 bedroom (%)
Bedrooms in renter-occupied houses - 2 bedrooms (%)
Bedrooms in renter-occupied houses - 3 bedrooms (%)
Bedrooms in renter-occupied houses - 4 bedrooms (%)
Bedrooms in renter-occupied houses - 5+ bedrooms (%)
Vehicles available in owner-occupied houses - no vehicle available (%)
Vehicles available in owner-occupied houses - 1 vehicle available(%)
Vehicles available in owner-occupied houses - 2 Vehicles available (%)
Vehicles available in owner-occupied houses - 3 Vehicles available (%)
Vehicles available in owner-occupied houses - 4 Vehicles available (%)
Vehicles available in owner-occupied houses - 5+ Vehicles available (%)
Vehicles available in renter-occupied houses - no vehicle available (%)
Vehicles available in renter-occupied houses - 1 vehicle available (%)
Vehicles available in renter-occupied houses - 2 Vehicles available (%)
Vehicles available in renter-occupied houses - 3 Vehicles available (%)
Vehicles available in renter-occupied houses - 4 Vehicles available (%)
Vehicles available in renter-occupied houses - 5+ Vehicles available (%)
Housing units in structures - 1, detached (%)
Housing units in structures - 1, attached (%)
Housing units in structures - 2 (%)
Housing units in structures - 3 or 4 (%)
Housing units in structures - 5 to 9 (%)
Housing units in structures - 10 to 19 (%)
Housing units in structures - 20 to 49 (%)
Housing units in structures - 50 or more (%)
Housing units in structures - Mobile home (%)
Housing units in structures - Boat, RV, van, etc. (%)
Housing units in structures - Owners - 1, detached (%)
Housing units in structures - Owners - 1, attached (%)
Housing units in structures - Owners - 2 (%)
Housing units in structures - Owners - 3 or 4 (%)
Housing units in structures - Owners - 5 to 9 (%)
Housing units in structures - Owners - 10 to 19 (%)
Housing units in structures - Owners - 20 to 49 (%)
Housing units in structures - Owners - 50 or more (%)
Housing units in structures - Owners - Mobile home (%)
Housing units in structures - Owners - Boat, RV, van, etc. (%)
Housing units in structures - Renters - 1, detached (%)
Housing units in structures - Renters - 1, attached (%)
Housing units in structures - Renters - 2 (%)
Housing units in structures - Renters - 3 or 4 (%)
Housing units in structures - Renters - 5 to 9 (%)
Housing units in structures - Renters - 10 to 19 (%)
Housing units in structures - Renters - 20 to 49 (%)
Housing units in structures - Renters - 50 or more (%)
Housing units in structures - Renters - Mobile home (%)
Housing units in structures - Renters - Boat, RV, van, etc. (%)
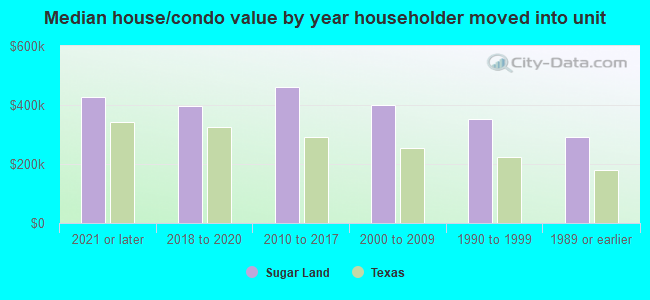
House/condo owner moved in on average (years ago)
Renter moved in on average (years ago)
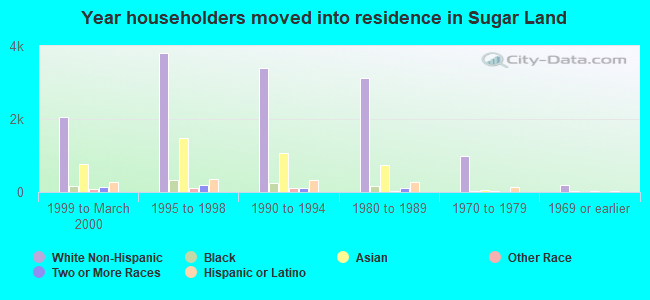
Year householder moved into unit - Moved in 1999 to March 2000 (%)
Year householder moved into unit - Moved in 1999 to March 2000 (%) - White
Year householder moved into unit - Moved in 1999 to March 2000 (%) - Black or African American
Year householder moved into unit - Moved in 1999 to March 2000 (%) - Asian
Year householder moved into unit - Moved in 1999 to March 2000 (%) - Hispanic or Latino
Year householder moved into unit - Moved in 1999 to March 2000 (%) - American Indian and Alaska Native
Year householder moved into unit - Moved in 1999 to March 2000 (%) - Multirace
Year householder moved into unit - Moved in 1999 to March 2000 (%) - Other Race
Year householder moved into unit - Moved in 1995 to 1998 (%)
Year householder moved into unit - Moved in 1995 to 1998 (%) - White
Year householder moved into unit - Moved in 1995 to 1998 (%) - Black or African American
Year householder moved into unit - Moved in 1995 to 1998 (%) - Asian
Year householder moved into unit - Moved in 1995 to 1998 (%) - Hispanic or Latino
Year householder moved into unit - Moved in 1995 to 1998 (%) - American Indian and Alaska Native
Year householder moved into unit - Moved in 1995 to 1998 (%) - Multirace
Year householder moved into unit - Moved in 1995 to 1998 (%) - Other Race
Year householder moved into unit - Moved in 1990 to 1994 (%)
Year householder moved into unit - Moved in 1990 to 1994 (%) - White
Year householder moved into unit - Moved in 1990 to 1994 (%) - Black or African American
Year householder moved into unit - Moved in 1990 to 1994 (%) - Asian
Year householder moved into unit - Moved in 1990 to 1994 (%) - Hispanic or Latino
Year householder moved into unit - Moved in 1990 to 1994 (%) - American Indian and Alaska Native
Year householder moved into unit - Moved in 1990 to 1994 (%) - Multirace
Year householder moved into unit - Moved in 1990 to 1994 (%) - Other Race
Year householder moved into unit - Moved in 1980 to 1989 (%)
Year householder moved into unit - Moved in 1980 to 1989 (%) - White
Year householder moved into unit - Moved in 1980 to 1989 (%) - Black or African American
Year householder moved into unit - Moved in 1980 to 1989 (%) - Asian
Year householder moved into unit - Moved in 1980 to 1989 (%) - Hispanic or Latino
Year householder moved into unit - Moved in 1980 to 1989 (%) - American Indian and Alaska Native
Year householder moved into unit - Moved in 1980 to 1989 (%) - Multirace
Year householder moved into unit - Moved in 1980 to 1989 (%) - Other Race
Year householder moved into unit - Moved in 1970 to 1979 (%)
Year householder moved into unit - Moved in 1970 to 1979 (%) - White
Year householder moved into unit - Moved in 1970 to 1979 (%) - Black or African American
Year householder moved into unit - Moved in 1970 to 1979 (%) - Asian
Year householder moved into unit - Moved in 1970 to 1979 (%) - Hispanic or Latino
Year householder moved into unit - Moved in 1970 to 1979 (%) - American Indian and Alaska Native
Year householder moved into unit - Moved in 1970 to 1979 (%) - Multirace
Year householder moved into unit - Moved in 1970 to 1979 (%) - Other Race
Year householder moved into unit - Moved in 1969 or earlier (%)
Year householder moved into unit - Moved in 1969 or earlier (%) - White
Year householder moved into unit - Moved in 1969 or earlier (%) - Black or African American
Year householder moved into unit - Moved in 1969 or earlier (%) - Asian
Year householder moved into unit - Moved in 1969 or earlier (%) - Hispanic or Latino
Year householder moved into unit - Moved in 1969 or earlier (%) - American Indian and Alaska Native
Year householder moved into unit - Moved in 1969 or earlier (%) - Multirace
Year householder moved into unit - Moved in 1969 or earlier (%) - Other Race
Housing units lacking complete plumbing facilities (%)
Housing units lacking complete kitchen facilities (%)
House heating fuel used in houses and condos - Utility gas (%)
House heating fuel used in houses and condos - Bottled, tank, or LP gas (%)
House heating fuel used in houses and condos - Electricity (%)
House heating fuel used in houses and condos - Fuel oil, kerosene, etc. (%)
House heating fuel used in houses and condos - Coal or coke (%)
House heating fuel used in houses and condos - Wood (%)
House heating fuel used in houses and condos - Solar energy (%)
House heating fuel used in houses and condos - Other fuel (%)
House heating fuel used in houses and condos - No fuel used (%)
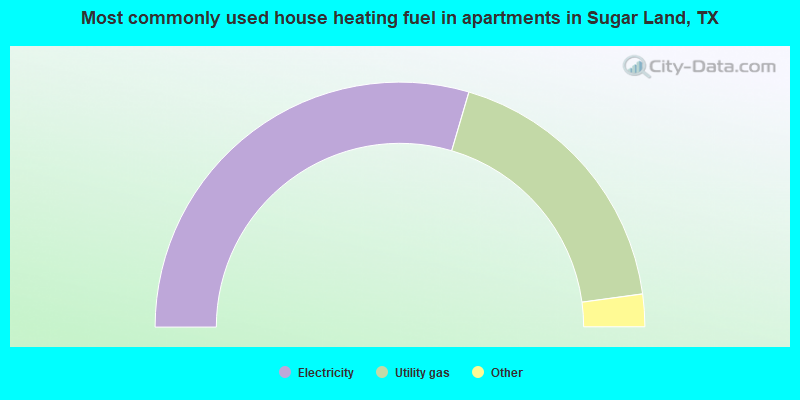
House heating fuel used in apartments - Utility gas (%)
House heating fuel used in apartments - Bottled, tank, or LP gas (%)
House heating fuel used in apartments - Electricity (%)
House heating fuel used in apartments - Fuel oil, kerosene, etc. (%)
House heating fuel used in apartments - Coal or coke (%)
House heating fuel used in apartments - Wood (%)
House heating fuel used in apartments - Solar energy (%)
House heating fuel used in apartments - Other fuel (%)
House heating fuel used in apartments - No fuel used (%)
Median year house/condo built: 1993Median year apartment built: 1993Household type by relationship:
Households: 109,395
Male householders: 22,742 (2,639 living alone ), Female householders: 16,577 (4,113 living alone )27,799 spouses (27,740 opposite-sex spouses ), 755 unmarried partners , (508 opposite-sex unmarried partners ), 34,962 children (33,158 natural , 1,484 adopted , 320 stepchildren ), 1,905 grandchildren , 348 brothers or sisters , 1,483 parents , 83 foster children , 1,270 other relatives , 1,315 non-relatives In group quarters: 156
Size of family households: 12,508 2-persons , 7,067 3-persons , 7,405 4-persons , 3,138 5-persons , 590 6-persons , 360 7-or-more-persons .
Size of nonfamily households: 6,752 1-person , 1,239 2-persons , 208 3-persons , 52 4-persons .
20,968 married couples with children. single-parent households (630 men , 1,756 women ).
57.8% of residents of Sugar Land speak English at home. of residents speak Spanish at home (82% speak English very well , 13% speak English well , 3% speak English not well , 2% don't speak English at all ).of residents speak other Indo-European language at home (75% speak English very well , 18% speak English well , 6% speak English not well , 1% don't speak English at all ).of residents speak Asian or Pacific Island language at home (56% speak English very well , 30% speak English well , 9% speak English not well , 5% don't speak English at all ).of residents speak other language at home (76% speak English very well , 14% speak English well , 9% speak English not well , 1% don't speak English at all ).
Foreign born population: 36,805 (33.6%)of them are naturalized citizens )
Median number of rooms in houses and condos:
Median number of rooms in apartments
Owner-occupied Renter-occupied
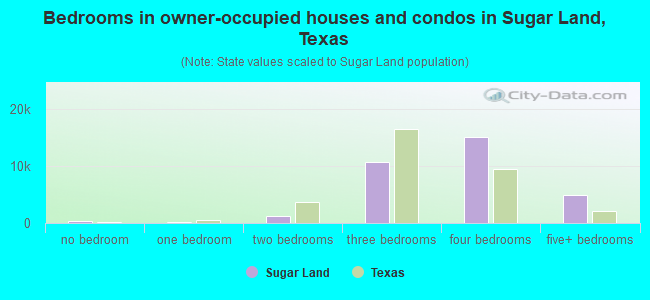
Bedrooms in owner-occupied houses and condos in Sugar Land, Texas
296 no bedroom 156 1 bedroom 1,285 2 bedrooms 10,719 3 bedrooms 15,118 4 bedrooms 4,983 5+ bedrooms
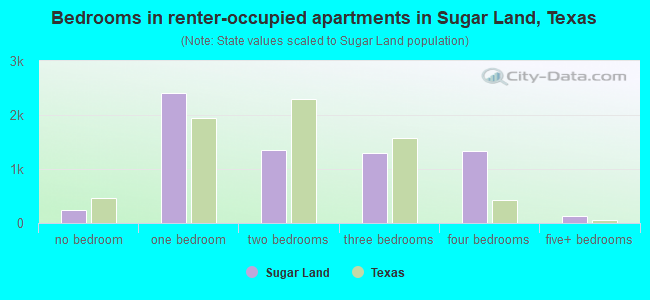
Bedrooms in renter-occupied apartments in Sugar Land, Texas
242 no bedroom 2,413 1 bedroom 1,354 2 bedrooms 1,293 3 bedrooms 1,336 4 bedrooms 124 5+ bedrooms
Owner-occupied Renter-occupied
Rooms in owner-occupied houses in Sugar Land, Texas
296 1 room 132 2 rooms 138 3 rooms 1,577 4 rooms 3,885 5 rooms 4,675 6 rooms 3,781 7 rooms 7,864 8 rooms 10,209 9+ rooms
Rooms in renter-occupied apartments in Sugar Land, Texas
242 1 room 1,273 2 rooms 1,214 3 rooms 805 4 rooms 1,182 5 rooms 754 6 rooms 386 7 rooms 546 8 rooms 360 9+ rooms
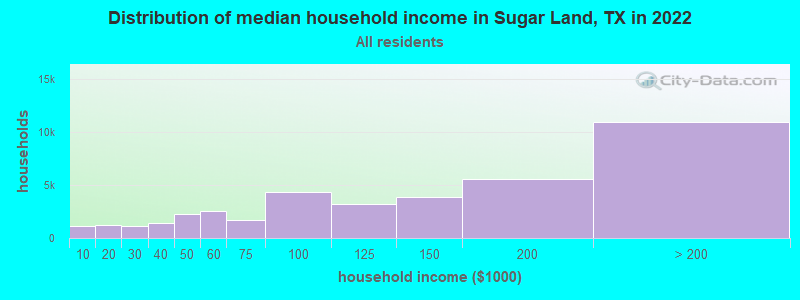
Sugar Land, TX household income distribution 1,116 Less than $10,0001,183 $10,000 to $19,9991,103 $20,000 to $29,9991,399 $30,000 to $39,9992,270 $40,000 to $49,9992,586 $50,000 to $59,9991,741 $60,000 to $74,9994,357 $75,000 to $99,9993,235 $100,000 to $124,9993,880 $125,000 to $149,9995,522 $150,000 to $199,99910,927 $200,000 or more
Home value of owner - occupied houses in 2022 in Sugar Land, TX 469 Less than $10,00055 $25,000 to $29,99944 $30,000 to $34,99928 $35,000 to $39,999106 $40,000 to $49,99929 $50,000 to $59,99917 $60,000 to $69,9995 $70,000 to $79,99985 $80,000 to $89,99912 $90,000 to $99,999253 $100,000 to $124,999120 $125,000 to $149,999379 $150,000 to $174,999292 $175,000 to $199,9992,205 $200,000 to $249,9994,497 $250,000 to $299,9998,065 $300,000 to $399,9997,253 $400,000 to $499,9998,133 $500,000 to $749,9991,485 $750,000 to $999,999787 $1,000,000 to $1,499,999100 $1,500,000 to $1,999,999129 $2,000,000 or moreRent paid by renters in 2022 in Sugar Land, TX 23 Less than $1007 $200 to $2497 $250 to $29914 $400 to $44933 $450 to $49918 $550 to $599124 $600 to $64919 $750 to $799161 $900 to $9991,060 $1,000 to $1,2491,530 $1,250 to $1,4992,165 $1,500 to $1,9991,365 $2,000 to $2,499638 $2,500 to $2,999398 $3,000 to $3,499178 $3,500 or more365 No cash rent
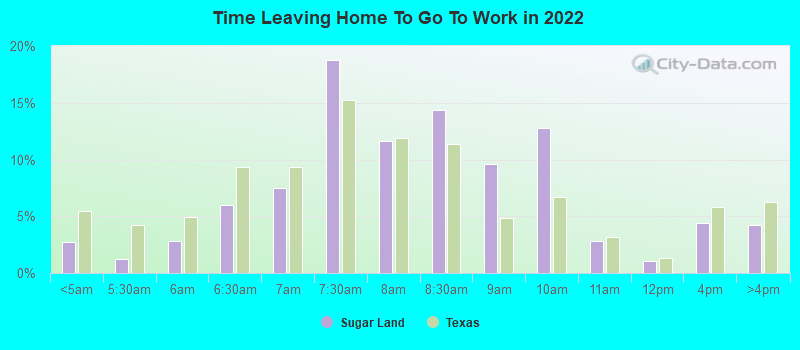
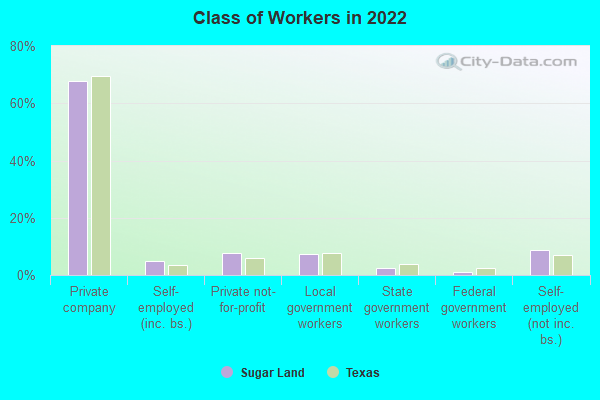
Percentage of workers working in this county: 55.7%Number of people working at home: 11,256 (19.1% of all workers )
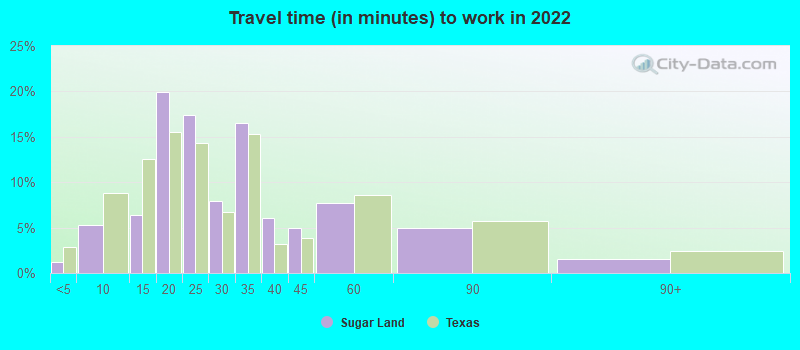
Travel time to work (commute)
Less than 5 minutes: 7595 to 9 minutes: 3,72410 to 14 minutes: 3,23615 to 19 minutes: 5,36720 to 24 minutes: 5,50225 to 29 minutes: 3,22330 to 34 minutes: 5,25535 to 39 minutes: 2,08640 to 44 minutes: 3,87745 to 59 minutes: 5,55960 to 89 minutes: 1,60390 or more minutes: 742
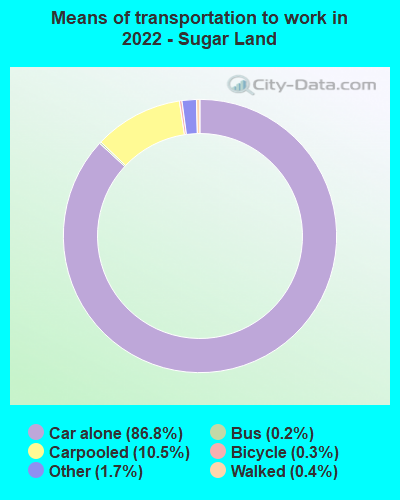
Means of transportation to work:
Drove a car alone: 56,672 (71.5%)Carpooled: 8,069 (10.2%)Bus : 65 (0.1%)Taxi: 1,383 (1.7%)Bicycle: 123 (0.2%)Walked: 380 (0.5%)Worked at home: 11,256 (14.2%)
Unemployment by race in 2022
Unemployment rate for White non-Hispanic residents 3.8% Males7.4% FemalesUnemployment rate for Black residents 6.6% Males0.6% FemalesUnemployment rate for American Indian and Alaska Native residents 49.2% FemalesUnemployment rate for Asian residents 4.6% Males2.3% FemalesUnemployment rate for other race residents 11.6% Males5.2% FemalesUnemployment rate for two or more race residents 6.9% Males3.5% FemalesUnemployment rate for Hispanic or Latino residents 3.5% Males7.6% Females
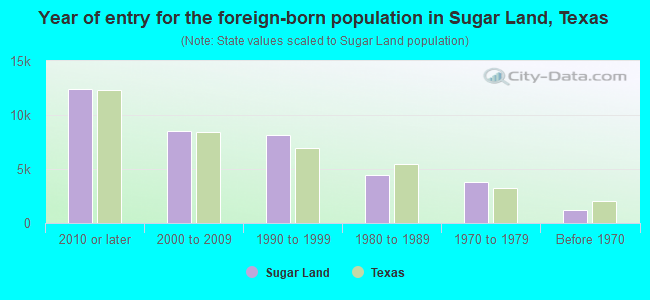
Year of entry for the foreign-born population in Sugar Land, Texas
12,395 2010 or later 8,508 2000 to 2009 8,133 1990 to 1999 4,463 1980 to 1989 3,824 1970 to 1979 1,227 Before 1970
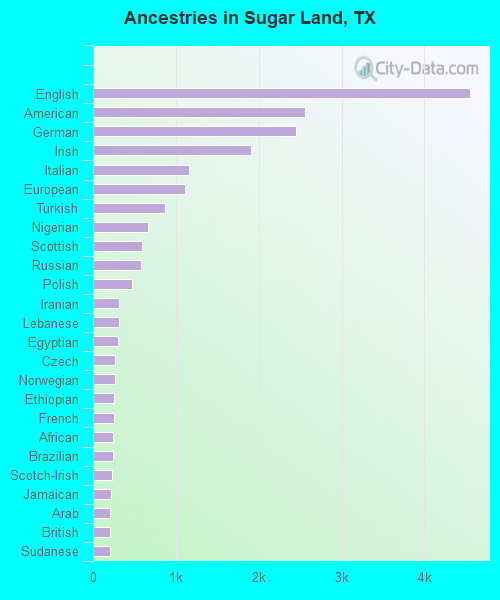
First ancestries reported:
English: 4,551 (6.7%)
American: 2,555 (3.8%)
German: 2,444 (3.6%)
Irish: 1,908 (2.8%)
Italian: 1,158 (1.7%)
European: 1,112 (1.6%)
Turkish: 869 (1.3%)
Nigerian: 666 (1.0%)
Scottish: 597 (0.9%)
Russian: 576 (0.8%)
Polish: 470 (0.7%)
Iranian: 318 (0.5%)
Lebanese: 313 (0.5%)
Egyptian: 298 (0.4%)
Czech: 269 (0.4%)
Norwegian: 260 (0.4%)
Ethiopian: 258 (0.4%)
French: 252 (0.4%)
African: 247 (0.4%)
Brazilian: 237 (0.3%)
Scotch-Irish: 224 (0.3%)
Jamaican: 220 (0.3%)
Arab: 207 (0.3%)
British: 202 (0.3%)
Sudanese: 202 (0.3%)
Canadian: 197 (0.3%)
Swedish: 193 (0.3%)
French Canadian: 192 (0.3%)
Greek: 181 (0.3%)
Welsh: 173 (0.3%)
Jordanian: 125 (0.2%)
Czechoslovakian: 122 (0.2%)
Dutch: 120 (0.2%)
Portuguese: 108 (0.2%)
Eastern European: 104 (0.2%)
Danish: 100 (0.1%)
Armenian: 82 (0.1%)
Zimbabwean: 63 (0.09%)
Scandinavian: 57 (0.08%)
Ghanaian: 47 (0.07%)
Haitian: 47 (0.07%)
Swiss: 43 (0.06%)
Austrian: 40 (0.06%)
Cajun: 38 (0.06%)
Romanian: 36 (0.05%)
Croatian: 33 (0.05%)
Belgian: 33 (0.05%)
Slovak: 24 (0.04%)
Northern European: 23 (0.03%)
German Russian: 22 (0.03%)
Hungarian: 21 (0.03%)
Lithuanian: 19 (0.03%)
Ukrainian: 19 (0.03%)
Palestinian: 17 (0.03%)
Finnish: 16 (0.02%)
Trinidadian and Tobagonian: 16 (0.02%)
Australian: 11 (0.02%)
Somali: 8 (0.01%)
Most common places of birth for foreign-born residents (%): India Sugar Land:
23.3% (9,348)Texas:
6.1% (306,347)
China, excluding Hong Kong and Taiwan Sugar Land:
14.2% (5,728)Texas:
2.3% (115,558)
Pakistan Sugar Land:
12.0% (4,834)Texas:
1.2% (62,159)
Vietnam Sugar Land:
6.8% (2,742)Texas:
3.7% (184,770)
Taiwan Sugar Land:
5.6% (2,233)Texas:
0.6% (27,844)
Philippines Sugar Land:
5.4% (2,164)Texas:
2.1% (103,148)
Mexico Sugar Land:
3.3% (1,345)Texas:
48.4% (2,411,723)
Turkey Sugar Land:
2.4% (964)Texas:
0.3% (13,298)
Venezuela Sugar Land:
2.2% (885)Texas:
1.5% (72,413)
Hong Kong Sugar Land:
1.9% (757)Texas:
0.2% (9,629)
Canada Sugar Land:
1.9% (753)Texas:
1.1% (55,371)
Nigeria Sugar Land:
1.8% (727)Texas:
1.9% (96,110)
Place of birth for U.S.-born residents:
This state: 43,319Other state: 27,785Northeast: 4,395Midwest: 7,110South: 10,385West: 5,895 93.8% of Sugar Land residents lived in the same house 1 years ago.
Out of people who lived in different houses, 24.1% lived in this county.
Out of people who lived in different counties, 73.8% lived in Texas.
Sugar Land:
93.8%State average:
85.7%
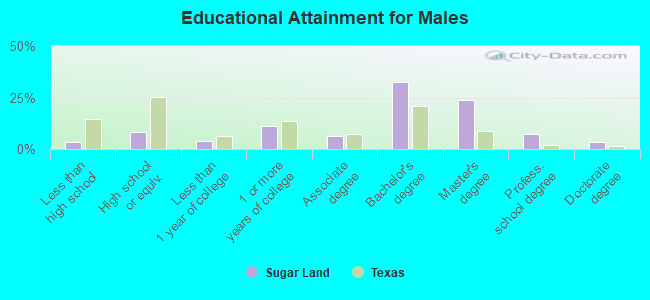
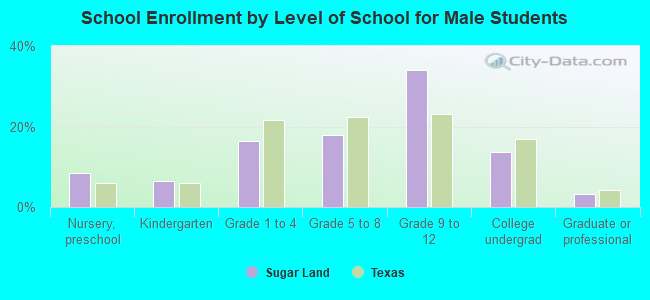
Education attainment for males 25 years and older:
No schooling: 143Nursery to 4th grade: 05th and 6th grade: 1427th and 8th grade: 09th grade: 9910th grade: 16911th grade: 21412th grade, no diploma: 530High school graduate (or equivalency): 2,930Less than 1 year of college: 1,322Some college more than 1 year, no degree: 3,954Associate degree: 2,357Bachelor's degree: 11,775Master's degree: 8,605Professional school degree: 2,678Doctorate degree: 1,267
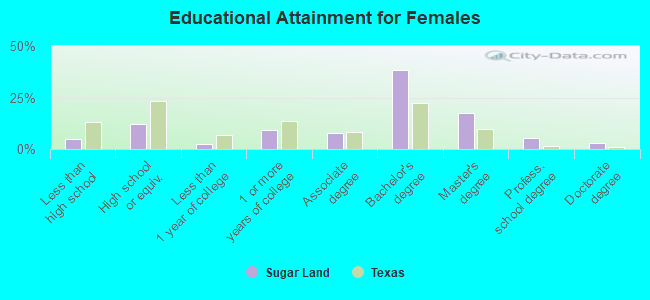
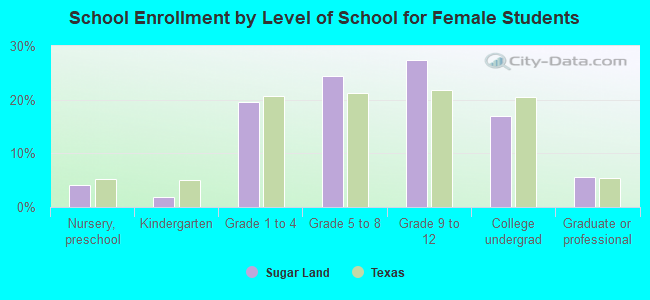
Education attainment for females 25 years and older:
No schooling: 466Nursery to 4th grade: 05th and 6th grade: 07th and 8th grade: 589th grade: 1010th grade: 36511th grade: 36412th grade, no diploma: 616High school graduate (or equivalency): 4,843Less than 1 year of college: 1,008Some college more than 1 year, no degree: 3,617Associate degree: 3,015Bachelor's degree: 15,114Master's degree: 6,944Professional school degree: 2,126Doctorate degree: 1,110
Housing units in structures:
One, detached: 34,821One, attached: 856Two: 523 or 4: 675 to 9: 58410 to 19: 52120 to 49: 86650 or more: 2,744Mobile homes: 99Housing units lacking complete kitchen facilities in 2022: 0.7%House/condo owner moved in on average 12 years ago
Renter moved in on average 2 years ago
Private vs. public school enrollment:
Students in private schools in grades 1 to 8 (elementary and middle school): 1,150 Students in private schools in grades 9 to 12 (high school): 1,311 Students in private undergraduate colleges: 580