Sulphur, OK (Oklahoma) Houses and Residents
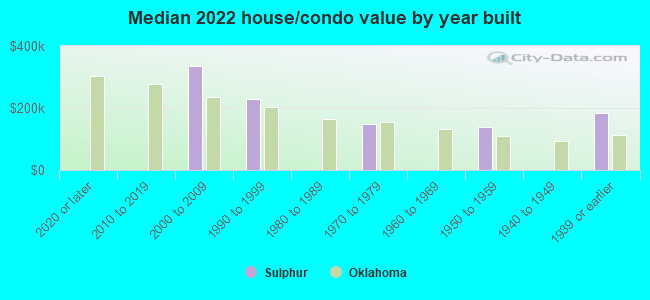
| Sulphur: | $140,992 |
| Oklahoma: | $191,700 |
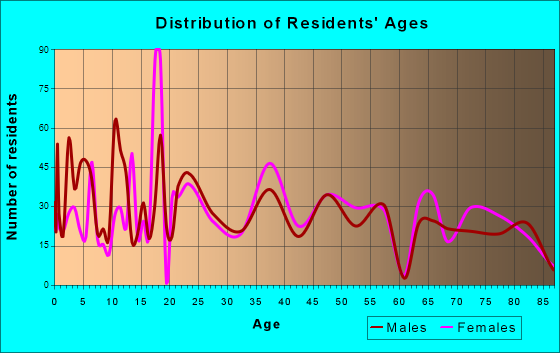
Total population: 5,052 (Urban population: 4,685 (all inside urban clusters), Rural population: 117 (28 farm, 89 nonfarm))
Houses: 2,274 (1,782 occupied: 1,187 owner occupied, 628 renter occupied)
| % of renters here: | 35% |
| State: | 35% |
Housing density: 334 houses/condos per square mile
Median price asked for vacant for-sale houses and condos in 2022: $166,513.
Median contract rent in 2022: $673 (lower quartile is $526, upper quartile is $850)
Median rent asked for vacant for-rent units in 2022: $765
Median gross rent in Sulphur, OK in 2022: $871
Housing units in Sulphur with a mortgage: 561 (0 second mortgage, 0 home equity loan, 0 both second mortgage and home equity loan)
Houses without a mortgage: 1
Median household income for houses/condos with a mortgage: $79,206
Median household income for apartments without a mortgage: $56,238
Median monthly housing costs: $739
Compare current foreclosures near Sulphur, OK:
| Photo | Address | Area | Beds / Baths | Price | Details |
|---|---|---|---|---|---|

|
#1
Millennium Jct
Sulphur, OK 73086
|
1,665 sq. feet
|
2 baths 2 beds |
$257,900
|
show details |

|
#2
W Tishomingo Ave
Sulphur, OK 73086
|
1,180 sq. feet
|
2 baths 3 beds |
show details | |

|
#3
Oaklawn Rd
Sulphur, OK 73086
|
1,620 sq. feet
|
2 baths 3 beds |
show details | |

|
#4
E Vinita Ave
Sulphur, OK 73086
|
1,233 sq. feet
|
1 baths 2 beds |
show details | |

|
#5
W Tishomingo Ave
Sulphur, OK 73086
|
1,698 sq. feet
|
2 baths 3 beds |
show details | |

|
#6
W 13th St
Sulphur, OK 73086
|
720 sq. feet
|
1 baths 2 beds |
show details | |

|
#7
Centennial Blvd
Sulphur, OK 73086
|
1,284 sq. feet
|
2 baths 2 beds |
show details | |

|
#8
W Wyandotte Ave
Sulphur, OK 73086
|
1,404 sq. feet
|
1 baths 2 beds |
show details | |

|
#9
E 1st St
Sulphur, OK 73086
|
1,788 sq. feet
|
2 baths 3 beds |
show details | |

|
#10
W Broadway Ave
Sulphur, OK 73086
|
- sq. feet
|
- baths - beds |
show details |
| Photo | Address | Area | Beds / Baths | Price | Details |
|---|---|---|---|---|---|

|
#11
E Ardmore Ave
Sulphur, OK 73086
|
- sq. feet
|
- baths - beds |
show details | |

|
#12
Comanche Rd
Sulphur, OK 73086
|
- sq. feet
|
- baths - beds |
show details | |

|
#13
W Wynnewood Ave
Sulphur, OK 73086
|
- sq. feet
|
- baths - beds |
show details | |

|
#14
N Taylor Ave
Wynnewood, OK 73098
|
942 sq. feet
|
1 baths 2 beds |
show details | |

|
#15
W Frisco Ave
Roff, OK 74865
|
- sq. feet
|
- baths - beds |
show details | |

|
#16
W Division
Roff, OK 74865
|
- sq. feet
|
- baths - beds |
show details | |

|
#17
E County Road 1631
Wynnewood, OK 73098
|
- sq. feet
|
- baths - beds |
show details | |

|
#18
State Highway 53
Ardmore, OK 73401
|
- sq. feet
|
- baths - beds |
show details | |

|
#19
Machell St
Ardmore, OK 73401
|
- sq. feet
|
- baths - beds |
show details | |

|
#20
E Colbert St
Wynnewood, OK 73098
|
- sq. feet
|
- baths - beds |
show details |
| Photo | Address | Area | Beds / Baths | Price | Details |
|---|---|---|---|---|---|

|
Check over 1 million property listings on Foreclosure.com!
|
browse all offers | |||
| Photo | Address | Area | Beds / Baths | Price | Details |
|---|

Latest news about housing in Sulphur, OK collected exclusively by city-data.com from local newspapers, TV, and radio stations

 | Sulphur, Oklahoma? (8 replies) |
| Conservative Wanting Out! Move to Norman? (19 replies) |
| I like Oklahoma and think it's underrated (129 replies) |
| Relocating to OK from WA (6 replies) |
| Move to Guthrie ?? (43 replies) |
| Ten Most Beautiful Places in Oklahoma (14 replies) |
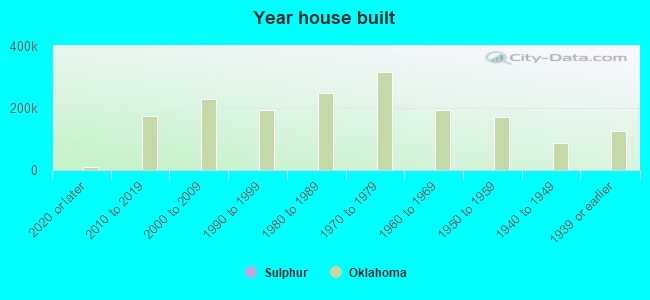
Median year apartment built: 1967
Household type by relationship:
Households: 5,087- Male householders: 658 (200 living alone), Female householders: 1,120 (470 living alone)
711 spouses (709 opposite-sex spouses), 64 unmarried partners, (57 opposite-sex unmarried partners), 1,569 children (1,382 natural, 37 adopted, 148 stepchildren), 164 grandchildren, 38 brothers or sisters, 91 parents, 0 foster children, 110 other relatives, 147 non-relatives
- In group quarters: 411
Size of family households: 493 2-persons, 147 3-persons, 150 4-persons, 141 5-persons, 40 6-persons, 42 7-or-more-persons.
Size of nonfamily households: 678 1-person, 73 2-persons, 17 3-persons, 25 4-persons.
782 married couples with children.
413 single-parent households (80 men, 333 women).
96.0% of residents of Sulphur speak English at home.
2.4% of residents speak Spanish at home (47% speak English very well, 53% speak English well).
0.5% of residents speak other Indo-European language at home (64% speak English very well, 36% speak English well).
1.0% of residents speak other language at home (63% speak English very well, 37% speak English well).
Foreign born population: 89 (1.7%)
(43.8% of them are naturalized citizens)
| Here: | 5.7 |
| State: | 6.1 |
| Here: | 5.1 |
| State: | 4.5 |
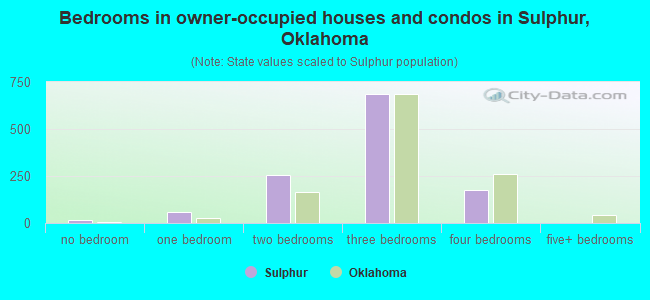
- Bedrooms in owner-occupied houses and condos in Sulphur, Oklahoma
- 15no bedroom
- 591 bedroom
- 2532 bedrooms
- 6853 bedrooms
- 1754 bedrooms
- 05+ bedrooms
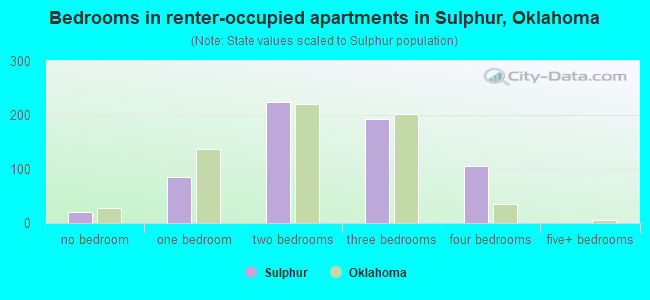
- Bedrooms in renter-occupied apartments in Sulphur, Oklahoma
- 21no bedroom
- 861 bedroom
- 2242 bedrooms
- 1923 bedrooms
- 1054 bedrooms
- 05+ bedrooms
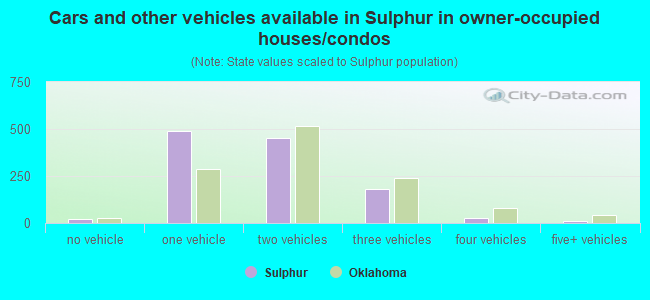
- Cars and other vehicles available in Sulphur in owner-occupied houses/condos
- 23no vehicle
- 4911 vehicle
- 4542 vehicles
- 1833 vehicles
- 244 vehicles
- 135+ vehicles
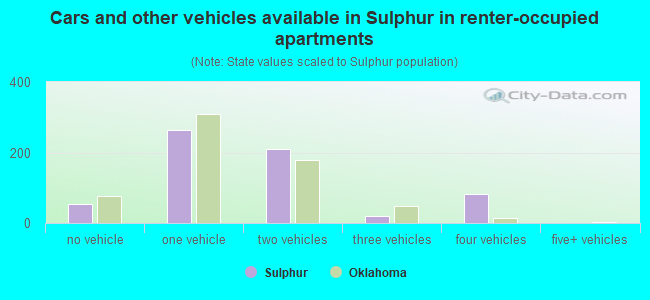
- Cars and other vehicles available in Sulphur in renter-occupied apartments
- 54no vehicle
- 2631 vehicle
- 2102 vehicles
- 213 vehicles
- 814 vehicles
- 05+ vehicles
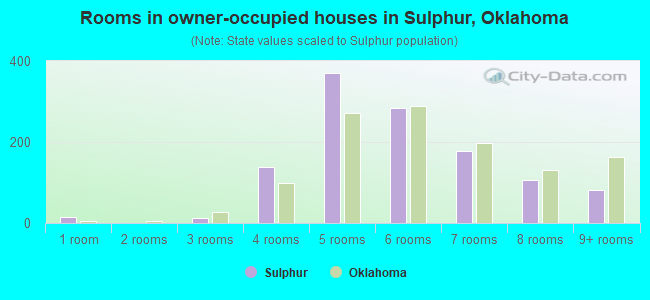
- Rooms in owner-occupied houses in Sulphur, Oklahoma
- 151 room
- 02 rooms
- 133 rooms
- 1394 rooms
- 3705 rooms
- 2856 rooms
- 1777 rooms
- 1068 rooms
- 819+ rooms
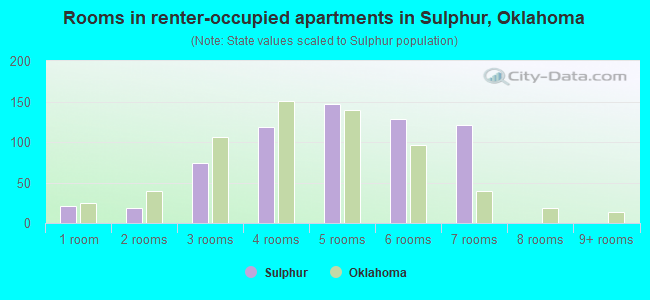
- Rooms in renter-occupied apartments in Sulphur, Oklahoma
- 211 room
- 192 rooms
- 743 rooms
- 1184 rooms
- 1475 rooms
- 1296 rooms
- 1217 rooms
- 08 rooms
- 09+ rooms
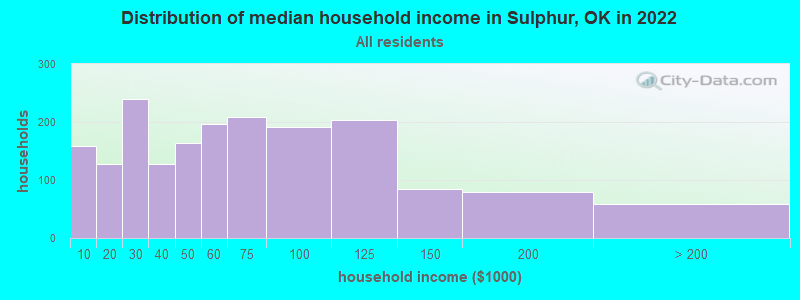
Sulphur, OK household income distribution

- 158Less than $10,000
- 128$10,000 to $19,999
- 239$20,000 to $29,999
- 128$30,000 to $39,999
- 163$40,000 to $49,999
- 196$50,000 to $59,999
- 209$60,000 to $74,999
- 191$75,000 to $99,999
- 204$100,000 to $124,999
- 85$125,000 to $149,999
- 80$150,000 to $199,999
- 59$200,000 or more
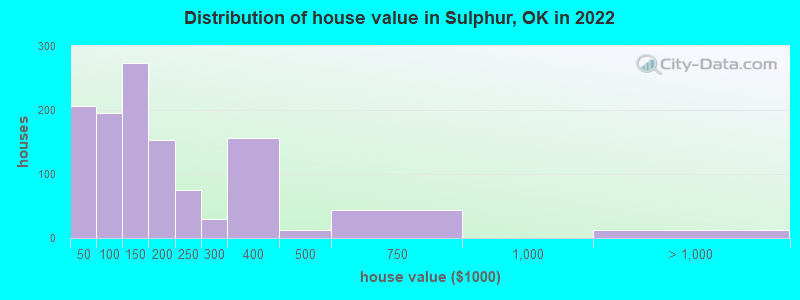
Home value of owner - occupied houses in 2022 in Sulphur, OK
-
- 19Less than $10,000
- 10$15,000 to $19,999
- 56$20,000 to $24,999
- 17$25,000 to $29,999
- 72$30,000 to $34,999
- 30$40,000 to $49,999
- 18$50,000 to $59,999
- 31$60,000 to $69,999
- 13$70,000 to $79,999
- 61$80,000 to $89,999
- 39$90,000 to $99,999
- 158$100,000 to $124,999
- 114$125,000 to $149,999
- 58$150,000 to $174,999
- 94$175,000 to $199,999
- 75$200,000 to $249,999
- 28$250,000 to $299,999
- 157$300,000 to $399,999
- 12$400,000 to $499,999
- 44$500,000 to $749,999
- 12$2,000,000 or more
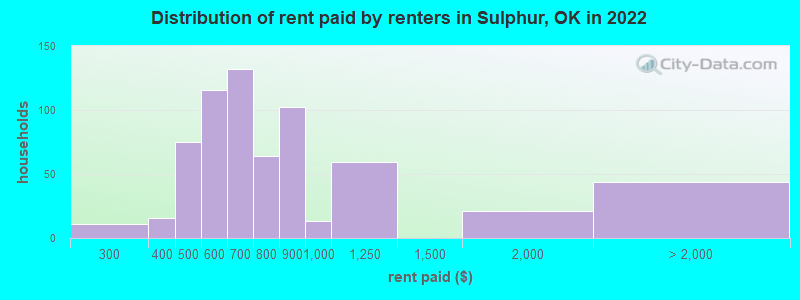
Rent paid by renters in 2022 in Sulphur, OK
-
- 11$250 to $299
- 16$350 to $399
- 74$400 to $449
- 95$500 to $549
- 20$550 to $599
- 57$600 to $649
- 74$650 to $699
- 50$700 to $749
- 13$750 to $799
- 102$800 to $899
- 13$900 to $999
- 59$1,000 to $1,249
- 20$1,500 to $1,999
- 44No cash rent
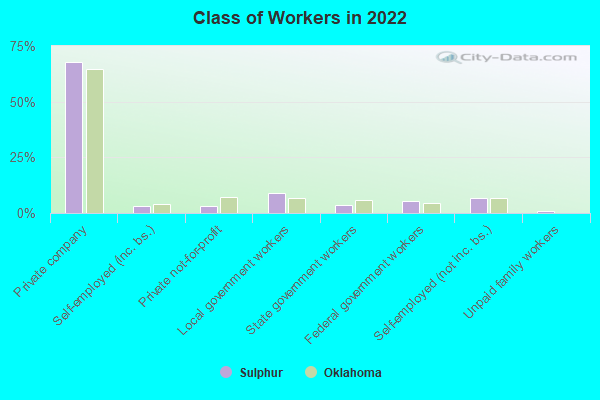
Percentage of workers working in this county: 72.8%
Number of people working at home: 33 (1.7% of all workers)
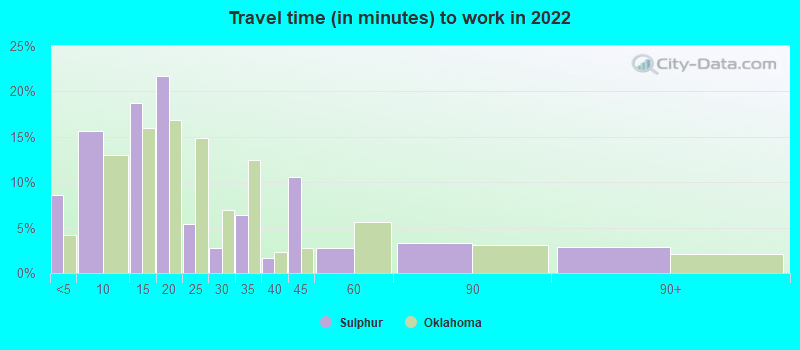
Travel time to work (commute)
- Less than 5 minutes: 290
- 5 to 9 minutes: 352
- 10 to 14 minutes: 268
- 15 to 19 minutes: 381
- 20 to 24 minutes: 42
- 25 to 29 minutes: 47
- 30 to 34 minutes: 145
- 35 to 39 minutes: 64
- 40 to 44 minutes: 9
- 45 to 59 minutes: 164
- 60 to 89 minutes: 60
- 90 or more minutes: 38
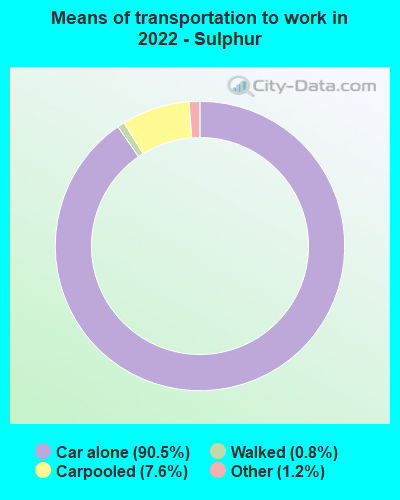
Means of transportation to work:
- Drove a car alone: 2,758 (87.6%)
- Carpooled: 235 (7.5%)
- Taxi: 35 (1.1%)
- Walked: 24 (0.8%)
- Worked at home: 33 (1.0%)
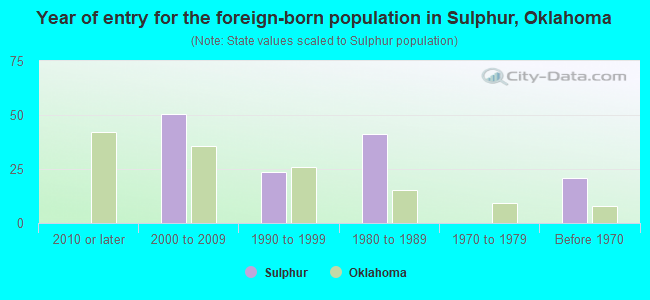
- Year of entry for the foreign-born population in Sulphur, Oklahoma
- 02010 or later
- 512000 to 2009
- 231990 to 1999
- 411980 to 1989
- 01970 to 1979
- 21Before 1970
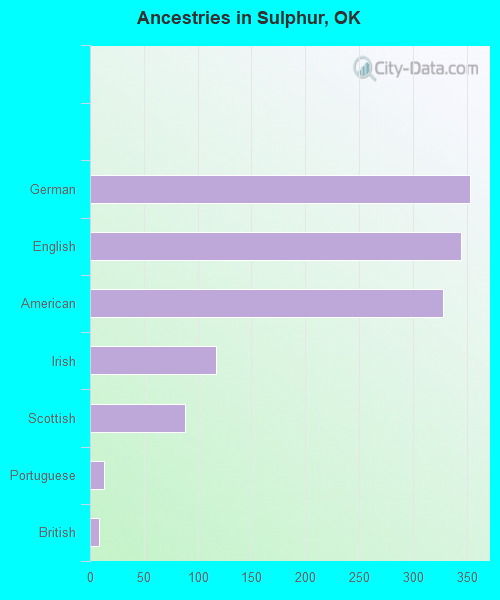
First ancestries reported:
- German: 353 (12.5%)
- English: 345 (12.3%)
- American: 328 (11.7%)
- Irish: 117 (4.2%)
- Scottish: 88 (3.1%)
- Portuguese: 13 (0.5%)
- British: 8 (0.3%)
- Eastern European: 2 (0.07%)
Most common places of birth for foreign-born residents (%):
| Sulphur: | 88.8% (79) |
| Oklahoma: | 42.4% (103,425) |
| Sulphur: | 20.2% (18) |
| Oklahoma: | 0.5% (1,194) |
Place of birth for U.S.-born residents:
- This state: 3,558
- Other state: 1,369
- Northeast: 76
- Midwest: 254
- South: 578
- West: 464
84.6% of Sulphur residents lived in the same house 1 years ago.
Out of people who lived in different houses, 31.5% lived in this county.
Out of people who lived in different counties, 66.3% lived in Oklahoma.
| Sulphur: | 84.6% |
| State average: | 85.5% |
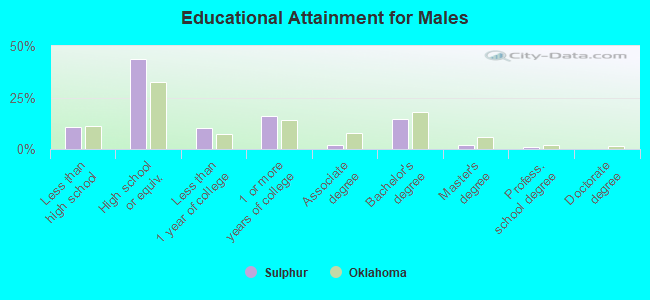
Education attainment for males 25 years and older:
- No schooling: 39
- Nursery to 4th grade: 0
- 5th and 6th grade: 20
- 7th and 8th grade: 32
- 9th grade: 10
- 10th grade: 27
- 11th grade: 0
- 12th grade, no diploma: 25
- High school graduate (or equivalency): 615
- Less than 1 year of college: 141
- Some college more than 1 year, no degree: 222
- Associate degree: 26
- Bachelor's degree: 203
- Master's degree: 27
- Professional school degree: 15
- Doctorate degree: 0
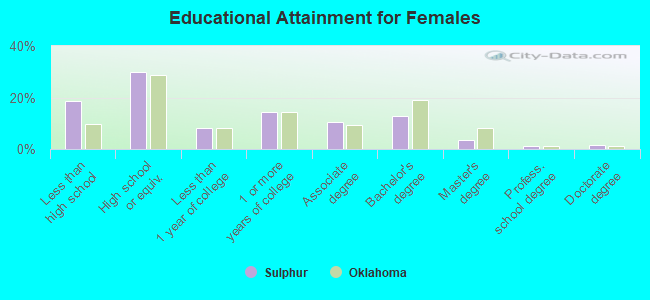
Education attainment for females 25 years and older:
- No schooling: 62
- Nursery to 4th grade: 0
- 5th and 6th grade: 0
- 7th and 8th grade: 48
- 9th grade: 20
- 10th grade: 77
- 11th grade: 37
- 12th grade, no diploma: 83
- High school graduate (or equivalency): 525
- Less than 1 year of college: 140
- Some college more than 1 year, no degree: 249
- Associate degree: 187
- Bachelor's degree: 226
- Master's degree: 59
- Professional school degree: 18
- Doctorate degree: 25
Housing units in structures:
- One, detached: 1,896
- One, attached: 45
- Two: 90
- 3 or 4: 92
- 10 to 19: 27
- Mobile homes: 122
Median worth of mobile homes: $49,690
Housing units lacking complete kitchen facilities in 2022: 9.7%
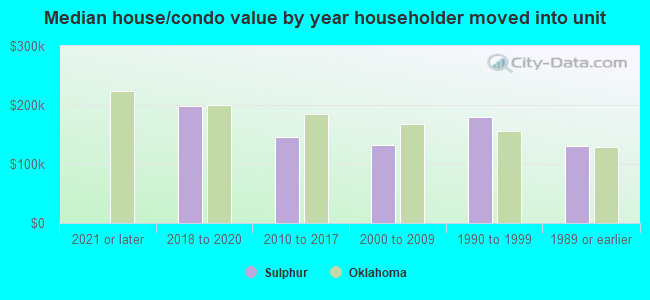
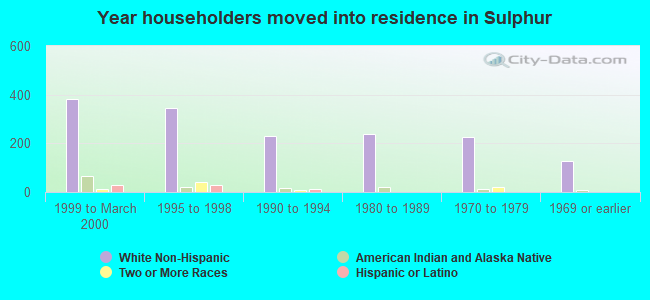
House/condo owner moved in on average 15 years ago
Renter moved in on average 4 years ago
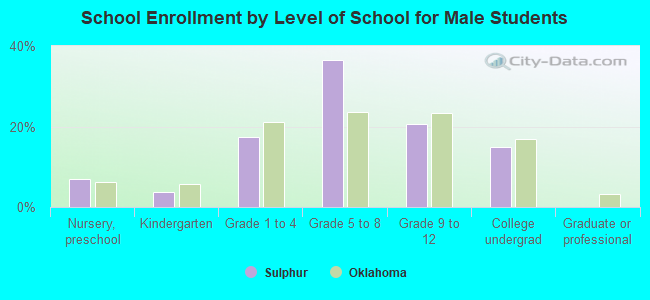
Private vs. public school enrollment:
| Here: | 16.6% |
| Oklahoma: | 11.7% |
| Here: | 0.0% |
| Oklahoma: | 11.7% |
| Here: | 23.3% |
| Oklahoma: | 19.3% |