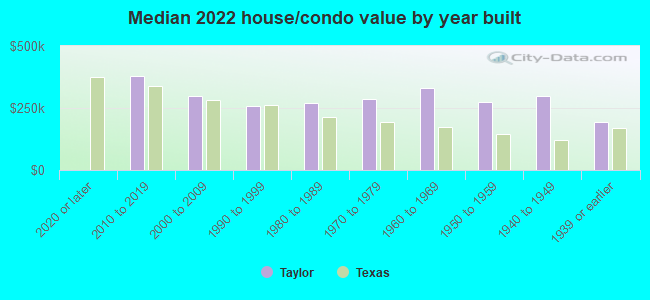
Taylor, TX (Texas) Houses and Residents
| Taylor: | $290,648 |
| Texas: | $275,400 |
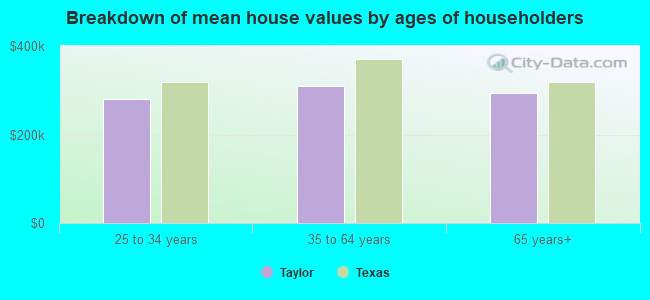
Mean price in 2022:
Detached houses: $216,372
Here: $216,372 State: $369,058 Townhouses or other attached units: $186,716
Here: $186,716 State: $327,631 Mobile homes: $61,208
Here: $61,208 State: $124,413
Total population: 16,483 (Urban population: 13,040 (all inside urban clusters), Rural population: 513 (8 farm, 505 nonfarm))
Houses: 7,780 (7,124 occupied: 5,138 owner occupied, 2,104 renter occupied)
| % of renters here: | 29% |
| State: | 38% |
Housing density: 575 houses/condos per square mile
Median price asked for vacant for-sale houses and condos in 2022: $316,496.
Median contract rent in 2022: $906 (lower quartile is $644, upper quartile is $1,039)
Median rent asked for vacant for-rent units in 2022: $410
Median gross rent in Taylor, TX in 2022: $1,139
Housing units in Taylor with a mortgage: 2,792 (232 second mortgage, 9 home equity loan, 213 both second mortgage and home equity loan)
Houses without a mortgage: 86
Median household income for houses/condos with a mortgage: $89,001
Median household income for apartments without a mortgage: $64,841
Median monthly housing costs: $1,183
Compare current foreclosures near Taylor, TX:
| Photo | Address | Area | Beds / Baths | Price | Details |
|---|---|---|---|---|---|

|
#1
Davis St
Taylor, TX 76574
|
952 sq. feet
|
1 baths - beds |
show details | |

|
#2
W Rio Grande St
Taylor, TX 76574
|
1,260 sq. feet
|
1 baths - beds |
show details | |

|
#3
Gunther Way
Taylor, TX 76574
|
- sq. feet
|
- baths - beds |
show details | |

|
#4
Onna St
Taylor, TX 76574
|
- sq. feet
|
- baths - beds |
show details | |

|
#5
Beth Ann Loop
Taylor, TX 76574
|
- sq. feet
|
- baths - beds |
show details | |

|
#6
Bull Run Apt D
Taylor, TX 76574
|
- sq. feet
|
- baths - beds |
show details | |

|
#7
Revolutionary Trl
Manor, TX 78653
|
2,835 sq. feet
|
2 baths 4 beds |
show details | |

|
#8
Old Tract Rd
Pflugerville, TX 78660
|
1,496 sq. feet
|
2 baths 3 beds |
show details | |

|
#9
Sierra Wind Ln
Elgin, TX 78621
|
1,302 sq. feet
|
2 baths 3 beds |
show details | |

|
#10
Steven St
Hutto, TX 78634
|
1,737 sq. feet
|
2 baths 3 beds |
show details |
| Photo | Address | Area | Beds / Baths | Price | Details |
|---|---|---|---|---|---|

|
#11
Derby Day Ave
Pflugerville, TX 78660
|
- sq. feet
|
2 baths 3 beds |
show details | |

|
#12
Samuel Welch Way
Manor, TX 78653
|
1,487 sq. feet
|
2 baths 3 beds |
show details | |

|
#13
Stevenage Dr
Pflugerville, TX 78660
|
2,800 sq. feet
|
2 baths 4 beds |
show details | |

|
#14
Huxley Ln
Round Rock, TX 78664
|
1,868 sq. feet
|
2 baths 3 beds |
show details | |

|
#15
W Pietzsch St
Bartlett, TX 76511
|
1,816 sq. feet
|
3 baths 4 beds |
show details | |

|
#16
Silent Water Way
Pflugerville, TX 78660
|
1,802 sq. feet
|
2 baths 4 beds |
show details | |

|
#17
Tolcarne Dr
Hutto, TX 78634
|
1,626 sq. feet
|
2 baths 4 beds |
show details | |

|
#18
Dove Haven Dr
Pflugerville, TX 78660
|
1,346 sq. feet
|
2 baths 3 beds |
show details | |

|
#19
Windmill Ranch Ave
Pflugerville, TX 78660
|
1,607 sq. feet
|
2 baths 3 beds |
show details | |

|
#20
Purple Martin Dr
Pflugerville, TX 78660
|
3,895 sq. feet
|
3 baths 5 beds |
show details |
| Photo | Address | Area | Beds / Baths | Price | Details |
|---|---|---|---|---|---|

|
#21
Knights Branch Dr
Elgin, TX 78621
|
- sq. feet
|
2 baths 4 beds |
show details | |

|
#22
Bluejay Cv
Hutto, TX 78634
|
1,390 sq. feet
|
2 baths 3 beds |
show details | |

|
#23
Shady Meadow Way
Manor, TX 78653
|
2,119 sq. feet
|
2 baths 4 beds |
show details | |

|
#24
Musselman Ct
Hutto, TX 78634
|
1,232 sq. feet
|
2 baths 3 beds |
show details | |

|
#25
Lidell St
Hutto, TX 78634
|
- sq. feet
|
2 baths 4 beds |
show details | |

|
#26
Laguna Cv
Hutto, TX 78634
|
3,893 sq. feet
|
5 baths - beds |
show details | |

|
#27
Fallsprings Way
Manor, TX 78653
|
2,221 sq. feet
|
2 baths - beds |
show details | |

|
#28
Altamont St
Hutto, TX 78634
|
1,800 sq. feet
|
2 baths - beds |
show details | |

|
#29
Buckley Ln
Round Rock, TX 78664
|
1,698 sq. feet
|
2 baths - beds |
show details | |

|
#30
Canyon Trail Ct
Round Rock, TX 78664
|
1,776 sq. feet
|
2 baths - beds |
show details |
| Photo | Address | Area | Beds / Baths | Price | Details |
|---|---|---|---|---|---|

|
#31
Bell Rock Cir
Pflugerville, TX 78660
|
1,831 sq. feet
|
2 baths - beds |
show details | |

|
#32
Mohican
Round Rock, TX 78665
|
1,534 sq. feet
|
2 baths - beds |
show details | |

|
#33
Picadilly Dr
Pflugerville, TX 78660
|
1,378 sq. feet
|
2 baths - beds |
show details | |

|
#34
Bluebonnet Dr
Round Rock, TX 78664
|
3,127 sq. feet
|
2 baths - beds |
show details | |

|
#35
Meadow Creek Dr
Pflugerville, TX 78660
|
1,647 sq. feet
|
2 baths - beds |
show details | |

|
#36
S Crossing Dr
Round Rock, TX 78664
|
1,569 sq. feet
|
2 baths - beds |
show details | |

|
#37
Redwing Way
Round Rock, TX 78664
|
1,179 sq. feet
|
1 baths - beds |
show details | |

|
#38
Wiseman Dr
Pflugerville, TX 78660
|
1,722 sq. feet
|
2 baths - beds |
show details | |

|
#39
E Mesa Park Dr
Round Rock, TX 78664
|
2,052 sq. feet
|
2 baths - beds |
show details | |

|
#40
Honeysuckle Ln
Pflugerville, TX 78660
|
1,426 sq. feet
|
2 baths - beds |
show details |
| Photo | Address | Area | Beds / Baths | Price | Details |
|---|---|---|---|---|---|

|
#41
Meadow Creek Dr
Pflugerville, TX 78660
|
1,667 sq. feet
|
2 baths - beds |
show details | |

|
#42
Connemara Ln
Pflugerville, TX 78660
|
1,812 sq. feet
|
2 baths - beds |
show details | |

|
#43
Burnet Forest Cv
Elgin, TX 78621
|
2,160 sq. feet
|
2 baths - beds |
show details | |

|
#44
Burnet Forest Cv # 16102
Elgin, TX 78621
|
2,160 sq. feet
|
2 baths - beds |
show details | |

|
#45
Liffey Dr
Pflugerville, TX 78660
|
1,822 sq. feet
|
2 baths - beds |
show details | |

|
#46
Rosemary Ln
Round Rock, TX 78664
|
1,376 sq. feet
|
2 baths - beds |
show details | |

|
#47
E Mesa Park Cv
Round Rock, TX 78664
|
2,229 sq. feet
|
2 baths - beds |
show details | |

|
#48
Ashberry Trl
Georgetown, TX 78626
|
2,608 sq. feet
|
2 baths - beds |
show details | |

|
#49
Walleye Way
Round Rock, TX 78665
|
1,341 sq. feet
|
2 baths - beds |
show details | |

|
Check over 1 million property listings on Foreclosure.com!
|
browse all offers | |||

Latest news about housing in Taylor, TX collected exclusively by city-data.com from local newspapers, TV, and radio stations

 | Drees Homes in Timber Creek (3 replies) |
| Darling Homes / Taylor Morrison Lender (1 reply) |
| Lennar homes in Fortworth, TX (3 replies) |
| Taylor Morrison Homes - Riverstone in Sugar Land - Are these built on an Indian Graveyard? (17 replies) |
| Taylor Morrison Homes? (38 replies) |
| Highland vs Bloomfield home (14 replies) |
Median year apartment built: 1982
Household type by relationship:
Households: 17,888- Male householders: 3,009 (875 living alone), Female householders: 4,007 (1,282 living alone)
3,345 spouses (3,325 opposite-sex spouses), 409 unmarried partners, (409 opposite-sex unmarried partners), 5,317 children (4,982 natural, 100 adopted, 234 stepchildren), 624 grandchildren, 66 brothers or sisters, 160 parents, 0 foster children, 321 other relatives, 325 non-relatives
- In group quarters: 300
Size of family households: 2,133 2-persons, 964 3-persons, 762 4-persons, 484 5-persons, 217 6-persons, 66 7-or-more-persons.
Size of nonfamily households: 2,369 1-person, 278 2-persons.
1,961 married couples with children.
1,724 single-parent households (326 men, 1,398 women).
71.6% of residents of Taylor speak English at home.
22.8% of residents speak Spanish at home (62% speak English very well, 16% speak English well, 12% speak English not well, 10% don't speak English at all).
2.2% of residents speak other Indo-European language at home (90% speak English very well, 8% speak English well, 2% speak English not well).
0.5% of residents speak Asian or Pacific Island language at home (51% speak English very well, 49% speak English well).
0.6% of residents speak other language at home (56% speak English very well, 44% speak English well).
Foreign born population: 1,950 (10.9%)
(50.3% of them are naturalized citizens)
| Here: | 5.8 |
| State: | 6.3 |
| Here: | 3.9 |
| State: | 4.0 |
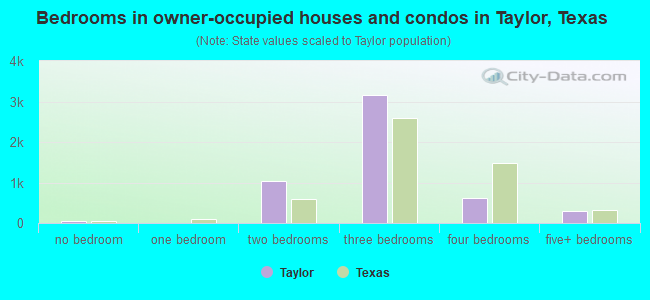
- Bedrooms in owner-occupied houses and condos in Taylor, Texas
- 39no bedroom
- 121 bedroom
- 1,0262 bedrooms
- 3,1603 bedrooms
- 6114 bedrooms
- 2905+ bedrooms
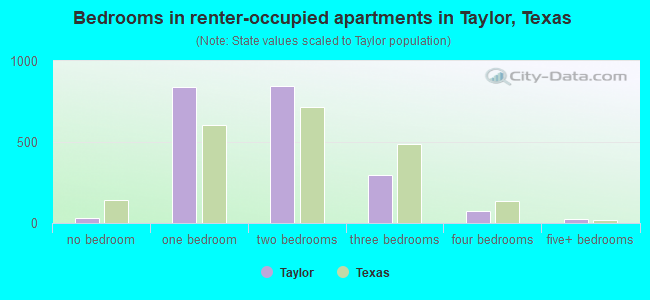
- Bedrooms in renter-occupied apartments in Taylor, Texas
- 28no bedroom
- 8371 bedroom
- 8462 bedrooms
- 2963 bedrooms
- 714 bedrooms
- 265+ bedrooms
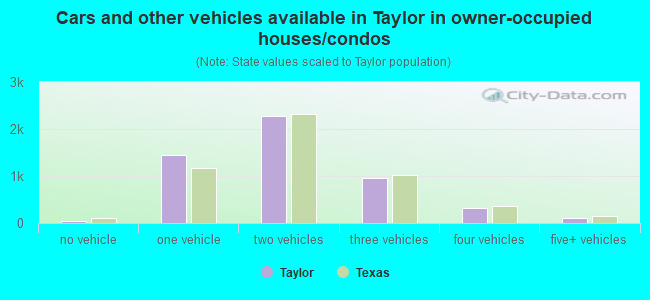
- Cars and other vehicles available in Taylor in owner-occupied houses/condos
- 34no vehicle
- 1,4471 vehicle
- 2,2852 vehicles
- 9563 vehicles
- 3204 vehicles
- 975+ vehicles
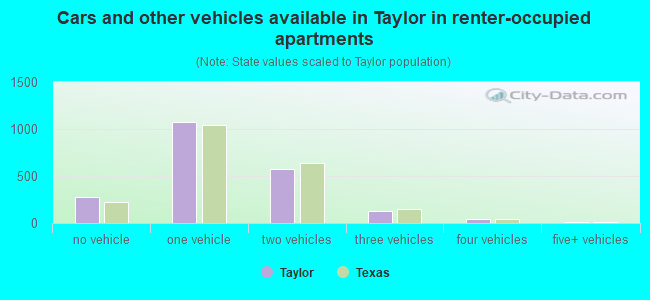
- Cars and other vehicles available in Taylor in renter-occupied apartments
- 278no vehicle
- 1,0741 vehicle
- 5792 vehicles
- 1253 vehicles
- 404 vehicles
- 85+ vehicles
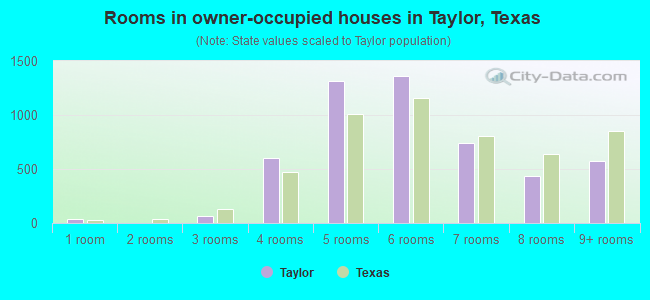
- Rooms in owner-occupied houses in Taylor, Texas
- 391 room
- 42 rooms
- 643 rooms
- 6024 rooms
- 1,3195 rooms
- 1,3576 rooms
- 7427 rooms
- 4328 rooms
- 5789+ rooms
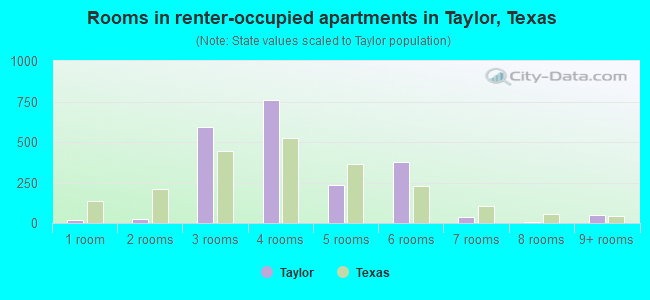
- Rooms in renter-occupied apartments in Taylor, Texas
- 201 room
- 262 rooms
- 5953 rooms
- 7584 rooms
- 2355 rooms
- 3786 rooms
- 367 rooms
- 78 rooms
- 519+ rooms
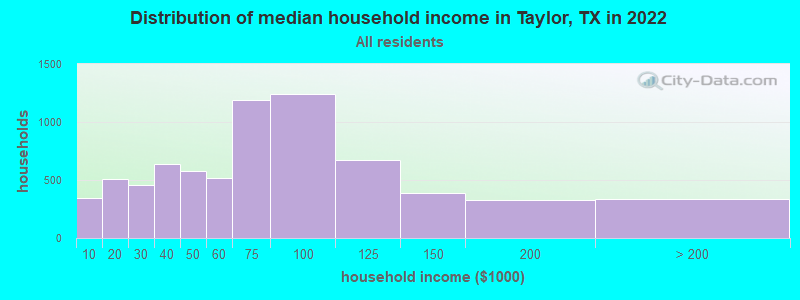
Taylor, TX household income distribution

- 348Less than $10,000
- 511$10,000 to $19,999
- 459$20,000 to $29,999
- 642$30,000 to $39,999
- 577$40,000 to $49,999
- 514$50,000 to $59,999
- 1,192$60,000 to $74,999
- 1,239$75,000 to $99,999
- 672$100,000 to $124,999
- 387$125,000 to $149,999
- 325$150,000 to $199,999
- 334$200,000 or more
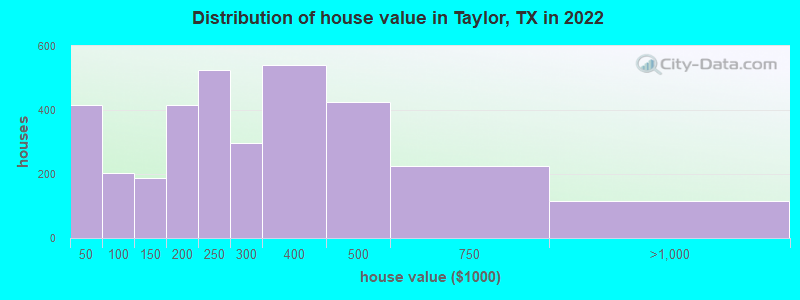
Home value of owner - occupied houses in 2022 in Taylor, TX
-
- 293Less than $10,000
- 37$10,000 to $14,999
- 19$15,000 to $19,999
- 38$20,000 to $24,999
- 12$30,000 to $34,999
- 13$40,000 to $49,999
- 39$50,000 to $59,999
- 41$60,000 to $69,999
- 19$70,000 to $79,999
- 16$80,000 to $89,999
- 73$90,000 to $99,999
- 119$100,000 to $124,999
- 67$125,000 to $149,999
- 178$150,000 to $174,999
- 238$175,000 to $199,999
- 525$200,000 to $249,999
- 296$250,000 to $299,999
- 542$300,000 to $399,999
- 425$400,000 to $499,999
- 225$500,000 to $749,999
- 106$750,000 to $999,999
- 8$2,000,000 or more
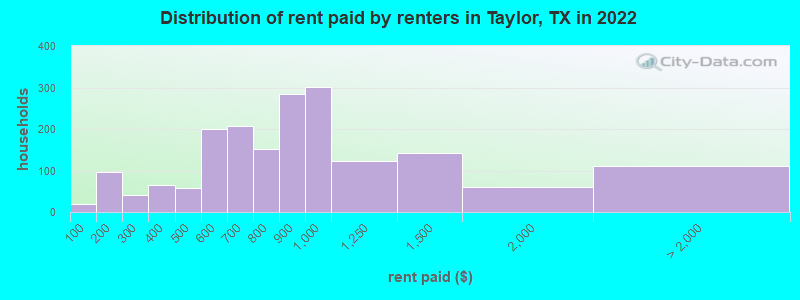
Rent paid by renters in 2022 in Taylor, TX
-
- 18Less than $100
- 73$100 to $149
- 22$150 to $199
- 34$200 to $249
- 6$250 to $299
- 57$300 to $349
- 6$350 to $399
- 54$400 to $449
- 4$450 to $499
- 60$500 to $549
- 140$550 to $599
- 31$600 to $649
- 176$650 to $699
- 72$700 to $749
- 78$750 to $799
- 284$800 to $899
- 301$900 to $999
- 123$1,000 to $1,249
- 143$1,250 to $1,499
- 60$1,500 to $1,999
- 29$2,000 to $2,499
- 82No cash rent
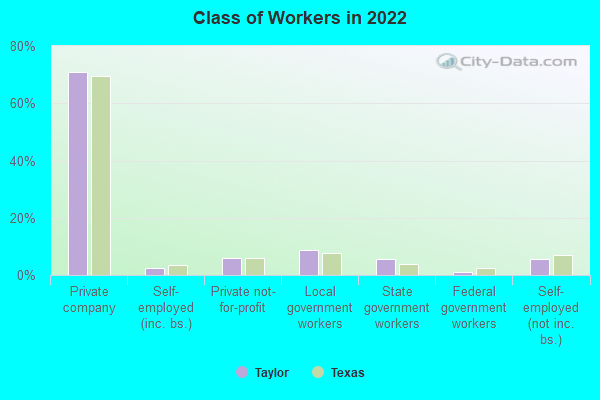
Percentage of workers working in this county: 70.9%
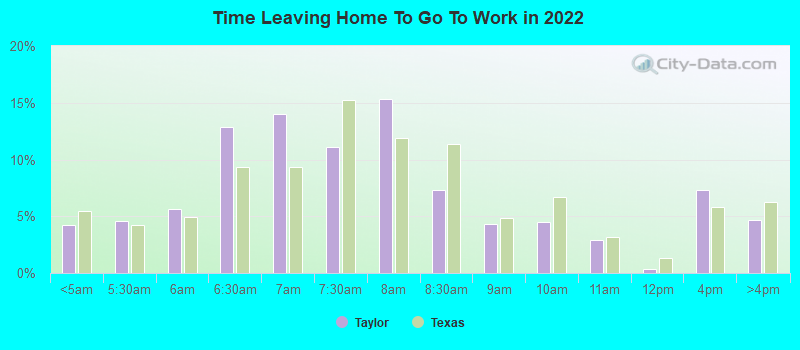
Number of people working at home: 940 (11.5% of all workers)
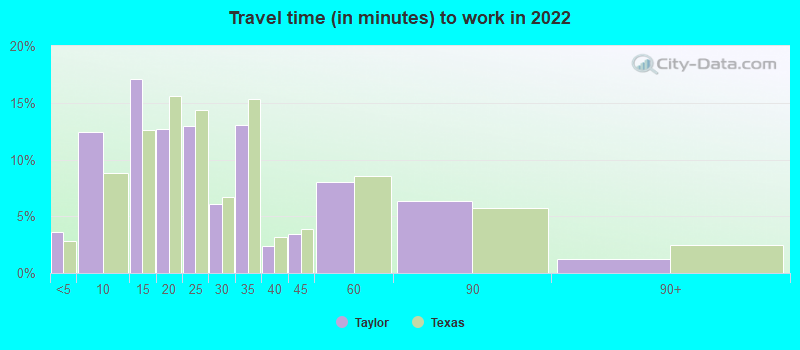
Travel time to work (commute)
- Less than 5 minutes: 262
- 5 to 9 minutes: 908
- 10 to 14 minutes: 777
- 15 to 19 minutes: 570
- 20 to 24 minutes: 350
- 25 to 29 minutes: 172
- 30 to 34 minutes: 836
- 35 to 39 minutes: 335
- 40 to 44 minutes: 489
- 45 to 59 minutes: 1,020
- 60 to 89 minutes: 886
- 90 or more minutes: 130
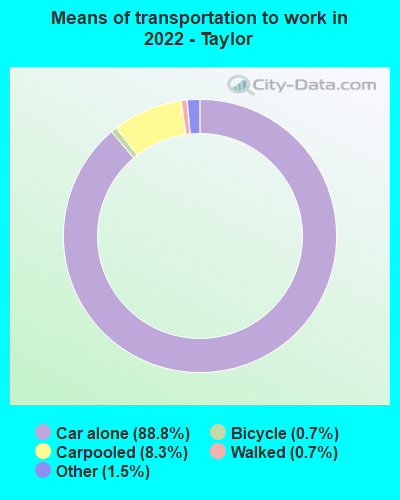
Means of transportation to work:
- Drove a car alone: 6,337 (74.2%)
- Carpooled: 485 (5.7%)
- Taxi: 145 (1.7%)
- Bicycle: 40 (0.5%)
- Walked: 64 (0.7%)
- Worked at home: 940 (11.0%)
- Unemployment by race in 2022
- Unemployment rate for White non-Hispanic residents
- 5.0%Males
- 3.9%Females
- Unemployment rate for Black residents
- 8.4%Males
- Unemployment rate for other race residents
- 2.9%Males
- Unemployment rate for two or more race residents
- 4.1%Males
- 4.2%Females
- Unemployment rate for Hispanic or Latino residents
- 2.8%Males
- 2.1%Females
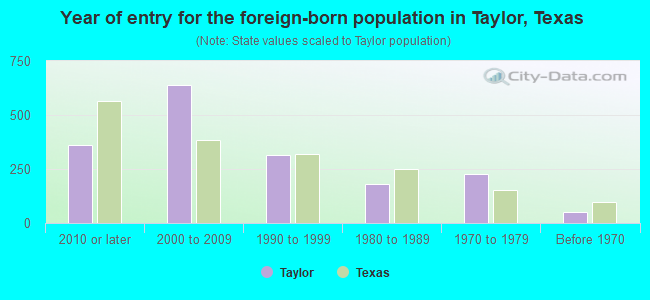
- Year of entry for the foreign-born population in Taylor, Texas
- 3622010 or later
- 6372000 to 2009
- 3131990 to 1999
- 1811980 to 1989
- 2281970 to 1979
- 49Before 1970
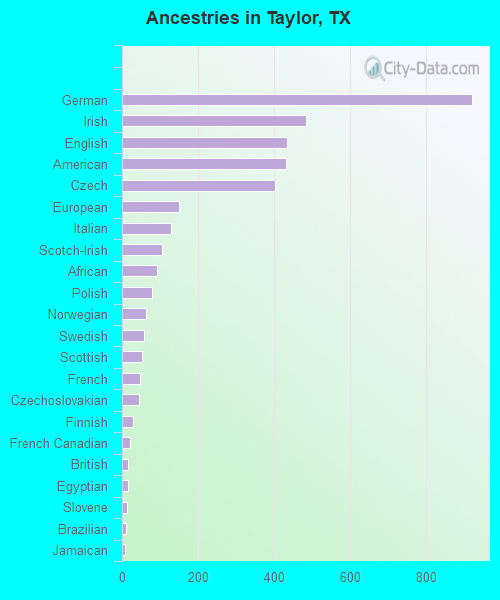
First ancestries reported:
- German: 920 (10.2%)
- Irish: 484 (5.4%)
- English: 434 (4.8%)
- American: 432 (4.8%)
- Czech: 402 (4.5%)
- European: 150 (1.7%)
- Italian: 129 (1.4%)
- Scotch-Irish: 105 (1.2%)
- African: 91 (1.0%)
- Polish: 80 (0.9%)
- Norwegian: 63 (0.7%)
- Swedish: 58 (0.6%)
- Scottish: 53 (0.6%)
- French: 47 (0.5%)
- Czechoslovakian: 45 (0.5%)
- Finnish: 28 (0.3%)
- French Canadian: 22 (0.2%)
- British: 16 (0.2%)
- Egyptian: 15 (0.2%)
- Slovene: 12 (0.1%)
- Brazilian: 10 (0.1%)
- Jamaican: 9 (0.10%)
- Croatian: 8 (0.09%)
- Portuguese: 8 (0.09%)
- Hungarian: 5 (0.06%)
- Ethiopian: 3 (0.03%)
- Eastern European: 2 (0.02%)
- Scandinavian: 2 (0.02%)
Most common places of birth for foreign-born residents (%):
| Taylor: | 60.1% (964) |
| Texas: | 48.4% (2,411,723) |
| Taylor: | 10.4% (166) |
| Texas: | 3.0% (147,182) |
| Taylor: | 3.9% (63) |
| Texas: | 4.5% (224,455) |
| Taylor: | 3.7% (59) |
| Texas: | 0.1% (5,241) |
| Taylor: | 3.4% (55) |
| Texas: | 0.4% (21,746) |
| Taylor: | 2.7% (44) |
| Texas: | 1.5% (72,413) |
| Taylor: | 2.4% (38) |
| Texas: | 2.3% (115,558) |
Place of birth for U.S.-born residents:
- This state: 11,737
- Other state: 3,691
- Northeast: 456
- Midwest: 1,133
- South: 871
- West: 1,211
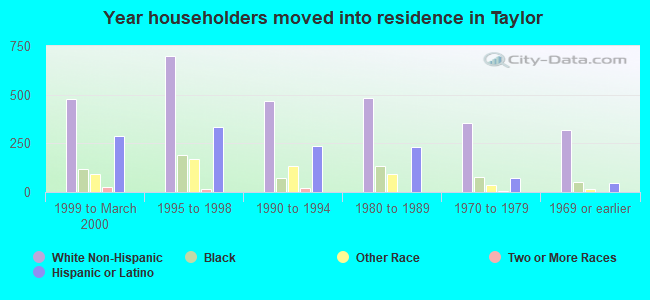
90.9% of Taylor residents lived in the same house 1 years ago.
Out of people who lived in different houses, 25.1% lived in this county.
Out of people who lived in different counties, 69.6% lived in Texas.
| Taylor: | 90.9% |
| State average: | 85.7% |
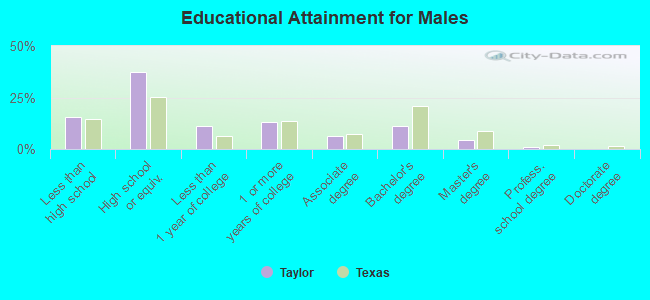
Education attainment for males 25 years and older:
- No schooling: 86
- Nursery to 4th grade: 154
- 5th and 6th grade: 86
- 7th and 8th grade: 134
- 9th grade: 127
- 10th grade: 115
- 11th grade: 100
- 12th grade, no diploma: 49
- High school graduate (or equivalency): 2,050
- Less than 1 year of college: 611
- Some college more than 1 year, no degree: 711
- Associate degree: 358
- Bachelor's degree: 620
- Master's degree: 235
- Professional school degree: 41
- Doctorate degree: 0
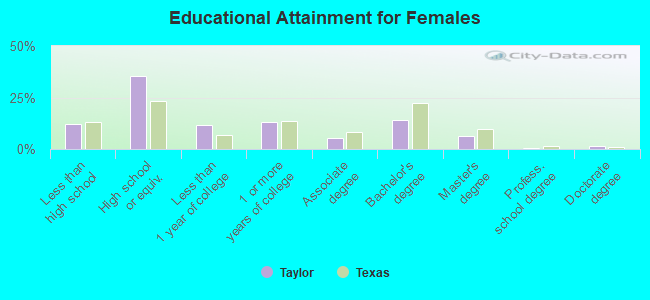
Education attainment for females 25 years and older:
- No schooling: 82
- Nursery to 4th grade: 29
- 5th and 6th grade: 168
- 7th and 8th grade: 120
- 9th grade: 126
- 10th grade: 78
- 11th grade: 89
- 12th grade, no diploma: 40
- High school graduate (or equivalency): 2,182
- Less than 1 year of college: 730
- Some college more than 1 year, no degree: 795
- Associate degree: 324
- Bachelor's degree: 878
- Master's degree: 394
- Professional school degree: 32
- Doctorate degree: 75
Housing units in structures:
- One, detached: 6,245
- One, attached: 136
- Two: 663
- 3 or 4: 309
- 5 to 9: 117
- 10 to 19: 61
- 20 to 49: 117
- 50 or more: 41
- Mobile homes: 87
Housing units lacking complete kitchen facilities in 2022: 3.1%
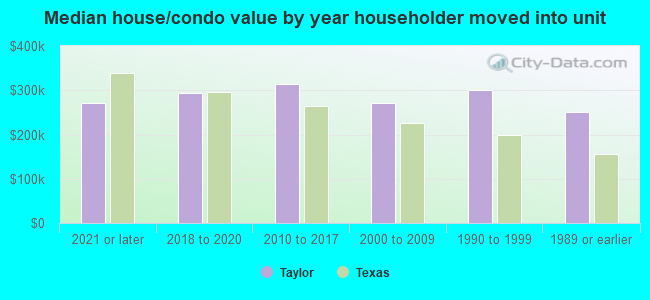
House/condo owner moved in on average 12 years ago
Renter moved in on average 5 years ago
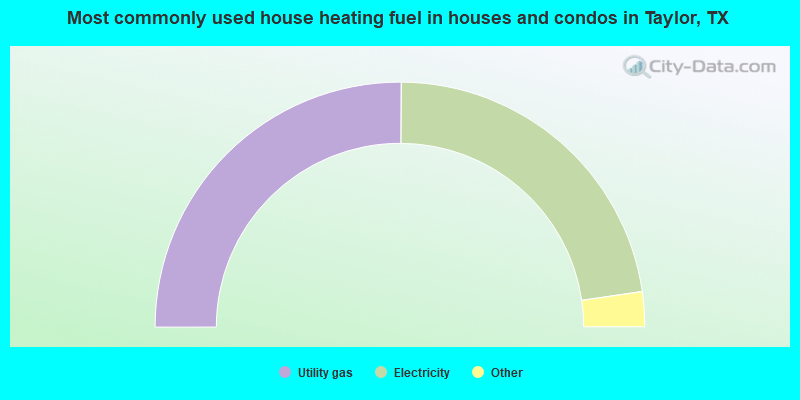
- 50.2%Utility gas
- 45.2%Electricity
- 3.1%Bottled, tank, or LP gas
- 1.3%Solar energy
- 0.2%Other fuel
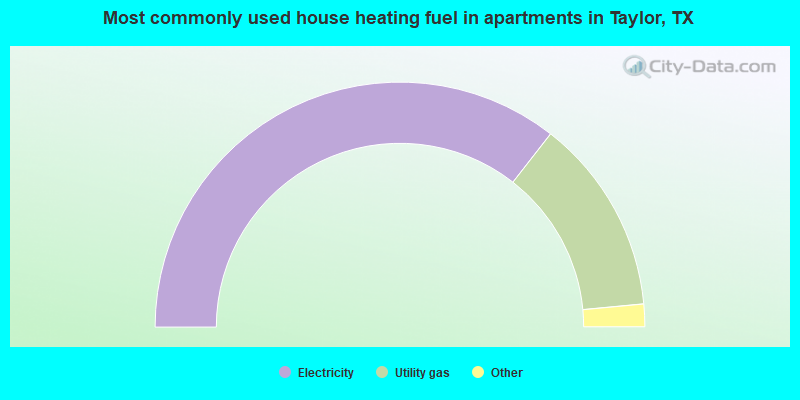
- 71.1%Electricity
- 25.9%Utility gas
- 2.0%Bottled, tank, or LP gas
- 1.0%No fuel used
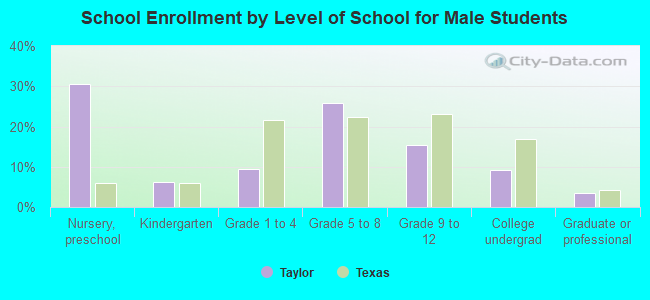
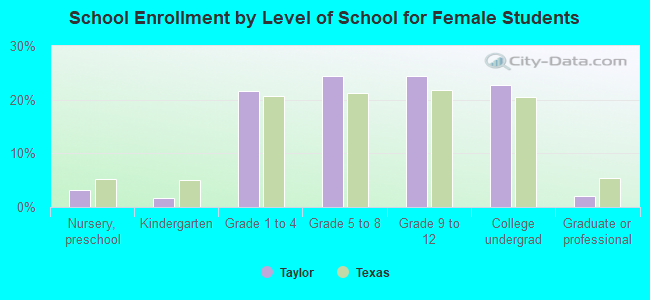
Private vs. public school enrollment:
| Here: | 7.9% |
| Texas: | 8.8% |
| Here: | 11.4% |
| Texas: | 8.0% |
| Here: | 16.4% |
| Texas: | 16.2% |