Housing density: 2,267 houses/condos per square mile
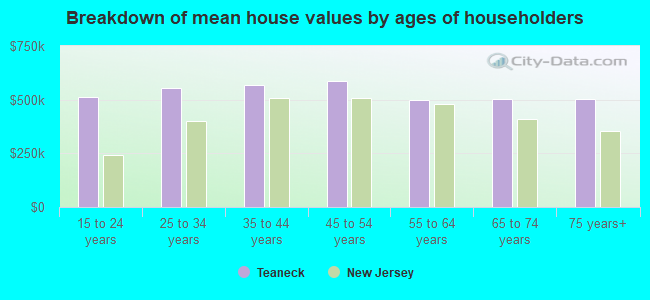
Median price asked for vacant for-sale houses and condos in 2022 in this county: $777,739.
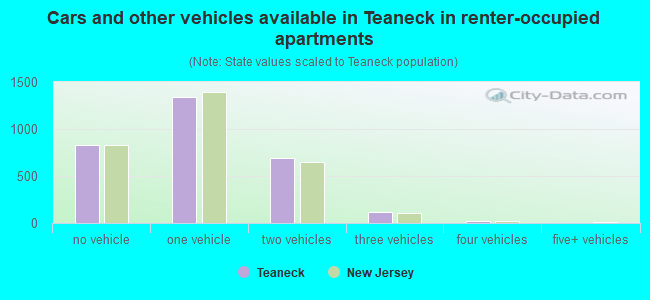
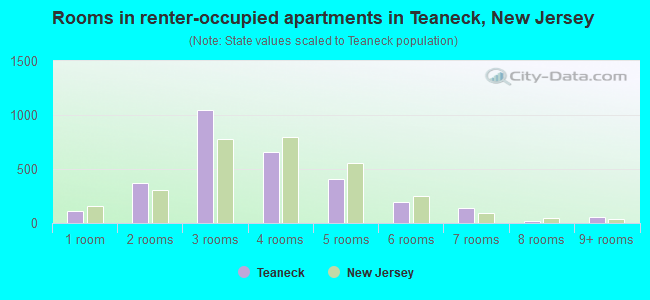
Median contract rent in 2022: $1,670 (lower quartile is $1,266, upper quartile is over $2,000)
Median rent asked for vacant for-rent units in 2022: $3,318
Median gross rent in Teaneck, NJ in 2022: $1,755
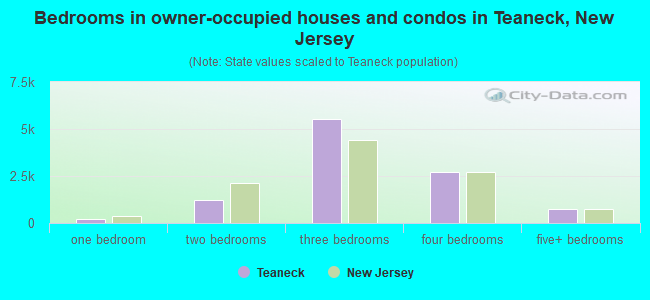
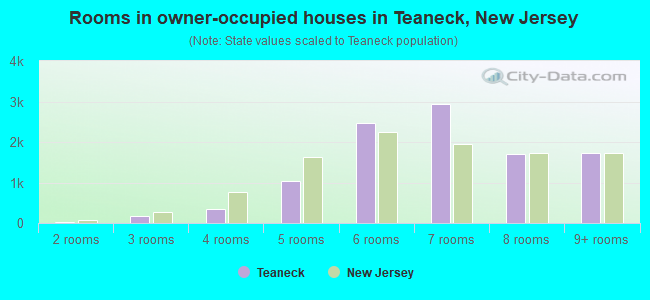
Housing units in Teaneck with a mortgage: 7,171 (800 second mortgage, 963 home equity loan, 50 both second mortgage and home equity loan) Houses without a mortgage: 2,638
In family households: 779,421 (168,972 male householders, 69,583 female householders)
188,466 spouses, 279,702 children (268,784 natural, 4,691 adopted, 6,227 stepchildren), 10,849 grandchildren, 10,453 brothers or sisters, 14,408 parents, foster children, 12,886 other relatives, 15,359 non-relatives
In nonfamily households: 115,273 (40,798 male householders (32,649 living alone)), 56,377 female householders (50,096 living alone)), 18,098 nonrelatives
In group quarters: 10,422 (5,047 institutionalized population)
164,958 married couples with children.
25,129 single-parent households (5,042 men, 20,087 women).
72.6% of residents of Teaneck speak English at home.
10.3% of residents speak Spanish at home (71% speak English very well, 21% speak English well, 7% speak English not well, 1% don't speak English at all).
8.1% of residents speak other Indo-European language at home (69% speak English very well, 18% speak English well, 11% speak English not well, 2% don't speak English at all).
4.8% of residents speak Asian or Pacific Island language at home (62% speak English very well, 25% speak English well, 10% speak English not well, 3% don't speak English at all).
4.2% of residents speak other language at home (82% speak English very well, 15% speak English well, 3% speak English not well).
Foreign born population: 13,022 (30.8%)
(82.5% of them are naturalized citizens)
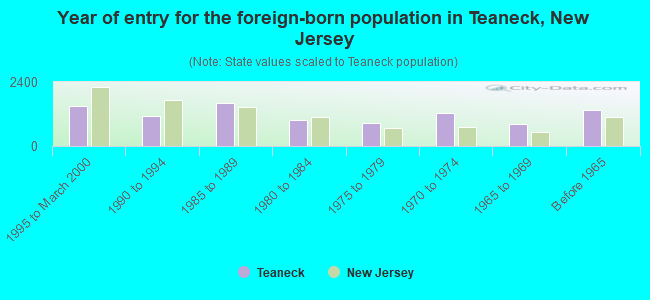
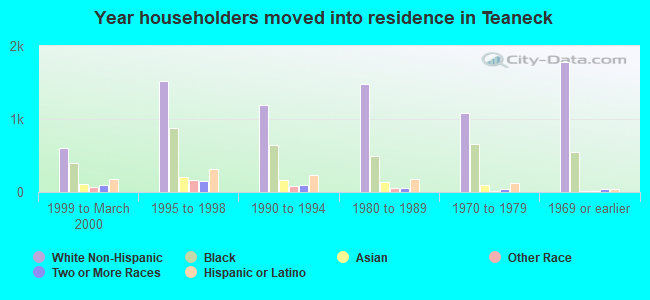
Year of entry for the foreign-born population in Teaneck, New Jersey
1,4841995 to March 2000
1,1331990 to 1994
1,6041985 to 1989
9601980 to 1984
8531975 to 1979
1,2231970 to 1974
8311965 to 1969
1,347Before 1965
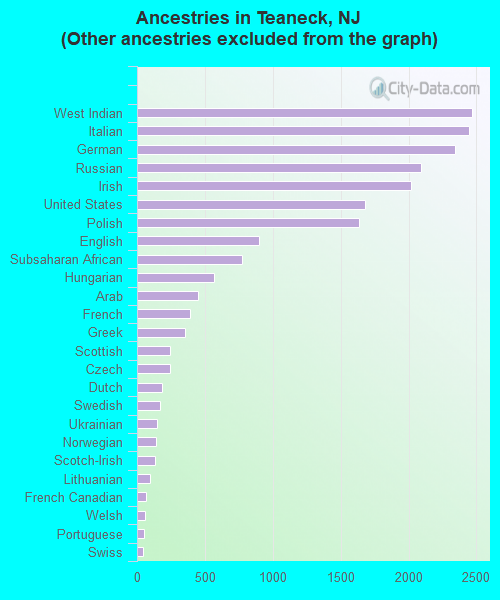
First ancestries reported:
Other: 20,153 (50.5%)
West Indian: 2,469 (6.2%)
Italian: 2,447 (6.1%)
German: 2,342 (5.9%)
Russian: 2,093 (5.2%)
Irish: 2,017 (5.1%)
United States: 1,679 (4.2%)
Polish: 1,632 (4.1%)
English: 902 (2.3%)
Subsaharan African: 775 (1.9%)
Hungarian: 569 (1.4%)
Arab: 446 (1.1%)
French: 387 (1.0%)
Greek: 351 (0.9%)
Scottish: 242 (0.6%)
Czech: 240 (0.6%)
Dutch: 185 (0.5%)
Swedish: 167 (0.4%)
Ukrainian: 150 (0.4%)
Norwegian: 139 (0.3%)
Scotch-Irish: 129 (0.3%)
Lithuanian: 99 (0.2%)
French Canadian: 67 (0.2%)
Welsh: 57 (0.1%)
Portuguese: 53 (0.1%)
Swiss: 42 (0.1%)
Danish: 29 (0.07%)
Slovak: 20 (0.05%)
Most common places of birth for foreign-born residents (%):
Jamaica
Teaneck:
12.4% (1,170)
New Jersey:
2.5% (36,443)
Philippines
Teaneck:
7.0% (664)
New Jersey:
4.7% (69,773)
Dominican Republic
Teaneck:
6.8% (646)
New Jersey:
6.2% (91,316)
India
Teaneck:
5.6% (527)
New Jersey:
8.1% (119,497)
Colombia
Teaneck:
5.2% (487)
New Jersey:
4.7% (69,754)
Germany
Teaneck:
3.8% (355)
New Jersey:
2.3% (33,531)
Canada
Teaneck:
3.1% (296)
New Jersey:
1.1% (16,333)
Trinidad and Tobago
Teaneck:
3.0% (280)
New Jersey:
0.9% (13,289)
Guyana
Teaneck:
2.9% (271)
New Jersey:
1.2% (17,746)
Other Caribbean
Teaneck:
2.9% (269)
New Jersey:
0.5% (7,928)
Pakistan
Teaneck:
2.8% (260)
New Jersey:
1.1% (16,052)
United Kingdom
Teaneck:
2.7% (256)
New Jersey:
2.1% (30,355)
Israel
Teaneck:
2.6% (246)
New Jersey:
0.5% (7,675)
Cuba
Teaneck:
2.5% (240)
New Jersey:
3.7% (55,241)
Russia
Teaneck:
2.1% (197)
New Jersey:
1.4% (20,243)
Haiti
Teaneck:
1.9% (176)
New Jersey:
2.2% (31,963)
Korea
Teaneck:
1.7% (159)
New Jersey:
3.5% (51,970)
Ukraine
Teaneck:
1.6% (151)
New Jersey:
1.0% (14,768)
Place of birth for U.S.-born residents:
This state: 11,397
Other state: 17,905
Northeast: 14,252
Midwest: 806
South: 2,450
West: 397
70% of Teaneck residents lived in the same house 5 years ago. Out of people who lived in different houses, 49% lived in this county. Out of people who lived in different counties, 30% lived in New Jersey.
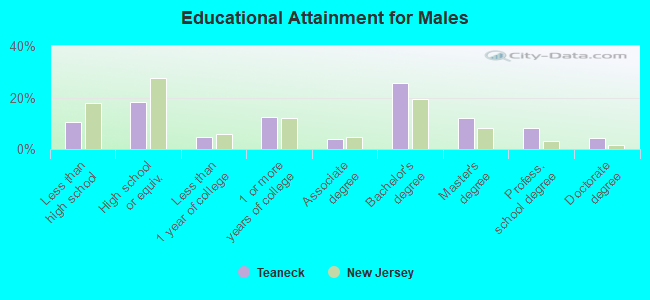
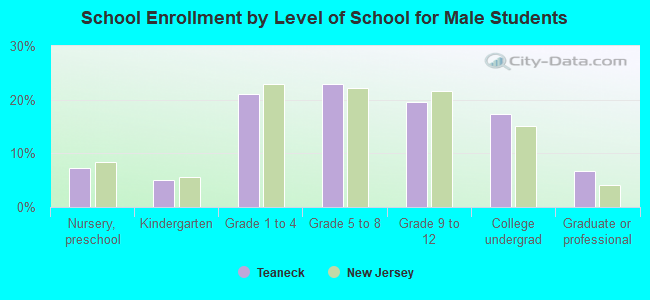
Education attainment for males 25 years and older:
No schooling: 68
Nursery to 4th grade: 54
5th and 6th grade: 71
7th and 8th grade: 157
9th grade: 212
10th grade: 209
11th grade: 97
12th grade, no diploma: 363
High school graduate (or equivalency): 2,137
Less than 1 year of college: 535
Some college more than 1 year, no degree: 1,481
Associate degree: 479
Bachelor's degree: 3,049
Master's degree: 1,416
Professional school degree: 974
Doctorate degree: 521
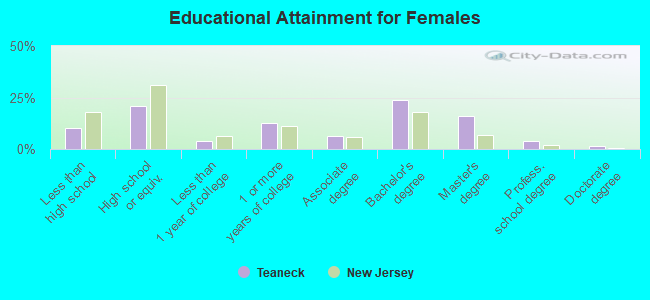
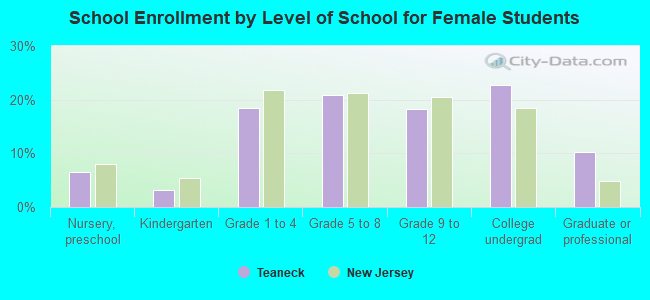
Education attainment for females 25 years and older:
No schooling: 155
Nursery to 4th grade: 60
5th and 6th grade: 162
7th and 8th grade: 198
9th grade: 188
10th grade: 94
11th grade: 117
12th grade, no diploma: 473
High school graduate (or equivalency): 2,943
Less than 1 year of college: 578
Some college more than 1 year, no degree: 1,826
Associate degree: 926
Bachelor's degree: 3,417
Master's degree: 2,313
Professional school degree: 573
Doctorate degree: 208
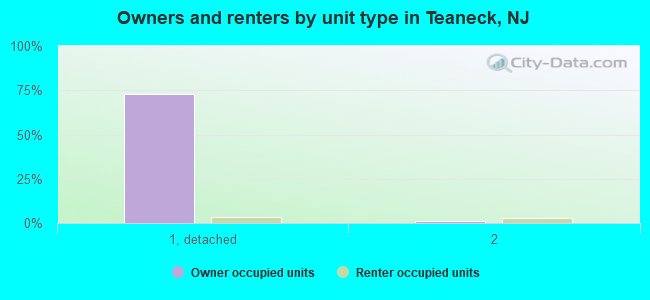
Housing units in structures:
One, detached: 10,334
One, attached: 321
Two: 573
3 or 4: 336
5 to 9: 724
10 to 19: 447
20 to 49: 492
50 or more: 479
Mobile homes: 13
Median worth of mobile homes: $100,657
Housing units lacking complete plumbing facilities: 1.0%
Housing units lacking complete kitchen facilities: 0.6%