Trout Valley, IL (Illinois) Houses and Residents
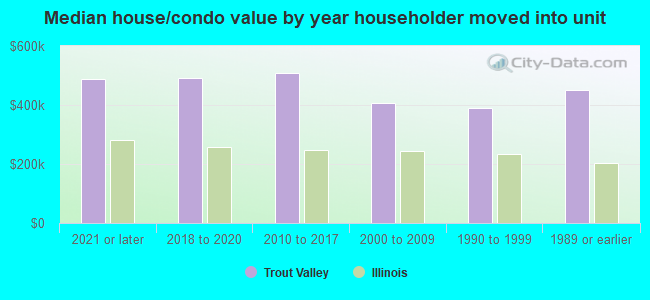
| Trout Valley: | $439,464 |
| Illinois: | $251,600 |
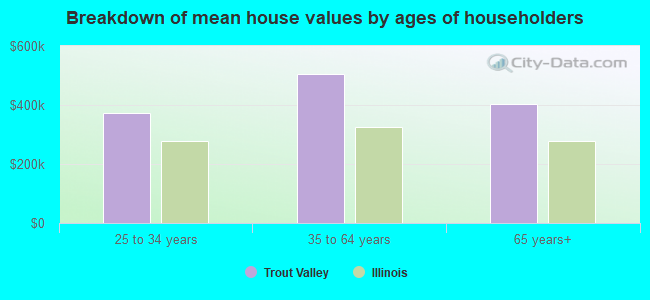
Mean price in 2022:
Detached houses: $528,092
Here: $528,092 State: $310,164
Total population: 530 (All urban)
Houses: 237 (237 occupied: 238 owner occupied, 2 renter occupied)
| % of renters here: | 1% |
| State: | 33% |
Housing density: 554 houses/condos per square mile
Median price asked for vacant for-sale houses and condos in 2022 in this county: $276,011.
Median gross rent in Trout Valley, IL in 2022: $-613,740,457
Housing units in Trout Valley with a mortgage: 143 (10 second mortgage, 0 home equity loan, 7 both second mortgage and home equity loan)
Houses without a mortgage: 4
Median household income for houses/condos with a mortgage: $190,920
Median household income for apartments without a mortgage: $223,638
Median monthly housing costs: $2,216
Compare current foreclosures near Trout Valley, IL:
| Photo | Address | Area | Beds / Baths | Price | Details |
|---|---|---|---|---|---|

|
#1
Glenbrook Dr
Prospect Heights, IL 60070
|
1,550 sq. feet
|
2 baths 3 beds |
$487,000
|
show details |

|
#2
Carriage Way Dr
Arlington Heights, IL 60004
|
- sq. feet
|
2 baths 2 beds |
$192,400
|
show details |

|
#3
N Wren Ave
Palatine, IL 60067
|
1,303 sq. feet
|
1 baths 3 beds |
$409,000
|
show details |

|
#4
Corron Rd
Elgin, IL 60124
|
3,352 sq. feet
|
3 baths 4 beds |
$709,000
|
show details |

|
#5
W809 Bending Ln
Elgin, IL 60124
|
4,100 sq. feet
|
3 baths 4 beds |
$607,000
|
show details |

|
#6
Briar Hill Dr
Schaumburg, IL 60194
|
1,600 sq. feet
|
2 baths 4 beds |
$410,400
|
show details |

|
#7
N Lake Vista Ter
Spring Grove, IL 60081
|
874 sq. feet
|
1 baths 2 beds |
$109,900
|
show details |

|
#8
Wisconsin Ave
Barrington, IL 60010
|
1,297 sq. feet
|
2 baths 3 beds |
$499,000
|
show details |

|
#9
Page Ave
Elgin, IL 60120
|
- sq. feet
|
2 baths 3 beds |
$199,500
|
show details |

|
#10
Highland Ave
Wauconda, IL 60084
|
1,020 sq. feet
|
1 baths 2 beds |
show details |
| Photo | Address | Area | Beds / Baths | Price | Details |
|---|---|---|---|---|---|

|
#11
Lancaster St
Huntley, IL 60142
|
1,914 sq. feet
|
2 baths 3 beds |
show details | |

|
#12
Tappan St
Woodstock, IL 60098
|
925 sq. feet
|
1 baths 3 beds |
show details | |

|
#13
Tilche Ln
Crystal Lake, IL 60014
|
1,449 sq. feet
|
4 baths 3 beds |
show details | |

|
#14
N Braintree Dr
Schaumburg, IL 60194
|
2,265 sq. feet
|
3 baths 4 beds |
show details | |

|
#15
Crossland Dr
Grayslake, IL 60030
|
1,562 sq. feet
|
1 baths 3 beds |
show details | |

|
#16
Fieldbrook Dr
Wauconda, IL 60084
|
2,286 sq. feet
|
3 baths 3 beds |
show details | |

|
#17
Fairway Cir
Barrington, IL 60010
|
1,610 sq. feet
|
2 baths 3 beds |
show details | |

|
#18
Chandler Dr
Mundelein, IL 60060
|
1,344 sq. feet
|
1 baths 3 beds |
show details | |

|
#19
Lippincott Rd
Fox Lake, IL 60020
|
1,247 sq. feet
|
1 baths 3 beds |
show details | |

|
#20
Court Leona
Hanover Park, IL 60133
|
1,680 sq. feet
|
2 baths 4 beds |
show details |
| Photo | Address | Area | Beds / Baths | Price | Details |
|---|---|---|---|---|---|

|
#21
Cherokee Dr
Round Lake, IL 60073
|
1,136 sq. feet
|
2 baths 4 beds |
show details | |

|
#22
Otis Rd
Barrington, IL 60010
|
5,900 sq. feet
|
9 baths 7 beds |
show details | |

|
#23
N Van Buren St
Dundee, IL 60118
|
2,356 sq. feet
|
2 baths 3 beds |
show details | |

|
#24
Cinema Dr W
Hanover Park, IL 60133
|
1,075 sq. feet
|
1 baths 3 beds |
show details | |

|
#25
Morgan Ln
Hoffman Estates, IL 60169
|
1,252 sq. feet
|
1 baths 3 beds |
show details | |

|
#26
Elizabeth Dr
Streamwood, IL 60107
|
1,704 sq. feet
|
2 baths 2 beds |
show details | |

|
#27
Cobblestone Dr
Carpentersville, IL 60110
|
1,553 sq. feet
|
2 baths 3 beds |
show details | |

|
#28
Cherry Ave
Hanover Park, IL 60133
|
1,246 sq. feet
|
1 baths 3 beds |
show details | |

|
#29
Blakely St
Woodstock, IL 60098
|
1,008 sq. feet
|
1 baths 3 beds |
show details | |

|
#30
Oak Leaf Cir
Lake Villa, IL 60046
|
2,344 sq. feet
|
2 baths 4 beds |
show details |
| Photo | Address | Area | Beds / Baths | Price | Details |
|---|---|---|---|---|---|

|
#31
Getty St
Elgin, IL 60120
|
1,280 sq. feet
|
3 baths 3 beds |
show details | |

|
#32
Pond Gate Dr
Barrington, IL 60010
|
4,996 sq. feet
|
2 baths 4 beds |
show details | |

|
#33
Harbor Rd
Wonder Lake, IL 60097
|
2,100 sq. feet
|
2 baths 4 beds |
show details | |

|
#34
E Shady Dr
Palatine, IL 60067
|
2,236 sq. feet
|
2 baths 3 beds |
show details | |

|
#35
Woodlawn Ave
Saint Charles, IL 60174
|
1,427 sq. feet
|
2 baths 4 beds |
show details | |

|
#36
W Washington St
Palatine, IL 60067
|
1,040 sq. feet
|
1 baths 3 beds |
show details | |

|
#37
Partridge Ct
Algonquin, IL 60102
|
1,400 sq. feet
|
2 baths 2 beds |
show details | |

|
#38
Sequoia Dr
Hanover Park, IL 60133
|
1,773 sq. feet
|
2 baths 3 beds |
show details | |

|
#39
Grace Ln
Schaumburg, IL 60193
|
976 sq. feet
|
1 baths 3 beds |
show details | |

|
#40
Wildwood Dr
Mchenry, IL 60051
|
1,340 sq. feet
|
3 baths 2 beds |
show details |
| Photo | Address | Area | Beds / Baths | Price | Details |
|---|---|---|---|---|---|

|
#41
S Hough St
Barrington, IL 60010
|
1,100 sq. feet
|
1 baths 2 beds |
show details | |

|
#42
Woodside Ct
Grayslake, IL 60030
|
3,078 sq. feet
|
2 baths 4 beds |
show details | |

|
#43
Aster Ct
Lake In The Hills, IL 60156
|
2,049 sq. feet
|
2 baths 4 beds |
show details | |

|
#44
Fernwood Ln
Algonquin, IL 60102
|
5,776 sq. feet
|
5 baths 5 beds |
show details | |

|
#45
Pilgrims Pass
Mchenry, IL 60051
|
2,461 sq. feet
|
3 baths 4 beds |
show details | |

|
#46
Meadow Hill Ln
Round Lake, IL 60073
|
1,176 sq. feet
|
1 baths 3 beds |
show details | |

|
#47
Eddy Ln
Lake Zurich, IL 60047
|
1,629 sq. feet
|
2 baths 4 beds |
show details | |

|
#48
N Oltendorf Rd
Streamwood, IL 60107
|
1,235 sq. feet
|
1 baths 2 beds |
show details | |

|
#49
Glenbrook Ct
Gilberts, IL 60136
|
2,895 sq. feet
|
2 baths 5 beds |
show details | |

|
Check over 1 million property listings on Foreclosure.com!
|
browse all offers | |||


 | Suburbs that are obscure or little-known (240 replies) |
| Barrington(s), Tower Lake, Wheaton, Inverness, and ? (55 replies) |
| Company relocating to Schaumburg - where is an affordable place near Schaumburg with good schools? (22 replies) |
| Huntley, vs Crystal lake vs Cary (24 replies) |
| Cary, Il. suburb-I would be thankful for ANY input/help!! (4 replies) |
| Relocating with a family (9 replies) |

Household type by relationship:
Households: 594- Male householders: 117 (24 living alone), Female householders: 118 (11 living alone)
167 spouses (167 opposite-sex spouses), 22 unmarried partners, (20 opposite-sex unmarried partners), 154 children (117 natural, 20 adopted, 17 stepchildren), 3 grandchildren, 1 brothers or sisters, 3 parents, 0 foster children, 3 other relatives, 5 non-relatives
Size of family households: 102 2-persons, 21 3-persons, 35 4-persons, 8 5-persons, 2 6-persons.
Size of nonfamily households: 40 1-person, 29 2-persons, 1 3-persons.
106 married couples with children.
1 single-parent households (0 men, 1 women).
89.6% of residents of Trout Valley speak English at home.
9.9% of residents speak other Indo-European language at home (72% speak English very well, 26% speak English well, 2% speak English not well).
Foreign born population: 57 (9.6%)
(49.1% of them are naturalized citizens)
| Here: | 7.7 |
| State: | 6.4 |
| Here: | -622222221.6 |
| State: | 4.1 |
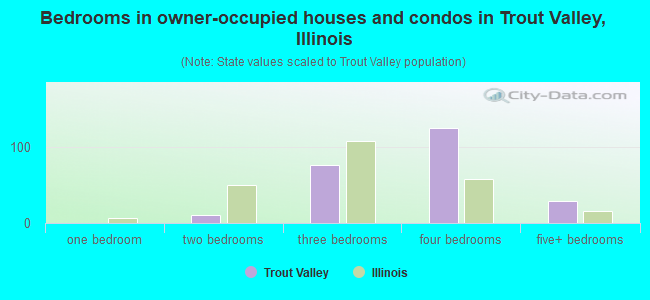
- Bedrooms in owner-occupied houses and condos in Trout Valley, Illinois
- 0no bedroom
- 01 bedroom
- 102 bedrooms
- 763 bedrooms
- 1244 bedrooms
- 295+ bedrooms
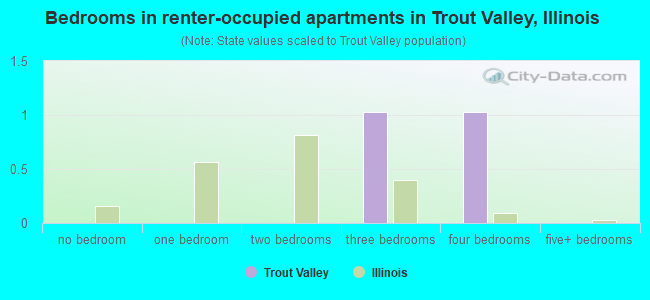
- Bedrooms in renter-occupied apartments in Trout Valley, Illinois
- 0no bedroom
- 01 bedroom
- 02 bedrooms
- 13 bedrooms
- 14 bedrooms
- 05+ bedrooms
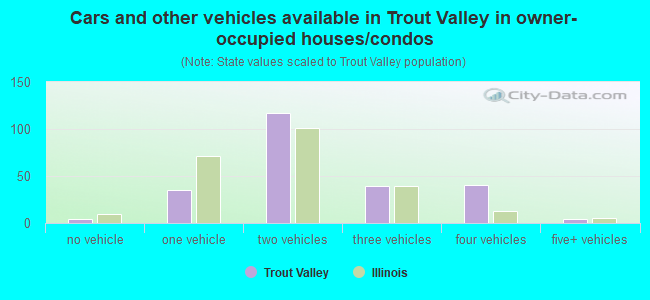
- Cars and other vehicles available in Trout Valley in owner-occupied houses/condos
- 4no vehicle
- 351 vehicle
- 1172 vehicles
- 393 vehicles
- 404 vehicles
- 45+ vehicles
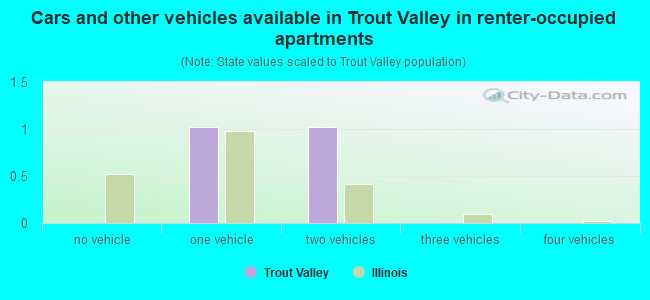
- Cars and other vehicles available in Trout Valley in renter-occupied apartments
- 0no vehicle
- 11 vehicle
- 12 vehicles
- 03 vehicles
- 04 vehicles
- 05+ vehicles
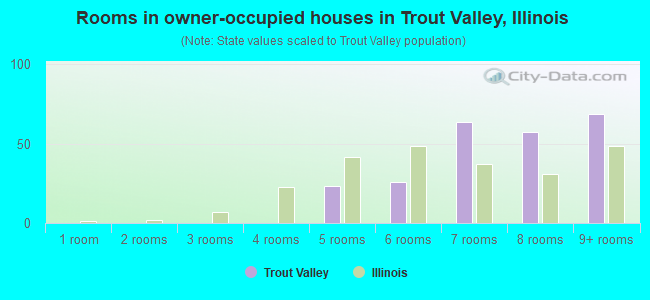
- Rooms in owner-occupied houses in Trout Valley, Illinois
- 01 room
- 02 rooms
- 03 rooms
- 04 rooms
- 245 rooms
- 266 rooms
- 647 rooms
- 578 rooms
- 699+ rooms
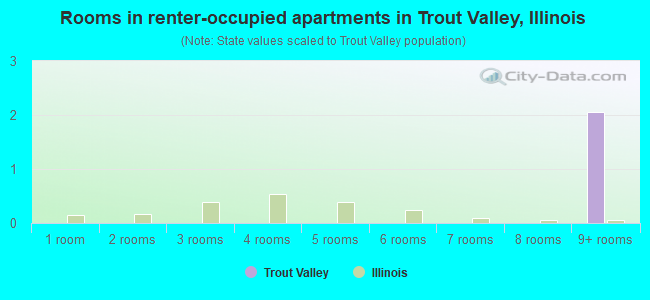
- Rooms in renter-occupied apartments in Trout Valley, Illinois
- 01 room
- 02 rooms
- 03 rooms
- 04 rooms
- 05 rooms
- 06 rooms
- 07 rooms
- 08 rooms
- 29+ rooms
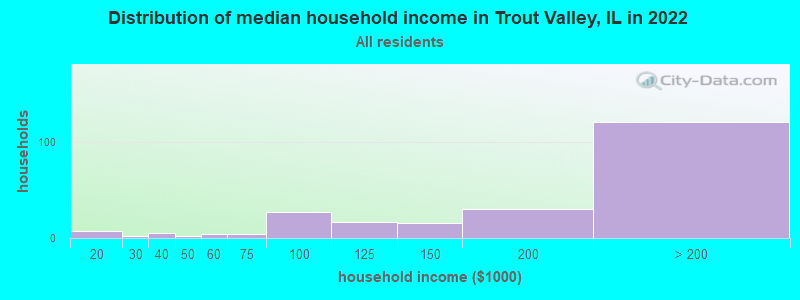
Trout Valley, IL household income distribution

- 1Less than $10,000
- 7$10,000 to $19,999
- 2$20,000 to $29,999
- 5$30,000 to $39,999
- 2$40,000 to $49,999
- 4$50,000 to $59,999
- 4$60,000 to $74,999
- 27$75,000 to $99,999
- 17$100,000 to $124,999
- 16$125,000 to $149,999
- 30$150,000 to $199,999
- 121$200,000 or more
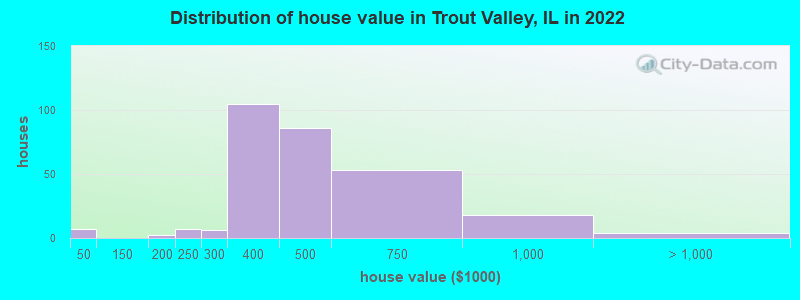
Home value of owner - occupied houses in 2022 in Trout Valley, IL
-
- 1Less than $10,000
- 5$15,000 to $19,999
- 1$175,000 to $199,999
- 6$200,000 to $249,999
- 6$250,000 to $299,999
- 104$300,000 to $399,999
- 86$400,000 to $499,999
- 52$500,000 to $749,999
- 18$750,000 to $999,999
- 4$1,000,000 to $1,499,999
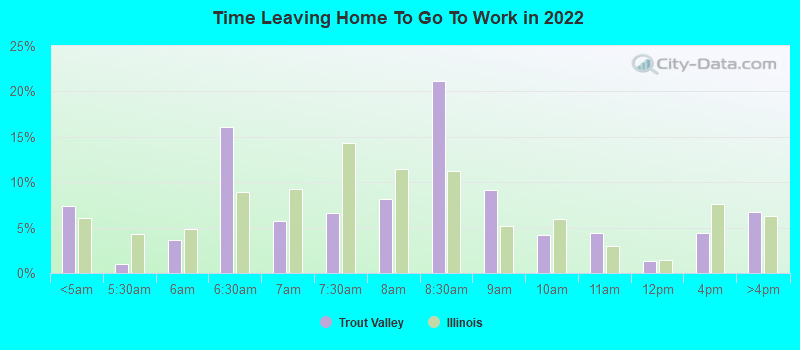
Percentage of workers working in this county: 52.9%
Number of people working at home: 61 (17.4% of all workers)
Travel time to work (commute)
- Less than 5 minutes: 4
- 5 to 9 minutes: 26
- 10 to 14 minutes: 34
- 15 to 19 minutes: 12
- 20 to 24 minutes: 14
- 25 to 29 minutes: 35
- 30 to 34 minutes: 37
- 35 to 39 minutes: 10
- 40 to 44 minutes: 19
- 45 to 59 minutes: 31
- 60 to 89 minutes: 40
- 90 or more minutes: 22
Means of transportation to work:
- Drove a car alone: 203 (76.3%)
- Carpooled: 4 (1.5%)
- Railroad: 34 (12.8%)
- Taxi: 2 (0.8%)
- Walked: 5 (1.9%)
- Other means: 2 (0.8%)
- Worked at home: 16 (6.0%)
- Unemployment by race in 2022
- Unemployment rate for White non-Hispanic residents
- 1.0%Males
- 2.4%Females
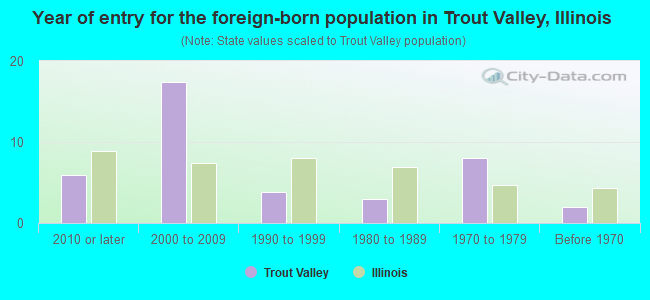
- Year of entry for the foreign-born population in Trout Valley, Illinois
- 62010 or later
- 172000 to 2009
- 41990 to 1999
- 31980 to 1989
- 81970 to 1979
- 2Before 1970
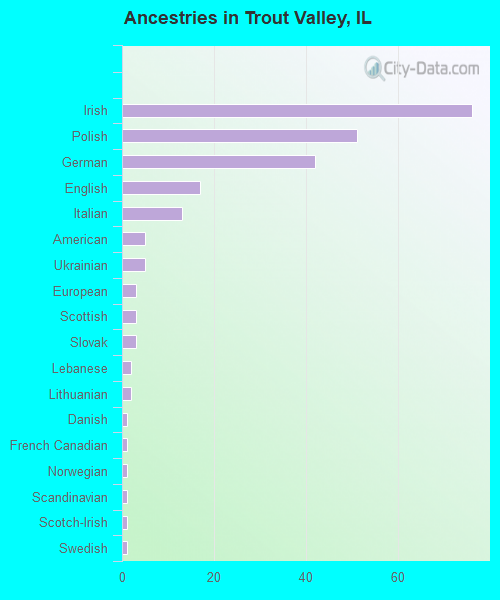
First ancestries reported:
- Irish: 76 (29.5%)
- Polish: 51 (19.8%)
- German: 42 (16.3%)
- English: 17 (6.6%)
- Italian: 13 (5.0%)
- American: 5 (1.9%)
- Ukrainian: 5 (1.9%)
- European: 3 (1.2%)
- Scottish: 3 (1.2%)
- Slovak: 3 (1.2%)
- Lebanese: 2 (0.8%)
- Lithuanian: 2 (0.8%)
- Danish: 1 (0.4%)
- French Canadian: 1 (0.4%)
- Norwegian: 1 (0.4%)
- Scandinavian: 1 (0.4%)
- Scotch-Irish: 1 (0.4%)
- Swedish: 1 (0.4%)
Most common places of birth for foreign-born residents (%):
| Trout Valley: | 50.9% (27) |
| Illinois: | 6.9% (124,474) |
| Trout Valley: | 15.1% (8) |
| Illinois: | 1.6% (29,316) |
| Trout Valley: | 13.2% (7) |
| Illinois: | 0.9% (15,679) |
| Trout Valley: | 9.4% (5) |
| Illinois: | 0.5% (8,551) |
| Trout Valley: | 1.9% (1) |
| Illinois: | 0.0% (676) |
| Trout Valley: | 1.9% (1) |
| Illinois: | 0.5% (9,834) |
| Trout Valley: | 1.9% (1) |
| Illinois: | 0.6% (10,249) |
Place of birth for U.S.-born residents:
- This state: 393
- Other state: 138
- Northeast: 19
- Midwest: 74
- South: 12
- West: 34
90.2% of Trout Valley residents lived in the same house 1 years ago.
Out of people who lived in different houses, 1.8% lived in this county.
Out of people who lived in different counties, 95.8% lived in Illinois.
| Trout Valley: | 90.2% |
| State average: | 88.3% |
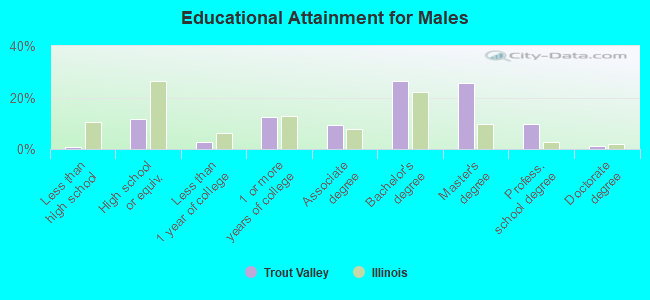
Education attainment for males 25 years and older:
- No schooling: 0
- Nursery to 4th grade: 0
- 5th and 6th grade: 0
- 7th and 8th grade: 0
- 9th grade: 0
- 10th grade: 0
- 11th grade: 0
- 12th grade, no diploma: 2
- High school graduate (or equivalency): 27
- Less than 1 year of college: 6
- Some college more than 1 year, no degree: 29
- Associate degree: 21
- Bachelor's degree: 61
- Master's degree: 59
- Professional school degree: 22
- Doctorate degree: 3
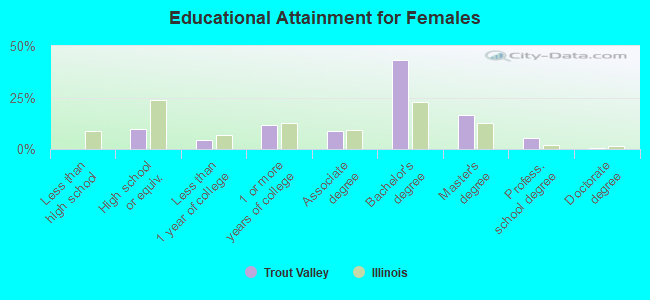
Education attainment for females 25 years and older:
- No schooling: 0
- Nursery to 4th grade: 0
- 5th and 6th grade: 0
- 7th and 8th grade: 0
- 9th grade: 0
- 10th grade: 0
- 11th grade: 0
- 12th grade, no diploma: 0
- High school graduate (or equivalency): 21
- Less than 1 year of college: 10
- Some college more than 1 year, no degree: 25
- Associate degree: 19
- Bachelor's degree: 95
- Master's degree: 36
- Professional school degree: 12
- Doctorate degree: 1


Housing units in structures:
- One, detached: 235
- 3 or 4: 2
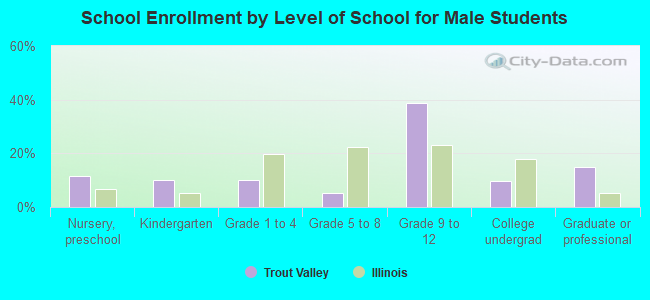
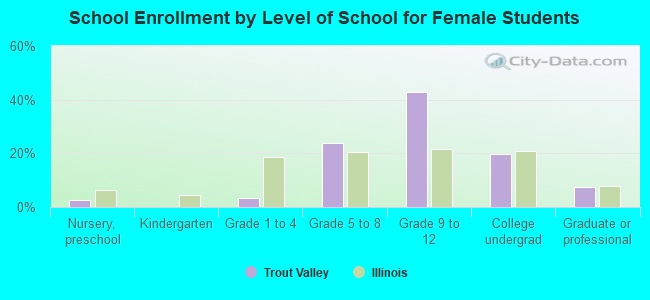
Private vs. public school enrollment:
| Here: | 8.0% |
| Illinois: | 13.3% |
| Here: | 2.1% |
| Illinois: | 9.9% |
| Here: | 0.0% |
| Illinois: | 27.4% |